列线图,又称诺莫图(Nomogram),它是建立在回归分析的基础上,使用多个临床指标或者生物属性,然后采用带有分数高低的线段,从而达到设置的目的:基于多个变量的值预测一定的临床结局或者某类事件发生的概率。列线图(Nomogram)可以用于多指标联合诊断或预测疾病发病或进展。
近些年来在高质量SCI临床论文中用的越来越多。列线图将回归模型转换成了可以直观的视图,让结果更容易判断,具有可读性,例如:
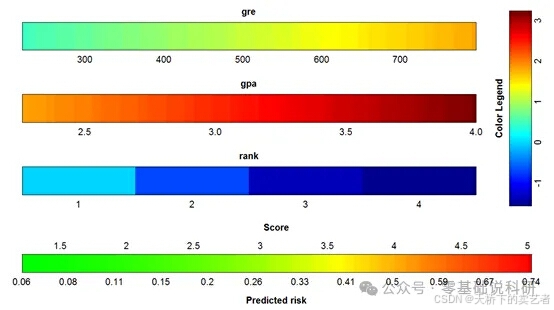
咱们既往已经多篇文章介绍绘制列线图,今天咱们来视频介绍一下VRPM包绘制彩色列线图,这个包可以绘制多个模型的列线图,咱们一一来介绍。
R语言VRPM绘制多种模型的彩色列线图
代码
r
# install.packages("devtools")  # 安装devtools包
# devtools::install_github("nanxstats/VRPM")  # 安装VRPM包
# 或者在我的公众号吧这个包下载下来(公众号回复:VRPM包),手动安装

library(VRPM)
library(survival)
setwd("E:/公众号文章2024年/代码+视频/代码+视频VRPM包绘制彩色评分图")
mydata <- read.csv("mydata.csv")
mydata$rank <- factor(mydata$rank)
fit <- glm(admit ~ gre + gpa + rank, data = mydata, family = "binomial")
colplot(fit)
colplot(fit,coloroptions=1)
colplot(fit,coloroptions=3)

#### cox比例风险回归
library(mfp)
data(GBSG)
fit<-coxph(Surv(rfst, cens) ~ age+tumsize+posnodal+prm+esm+menostat+tumgrad, data = GBSG,
           model=TRUE)
colplot(fit)
str(GBSG)
str(bc)
##########
library(foreign)
bc <- read.spss("E:/r/test/Breast cancer survival agec.sav",
                use.value.labels=F, to.data.frame=T)
bc <- na.omit(bc)
bc$histgrad<-as.factor(bc$histgrad)
bc$er<-as.factor(bc$er)
bc$pr<-as.factor(bc$pr)
bc$ln_yesno<-as.factor(bc$ln_yesno)
bc$time<-as.integer(bc$time)
fit1<-coxph(Surv(time,status)~er+histgrad+pr+age+ln_yesno,bc,model=TRUE)  #model=TRUE一定要有
colplot(fit1)


#### 多项式逻辑回归模型
library(nnet)
library(VGAMdata)
data(xs.nz)
marital.nz <- xs.nz[,c("marital","sex","age","height","weight")]
mydata <- marital.nz[complete.cases(marital.nz),]
str(mydata)
fit <- multinom(marital ~ sex + age + height + weight, data = mydata,model=TRUE)
# for multinimial logistic regression, a vector of risk labels needs to be made
# and provided to the colplot function
outnames=colnames(fitted(fit))
labels=c(paste("Linear predictor for",outnames[-1]),paste
         ("Predicted chance of being",outnames))
# visualize the model: more than one plot is generated in the current directory
colplot(fit,coloroptions=3,risklabel=labels,filename="div")  #生成div开头的图片


#### 支持向量机分类器
## Not run:
library(kernlab)
data(iris)
levels(iris$Species)[levels(iris$Species)=="setosa"] <- "other"
levels(iris$Species)[levels(iris$Species)=="virginica"] <- "other"
names(iris)=c("SL","SW","PL","PW","Species")
# RBF kernel
model <-ksvm(Species ~ ., data = iris,prob.model=TRUE,kpar=list(0.03),C=10)
# The plot should be based on all training data, so the following code should be used:
newmodel=preplotperf(model,iris,indy=5,zerolevel="min") #对模型和数据进行处理
colplot(newmodel,filename="IRIS2",zerolevel="min",coloroptions=5)