NextJS 中如何调试服务器端代码,根据官方文档设置 Chrome 调试,这里有个坑,来看下面配置:
{
"scripts": {
"dev": "NODE_OPTIONS='--inspect' next dev"
}
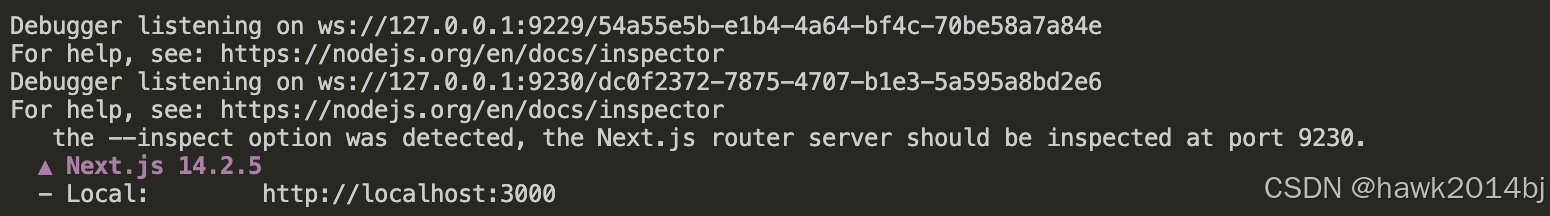
}启动成功,有两个端口 9229、9230,需要监听在 9230,官方文档并没有提到。
打开 Chrome 浏览器输入网址,点击 Inspect
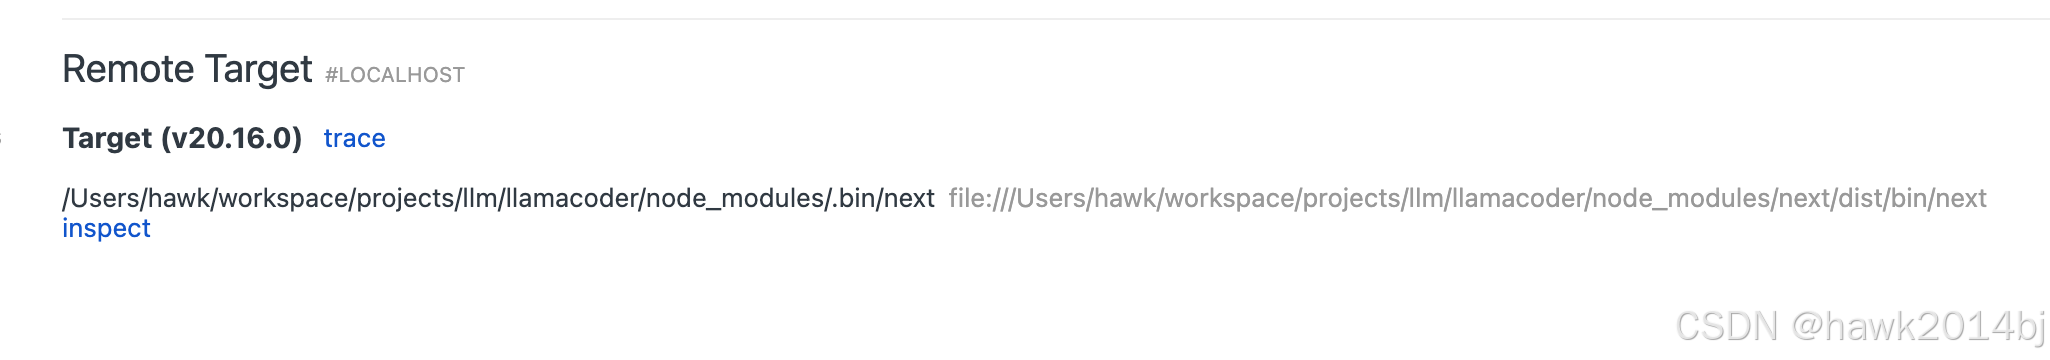
没有看到我们自己代码,根据官方文档说明,应该可以看到我们自己的应用名。

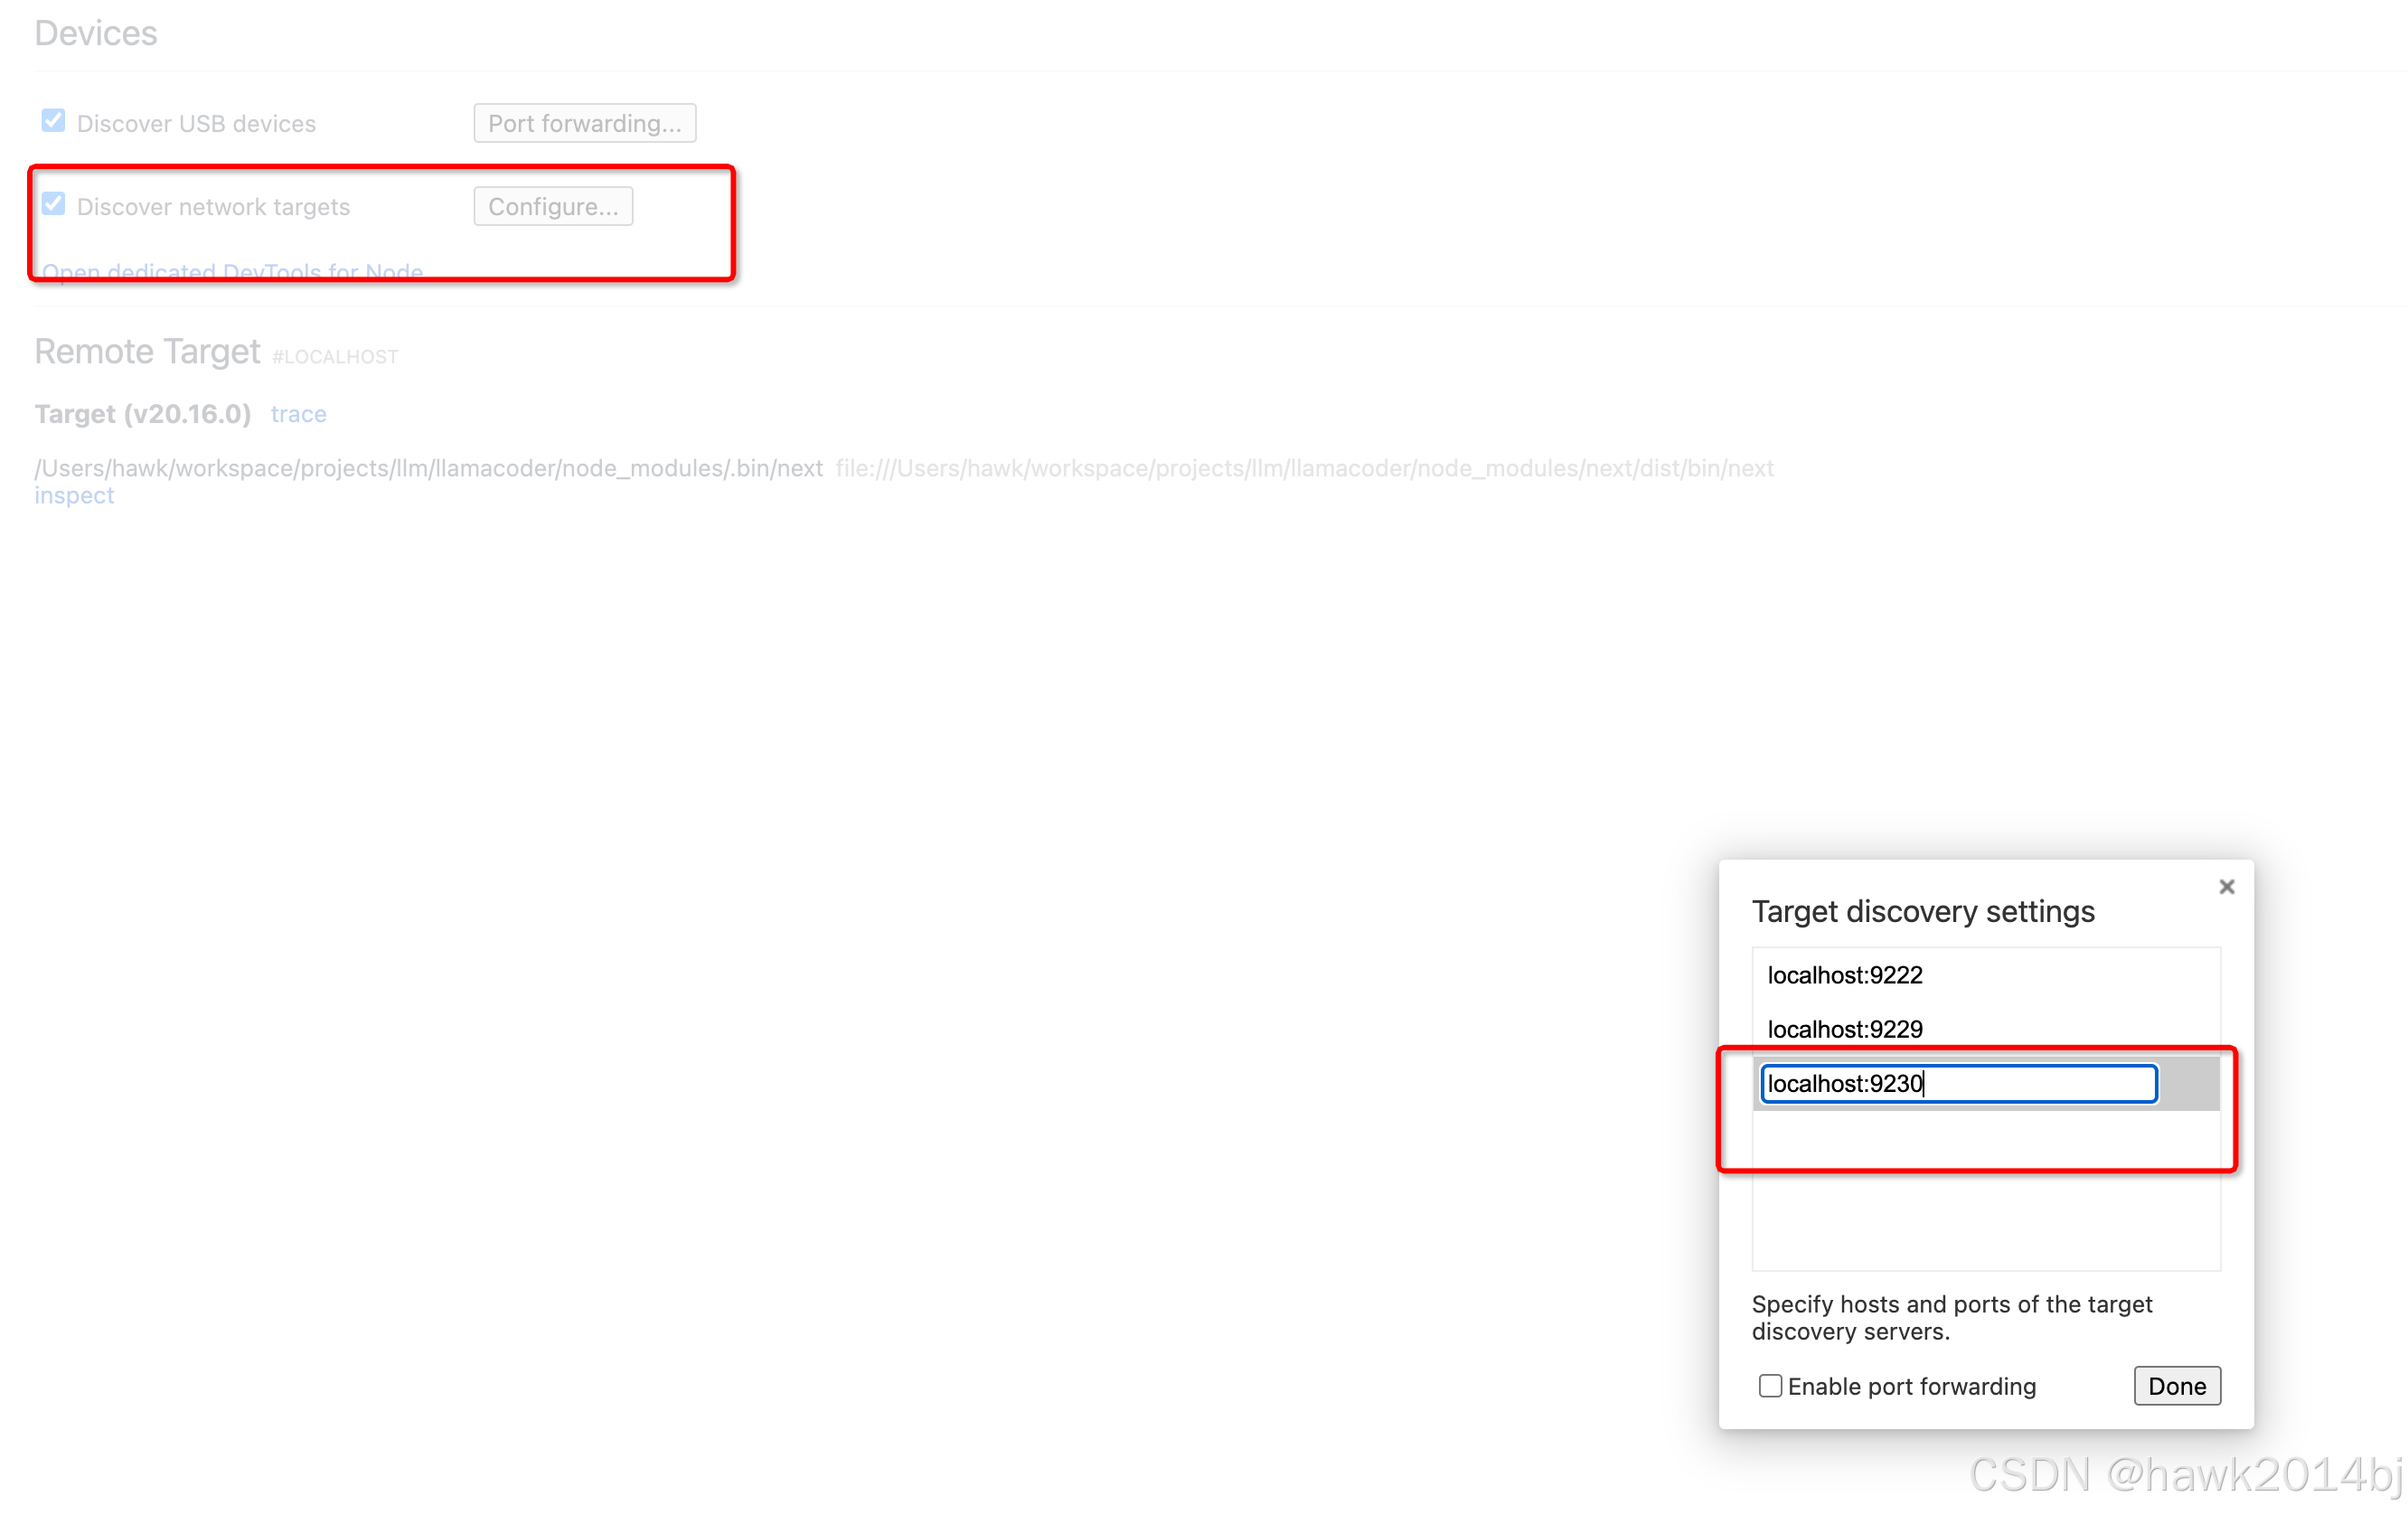
问题出现在端口上,需要打开 9230。

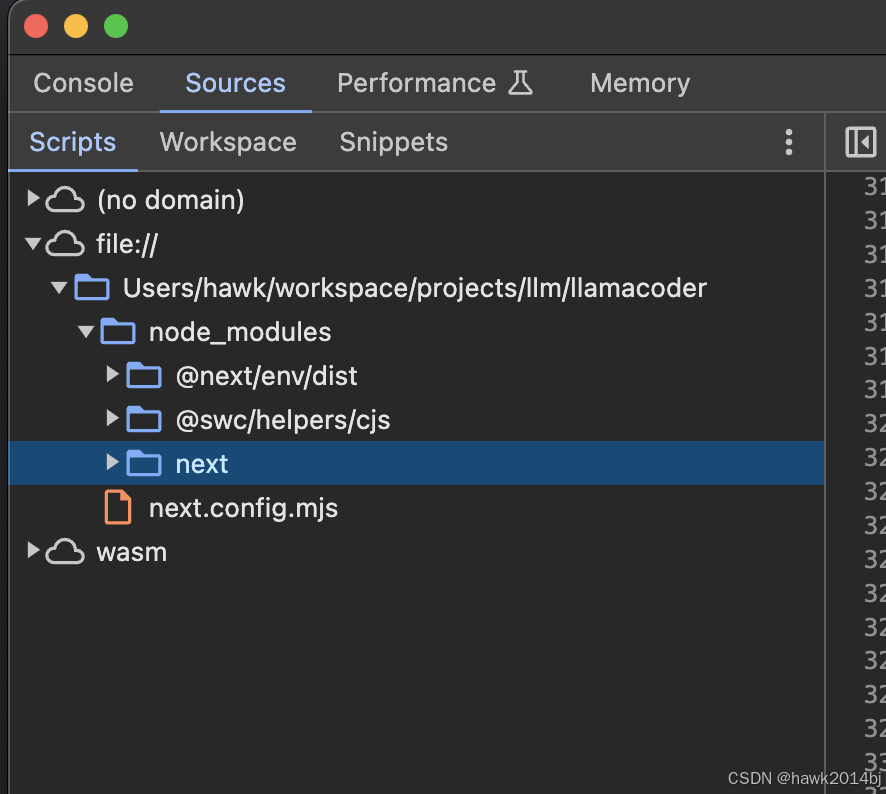
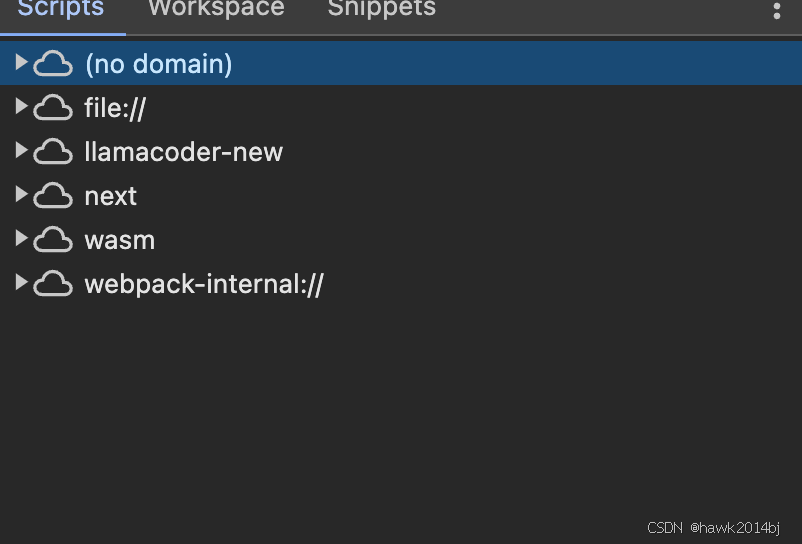
创建成功后点击新添加的 Inspect,可以我们的代码已经显示出来了。
这样可以正常 Debug 了,可以通过 VSCode Debug,添加一个 Attach 类型的 Debugger。
{
    "name": "Attach",
    "port": 9230,
    "request": "attach",
    "skipFiles": ["<node_internals>/**"],
    "type": "node",
    "cwd": "${workspaceFolder}"
},
总结
Debug 这里主要的问题还是端口,端口配置正确之后,一切问题迎刃而解。