//非常全面易懂的教程
1.语法
当我们直接使用监控指标名称查询时,可以查询该指标下的所有时间序列,只会返回瞬时向量表达式,返回值中只会包含该时间序列中的最新的一个样本值:
bash
http_requests_total{code="200",handler="alerts",instance="localhost:9090",job="prometheus",method="get"}=(20889@1518096812.326)
http_requests_total{code="200",handler="graph",instance="localhost:9090",job="prometheus",method="get"}=(21287@1518096812.326)
http_requests_total   //直接使用监控指标名称查询时,可以查询该指标下的所有时间序列。如上。
http_requests_total{}
1.1 筛选
PromQL支持使用=和!=两种完全匹配模式:
- 通过使用
label=value可以选择那些标签满足表达式定义的时间序列; - 反之使用
label!=value则可以根据标签匹配排除时间序列;
需要查询所有http_requests_total时间序列中满足或不满足标签instance为localhost:9090的时间序列:
bash
http_requests_total{instance="localhost:9090"}
http_requests_total{instance!="localhost:9090"}除了使用完全匹配的方式对时间序列进行过滤以外,PromQL还可以支持使用正则表达式作为匹配条件,多个表达式之间使用|进行分离:
- 使用
label=~regx表示选择那些标签符合正则表达式定义的时间序列; - 反之使用
label!~regx进行排除; (这里~号是什么意思?可以理解为表示正则的符号?)
例如,如果想查询多个环节下的时间序列序列可以使用如下表达式:
bash
http_requests_total{environment=~"staging|testing|development",method!="GET"} 1.3 范围查询
bash
http_request_total{} # 瞬时向量表达式,选择当前最新的数据
http_requests_total{}[5m] //选择最近5分钟内的所有样本数据

//时间位移操作
http_request_total{} offset 5m  //5分钟前的瞬时样本数据
http_request_total{}[1d] offset 1d //昨天一天的区间内的样本数据
2.内置函数
2.1 sum和sum_over_time
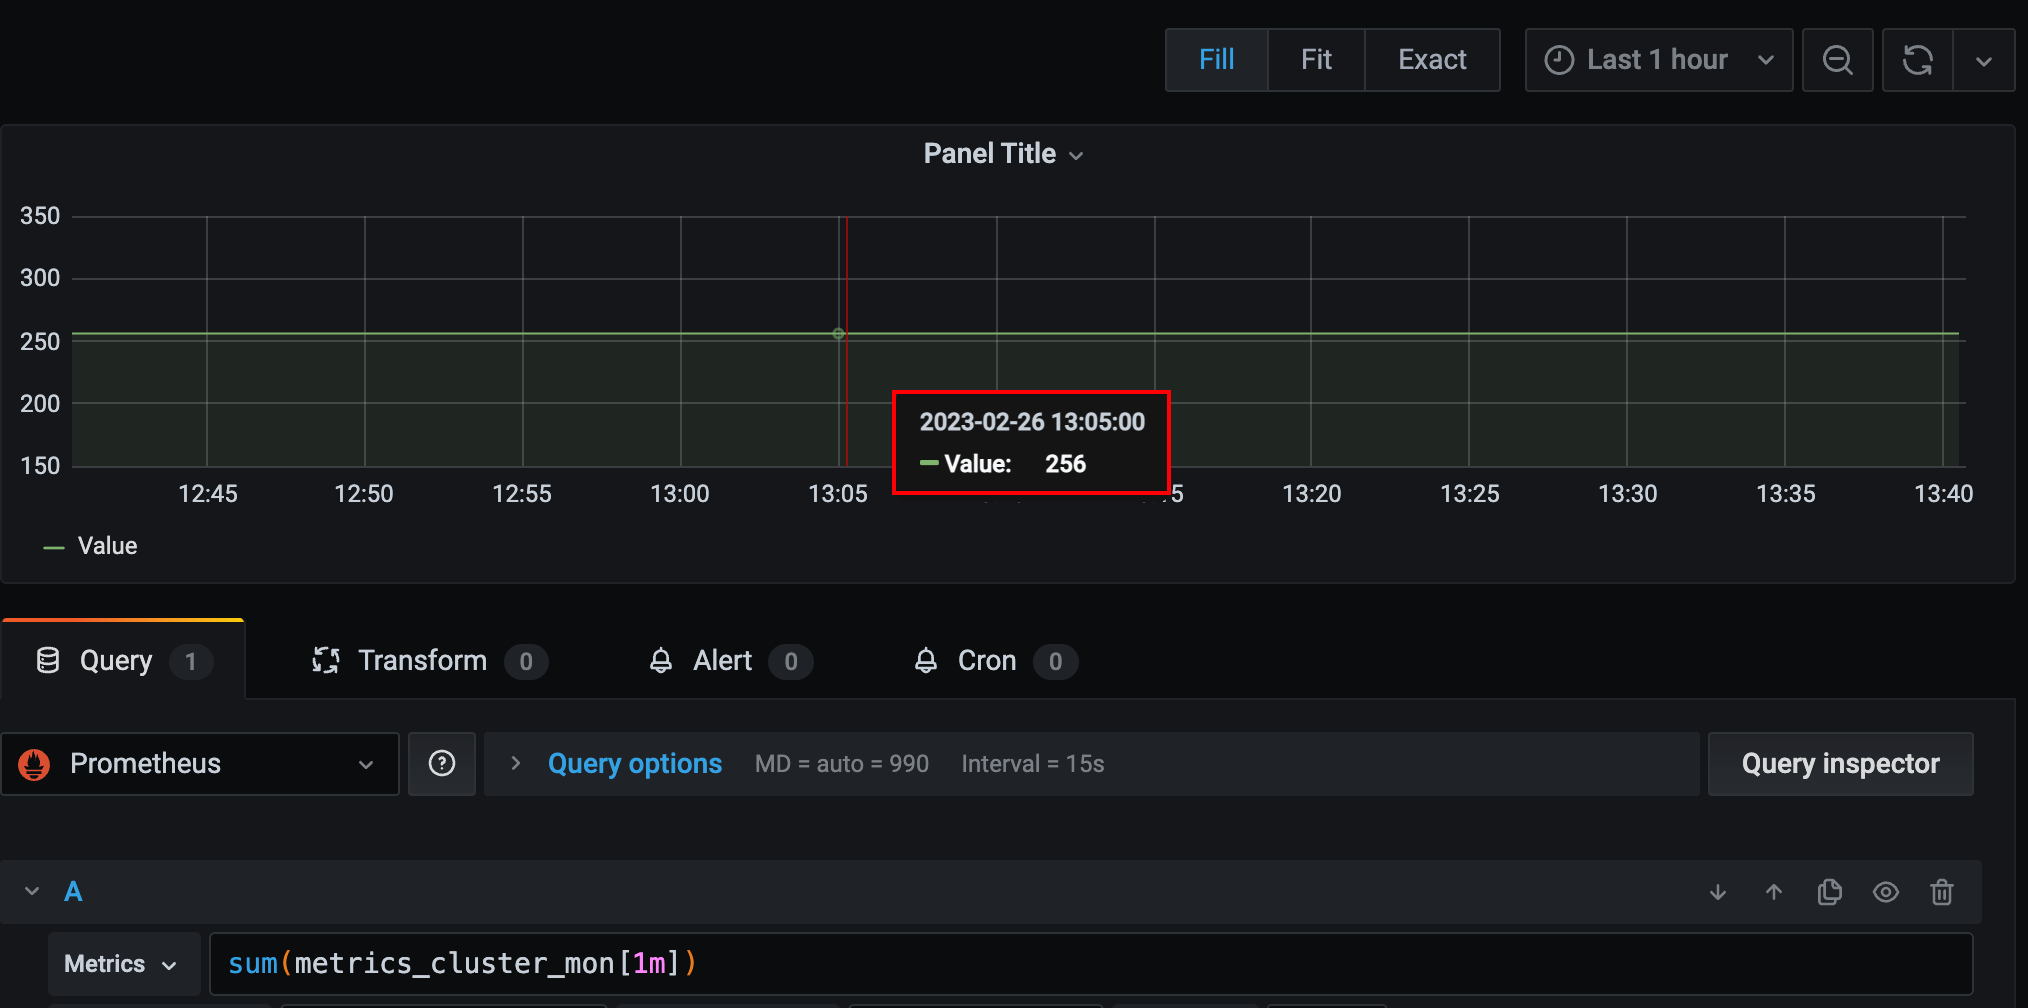
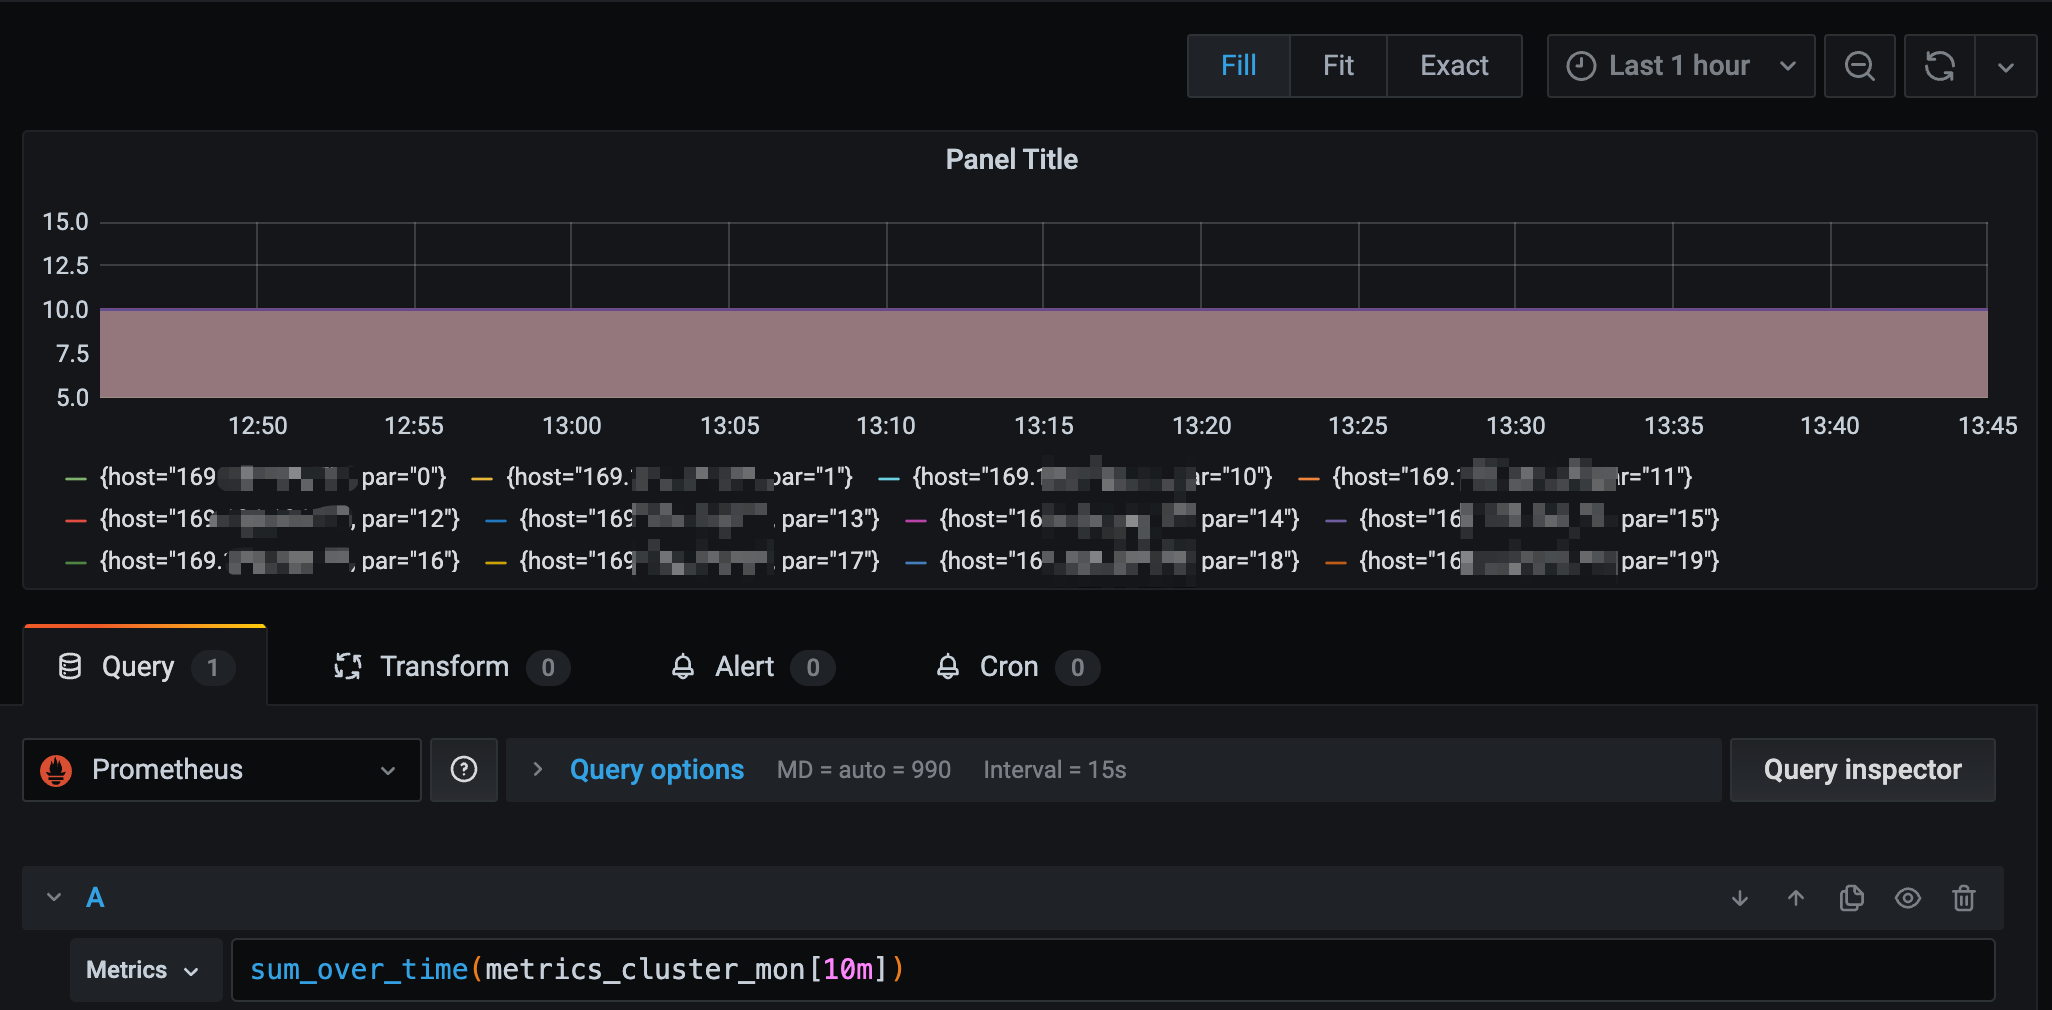
sum(求和)。所有序列 最新一个数据(瞬时向量)求和,sum是对瞬时向量求和,不会对区间向量求和。返回的时间序列是没有标签的。sum_over_time(range-vector): 区间向量内每个度量指标的求和。各序列 (tag组合维度)的2分钟数据(区间向量)求和。avg_over_time(range-vector): 区间向量内每个度量指标的平均值。【需要传入区间向量。】
sum/avg_over_time是给各序列求区间内 的和/平均,sum/avg再结合by按照维度再求平均。
sum不区分tag维度,所有的瞬时向量一起求和。返回的时间序列是没有标签的。
sum_over_time对各个序列单独求和,是对区间向量进行的。
2.2 absent
https://prometheus.fuckcloudnative.io/di-san-zhang-prometheus/di-4-jie-cha-xun/functions
2.3 增长情况
rate是求平均增长率,长尾效应无法避免,
increase是求区间第一个和最后一个之间的增长率。
还有irate。
3. 原理
Prometheus Server并不直接服务监控特定的目标,其主要任务负责数据的收集 ,存储并且对外提供数据查询支持 。为了能够能够监控到某些东西,我们需要使用到Exporter。Prometheus周期性地从Exporter暴露的HTTP服务地址(通常是**/metrics**)拉取监控样本数据。
Exporter可以是一个独立运行的程序独立于监控目标以外,也可以是直接内置在监控目标中。只要能够向Prometheus提供标准格式的监控样本数据 即可。exporter是什么:https://yunlzheng.gitbook.io/prometheus-book/part-ii-prometheus-jin-jie/exporter/what-is-prometheus-exporter
exporter提供的数据类型必须是这样:
bash
# HELP node_cpu Seconds the cpus spent in each mode.
# TYPE node_cpu counter
node_cpu{cpu="cpu0",mode="idle"} 362812.7890625
# HELP node_load1 1m load average.
# TYPE node_load1 gauge
node_load1 3.0703125
由三个部分组成:
- 样本的一般注释信息(HELP)。# HELP <metrics_name> <doc_string>
- 样本的类型注释信息(TYPE)# TYPE <metrics_name> <metrics_type>
- 样本。格式:
bash
metric_name [
  "{" label_name "=" `"` label_value `"` { "," label_name "=" `"` label_value `"` } [ "," ] "}"
] value [ timestamp ]
value是一个float格式的数据,timestamp的类型为int64(从1970-01-01 00:00:00以来的毫秒数),timestamp为可选,默认为当前时间。