地图放大
地图缩小
代码:
import * as mars3d from "mars3d"
export let map // mars3d.Map三维地图对象
// 需要覆盖config.json中地图属性参数(当前示例框架中自动处理合并)
export const mapOptions = {
scene: {
center: { lat: 25.873121, lng: 119.290515, alt: 51231, heading: 2, pitch: -71 },
showSun: false,
showMoon: false,
showSkyBox: false,
showSkyAtmosphere: false,
fog: false,
backgroundColor: "#363635", // 天空背景色
contextOptions: { webgl: { antialias: mars3d.Util.isPCBroswer() } },
logarithmicDepthBuffer: false, // 对数深度缓冲区[当热力图出现阴影体或遮挡时设置下]
globe: {
baseColor: "#363635", // 地球地面背景色
showGroundAtmosphere: false,
enableLighting: false
},
cameraController: {
zoomFactor: 1.5,
minimumZoomDistance: 0.1,
maximumZoomDistance: 200000,
enableCollisionDetection: false // 允许进入地下
}
}
}
/**
* 初始化地图业务,生命周期钩子函数(必须)
* 框架在地图初始化完成后自动调用该函数
* @param {mars3d.Map} mapInstance 地图对象
* @returns {void} 无
*/
export function onMounted(mapInstance) {
map = mapInstance // 记录map
// map.basemap = 2017 // 暗色底图
mars3d.Util.fetchJson({ url: "//data.mars3d.cn/file/apidemo/heat-fuzhou.json" }).then(function (result) {
const arrPoints = []
for (let i = 0; i < result.Data.length; i++) {
const item = result.Data[i]
arrPoints.push({ lng: item.x, lat: item.y, value: item.t0 })
}
showHeatMap(arrPoints)
})
// addTerrainClip()
}
/**
* 释放当前地图业务的生命周期函数
* @returns {void} 无
*/
export function onUnmounted() {
map = null
}
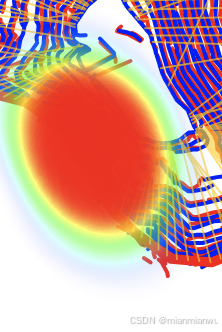
function showHeatMap(arrPoints) {
// 热力图 图层
const heatLayer = new mars3d.layer.HeatLayer({
positions: arrPoints,
// 以下为热力图本身的样式参数,可参阅api:https://www.patrick-wied.at/static/heatmapjs/docs.html
max: 20000,
heatStyle: {
radius: 20,
minOpacity: 0,
maxOpacity: 0.4,
blur: 0.3,
gradient: {
0: "#e9ec36",
0.25: "#ffdd2f",
0.5: "#fa6c20",
0.75: "#fe4a33",
1: "#ff0000"
}
},
// 以下为矩形矢量对象的样式参数
style: {
opacity: 1.0
// clampToGround: true,
},
redrawZoom: true, // 视角缩放时是否进行按新的raduis进行渲染。
flyTo: true
})
map.addLayer(heatLayer)
window.heatLayer = heatLayer
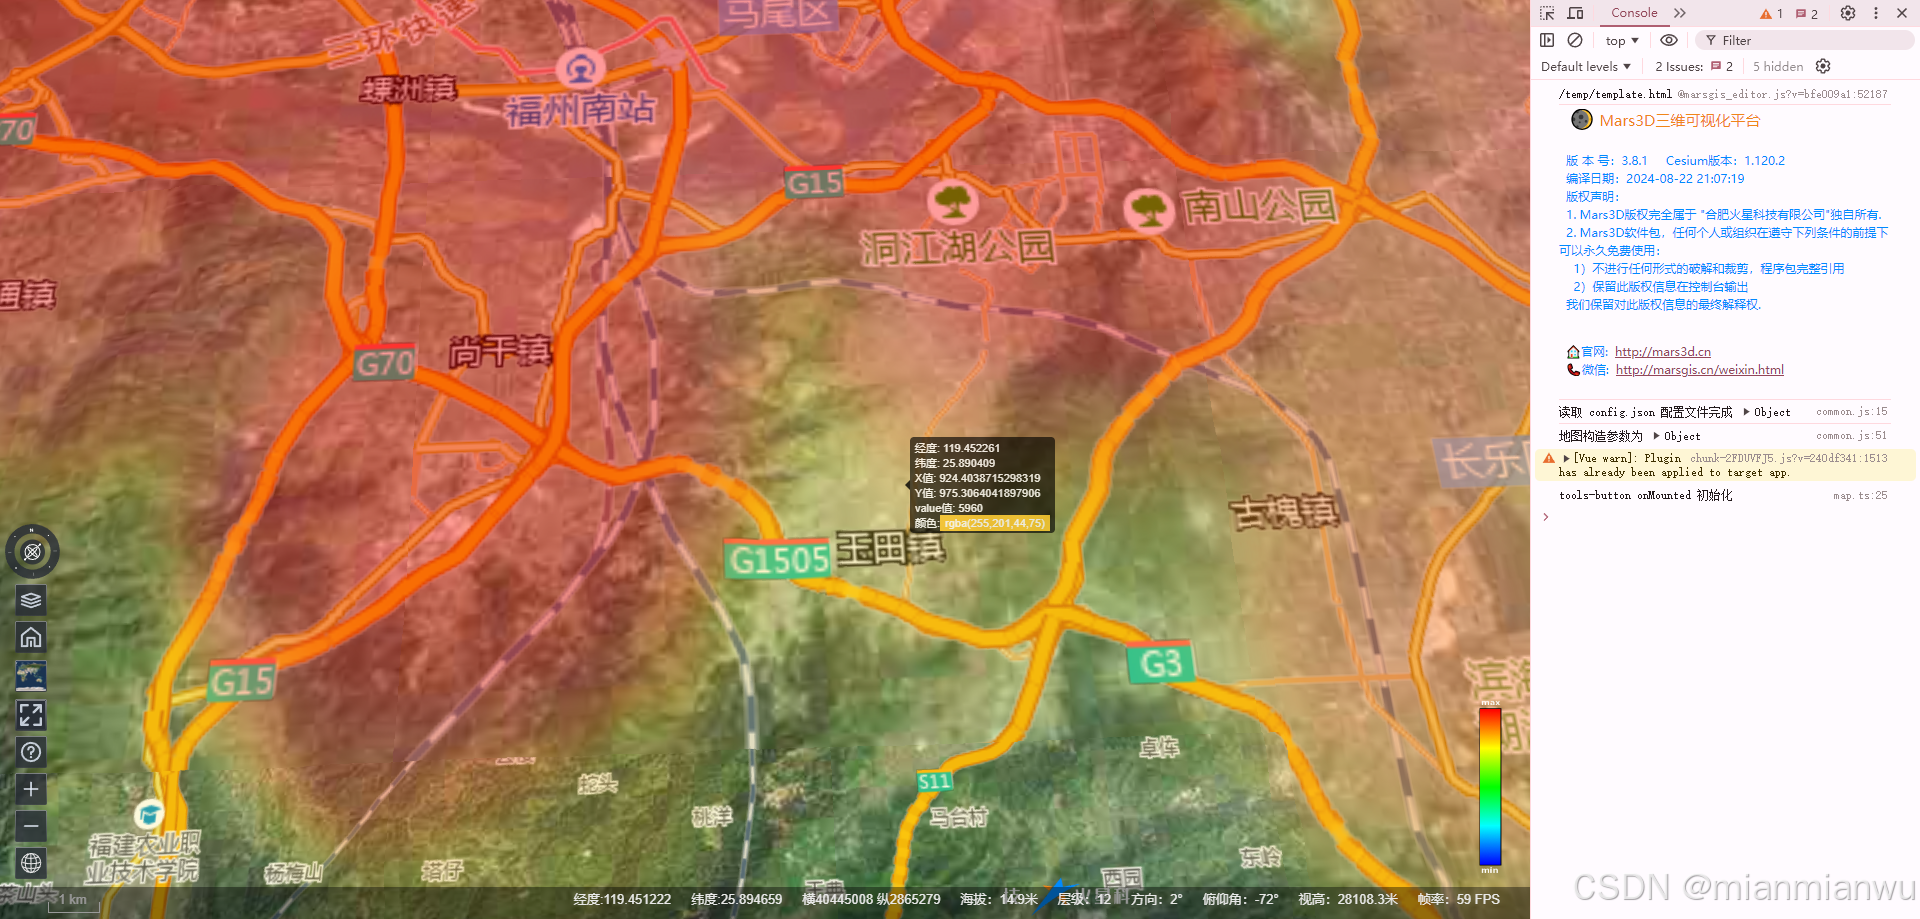
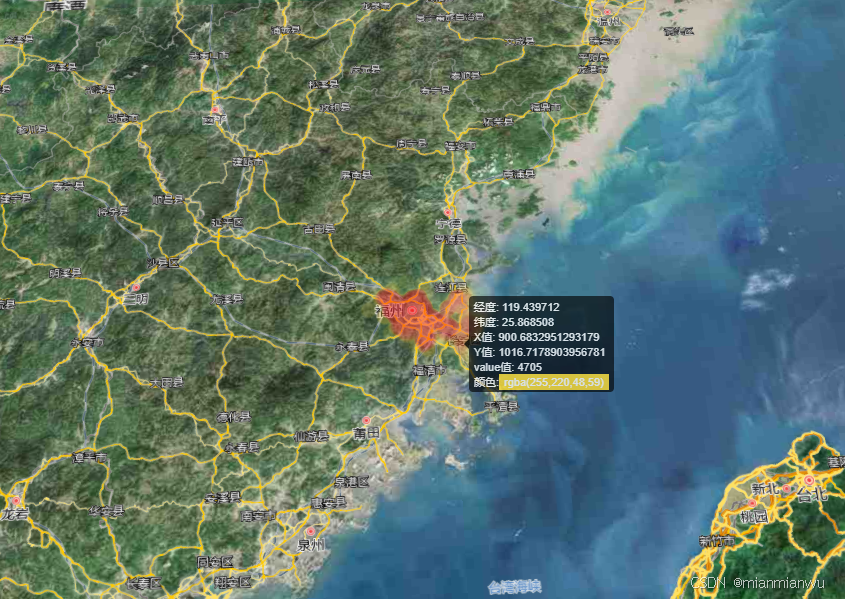
map.on(mars3d.EventType.mouseMove, (e) => {
const point = mars3d.LngLatPoint.fromCartesian(e.cartesian)
const data = heatLayer.getPointData(point)
if (!data.x) {
return
}
const inhtml = `
经度: ${point.lng} <br />
纬度: ${point.lat} <br />
X值: ${data.x} <br />
Y值: ${data.y} <br />
value值: ${data.value} <br />
颜色:<span style="background-color: ${data.color};padding:2px 5px;">${data.color}</span>
`
map.openSmallTooltip(e.windowPosition, inhtml)
})
}
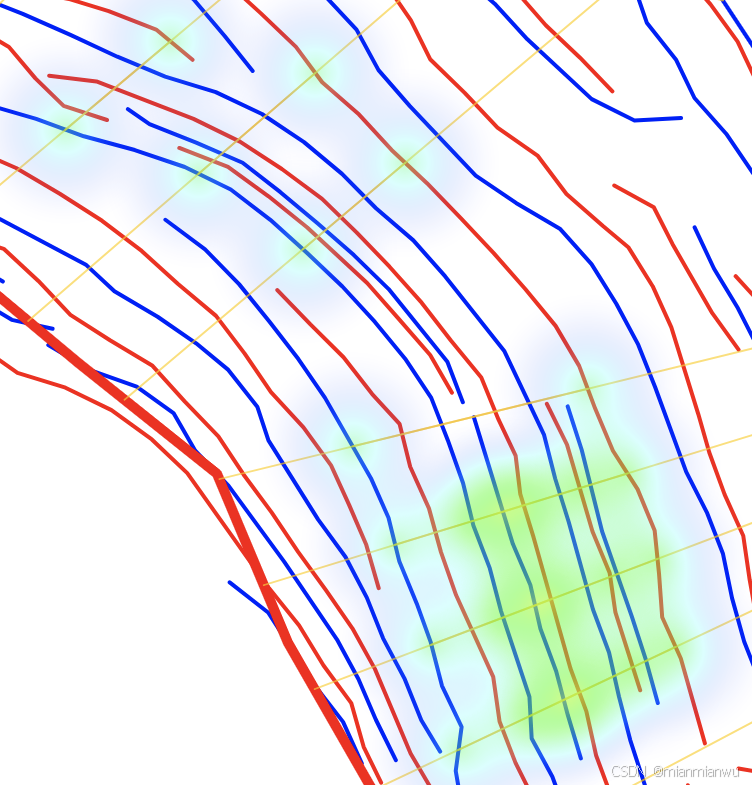
// 添加地形外裁剪
async function addTerrainClip() {
const geojson = await mars3d.Util.fetchJson({ url: "http://data.mars3d.cn/file/geojson/areas/350100.json" })
const arr = mars3d.Util.geoJsonToGraphics(geojson) // 解析geojson
const options = arr[0]
const terrainClip = new mars3d.thing.TerrainClip({
image: false,
splitNum: 10, // 井边界插值数
clipOutSide: true
})
map.addThing(terrainClip)
terrainClip.addArea(options.positions, { simplify: { tolerance: 0.004 } })
map.scene.globe.depthTestAgainstTerrain = false // 关闭深度
}相对路径:
src\example\layer-other\heatmap\heatLayer\map.js
下载示例;
git clone https://gitee.com/marsgis/mars3d-vue-example.git