概念
什么是Prometheus?
Prometheus受启发于Google的Brogmon监控系统(相似kubernetes是从Brog系统演变而来), 从2012年开始由google工程师Soundclouds使用Go语言开发的开源监控报警系统和时序列数据库(TSDB)。,并且与2015年早起对外发布早期版本。
2016年由Google发起Linux基金会旗下的原生云基金会(Cloud Native Computing Foundation), 将Prometheus纳入其下第二大开源项目。
Prometheus的特点
多维度数据模型。
灵活的查询语言PromQL。
不依赖分布式存储,单个服务器节点是自主的。
通过基于HTTP的pull方式采集时序数据。
可以通过中间网关进行时序列数据推送。
通过服务发现或者静态配置来发现目标服务对象。
支持多种多样的图表和界面展示,比如Grafana等。
Prometheus组件
Prometheus Server 根据配置完成数据采集, 服务发现以及数据存储,提供PromQL查询语言的支持。
Alertmanager 警告管理器,用来进行报警。
Exporters(探针): 是Prometheus的一类数据采集组件的总称。它负责从目标处搜集数据,并将其转化为Prometheus支持的格式。与传统的数据采集组件不同的是,它并不向中央服务器发送数据,而是等待中央服务器主动前来抓取。
Push Gateway 支持临时性Job主动推送指标的中间网关。
Prometheus原理
Prometheus的基本原理是通过HTTP协议周期性抓取被监控组件的状态,任意组件只要提供对应的HTTP接口就可以接入监控。不需要任何SDK或者其他的集成过程。这样做非常适合做虚拟化环境监控系统,比如VM、Docker、Kubernetes等。输出被监控组件信息的HTTP接口被叫做exporter 。目前互联网公司常用的组件大部分都有exporter可以直接使用,比如Varnish、Haproxy、Nginx、MySQL、Linux系统信息(包括磁盘、内存、CPU、网络等等)。
系统说明
三台centos7虚拟机
[root@node1 ~]# cat /etc/redhat-release CentOS Linux release 7.9.2009 (Core)
| 角色 | 主机名 | ip |
|---|---|---|
| Prometheus服务器 | server | 192.168.50.162 |
| grafana服务器 | grafana | 192.168.50.163 |
| 被监控的linux主机 | agent | 192.168.50.164 |
环境准备
1.各自配置好主机名
hostnamectl set-hostname xxx2.三台都互相绑定IP与主机名
192.168.50.162 server
192.168.50.163 agent
192.168.50.164 grafana
3.配置时间同步
yum install -y chronyd
vim /etc/chronyd.conf
#添加一下内容
server ntp1.aliyun.com iburst
重启服务
···
systemctl restart chronyd
root@master prometheus# chronyc sources
^* 120.25.115.20 2 7 40 879 -33us -261us +/- 19ms
···
4.关闭防火墙和selinux
systemctl stop firewalld
systemctl disable firewalld
sed -i '/^SELINUX=/ cSELINUX=disabled' /etc/selinux/config
setenforce 0
Prometheus安装与使用
安装
下载软件
1.前往官网https://prometheus.io/download/,找到对应版本
wget -c https://github.com/prometheus/prometheus/releases/download/v2.53.2/prometheus-2.53.2.linux-amd64.tar.gz2.解压软件
tar -xf prometheus-2.53.2.linux-amd64.tar.gz
#创建软连接
cd /usr/local
ln -sv prometheus-2.53.2.linux-amd64/ prometheus
3.创建数据目录
mkdir /usr/local/prometheus/data4.创建服务运行用户
useradd prometheus -M -s /sbin/nologin
修改权限
chown -R prometheus.prometheus /usr/local/prometheus/*
5.创建服务运行脚本
vim /usr/lib/systemd/system/prometheus.service
[Unit]
cription=prometheus
After=network.target
[Service]
Type=simple
User=prometheus
ExecStart=/usr/local/prometheus-2.53.2.linux-amd64/prometheus --config.file=/usr/local/prometheus-2.53.2.linux-amd64/prometheus.yml --storage.tsdb.path=/usr/local/prometheus-2.53.2.linux-amd64/prometheus-2.53.2.linux-amd64/data
Restart=on-failure
ExecReload=/bin/kill -HUP $MAINPID
[Install]
WantedBy=multi-user.target
6.启动服务
systemctl daemon-reload
systemctl enable --now prometheus.service
检查服务
systemctl is-active prometheus.service
active
systemctl is-enabled prometheus.service
enabled
检查端口
[root@master prometheus]# netstat -lnupt | grep 9090
tcp6       0      0 :::9090                 :::*                    LISTEN      77034/prometheus
3.web界面
访问ip:9090即可进入web页面
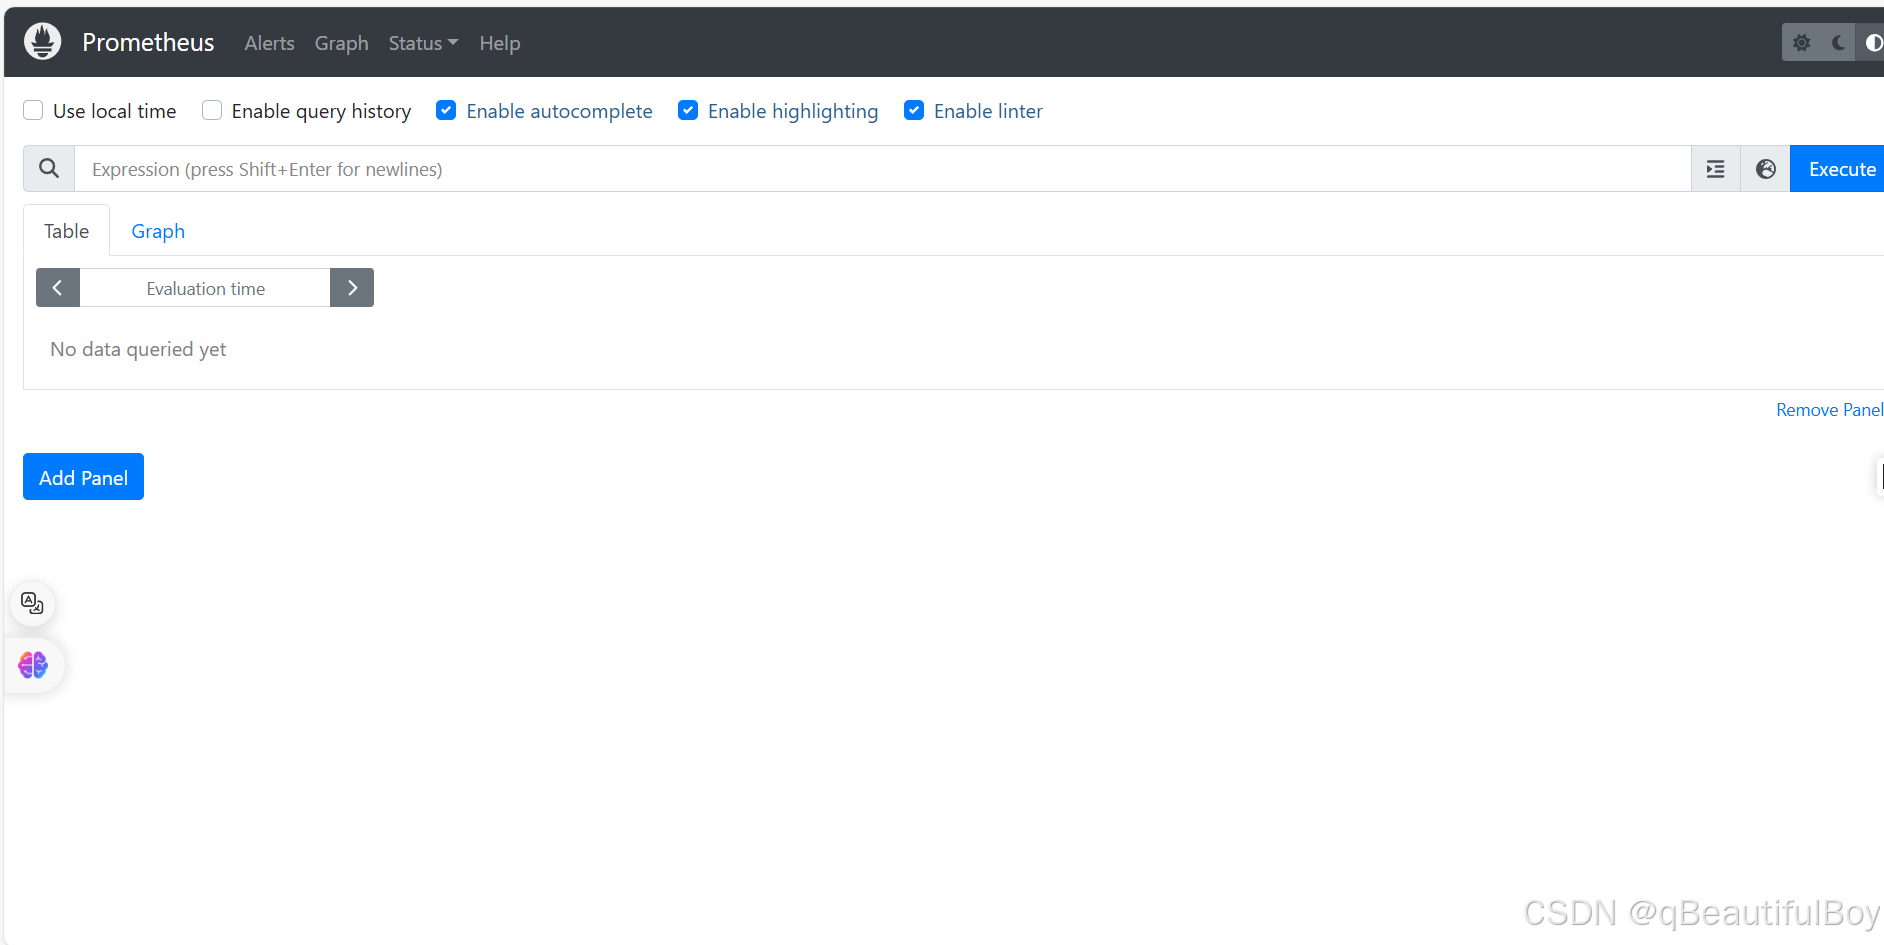
默认只监视当前一台主机
此时点击http://master:9090/metrics会显示无法访问

将master改为主机ip即可
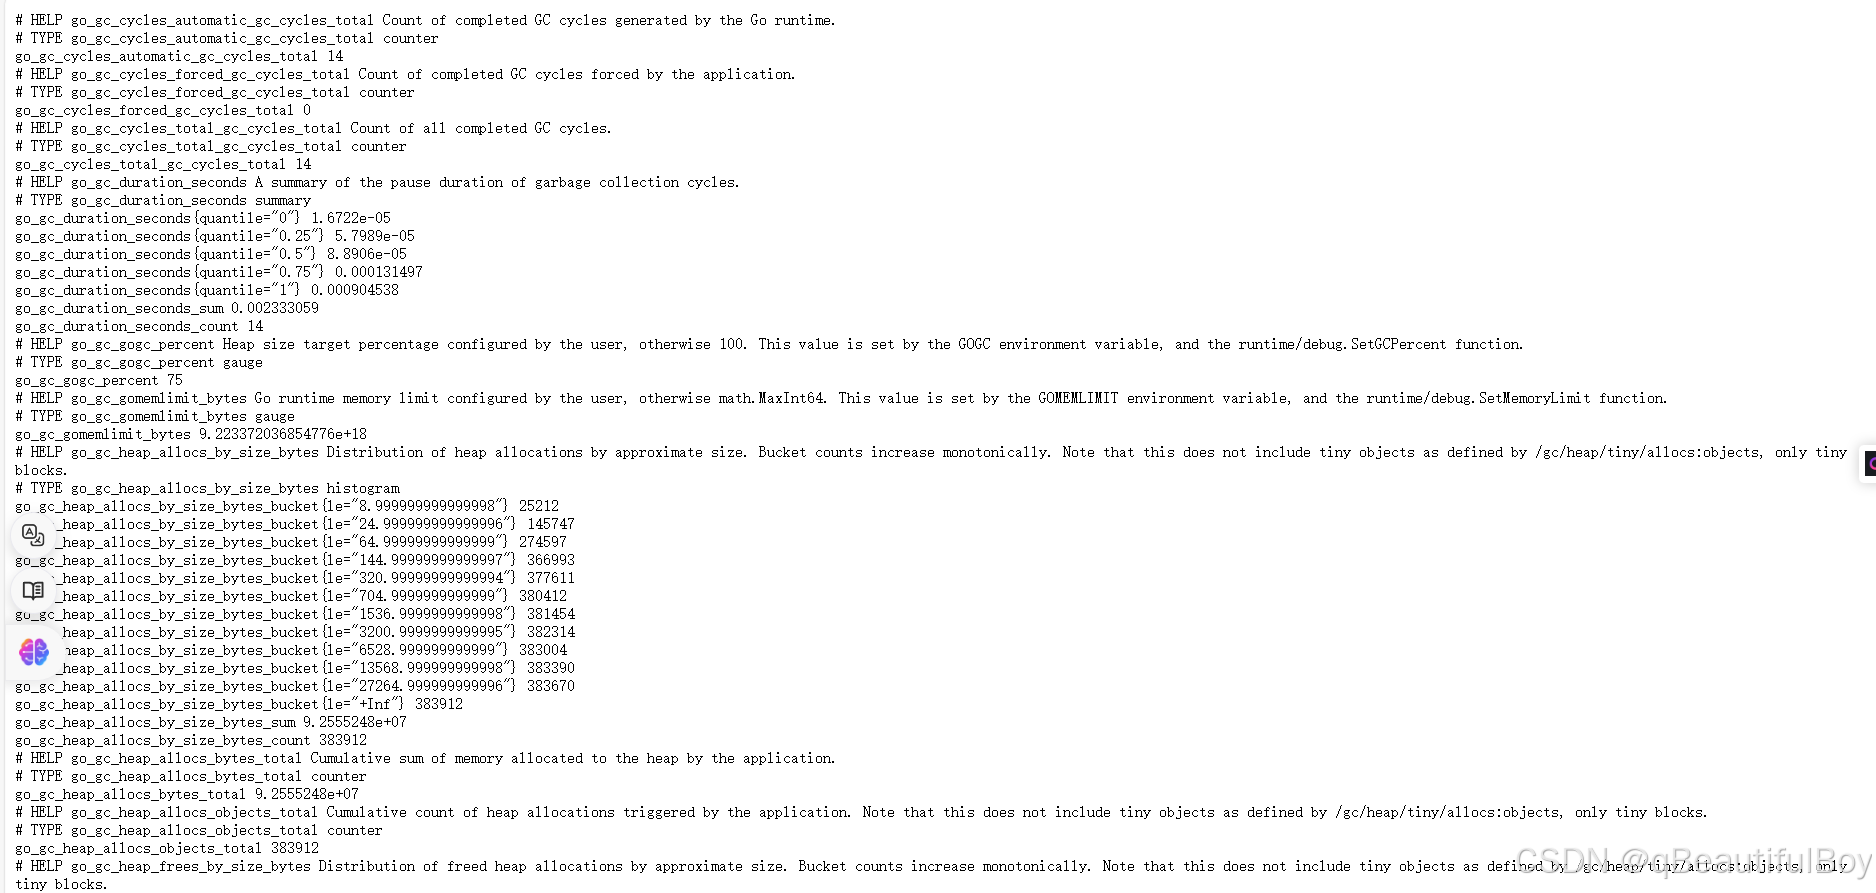
通过http://服务器IP:9090/metrics可以查看到监控的数据
[root@master prometheus]# curl http://192.168.50.162:9090/metrics
# HELP go_gc_cycles_automatic_gc_cycles_total Count of completed GC cycles generated by the Go runtime.
# TYPE go_gc_cycles_automatic_gc_cycles_total counter
go_gc_cycles_automatic_gc_cycles_total 11
# HELP go_gc_cycles_forced_gc_cycles_total Count of completed GC cycles forced by the application.
# TYPE go_gc_cycles_forced_gc_cycles_total counter
go_gc_cycles_forced_gc_cycles_total 0
# HELP go_gc_cycles_total_gc_cycles_total Count of all completed GC cycles.
# TYPE go_gc_cycles_total_gc_cycles_total counter
go_gc_cycles_total_gc_cycles_total 11
# HELP go_gc_duration_seconds A summary of the pause duration of garbage collection cycles.
# TYPE go_gc_duration_seconds summary
go_gc_duration_seconds{quantile="0"} 1.6722e-05
go_gc_duration_seconds{quantile="0.25"} 5.7989e-05
go_gc_duration_seconds{quantile="0.5"} 8.8906e-05
go_gc_duration_seconds{quantile="0.75"} 0.000240731
go_gc_duration_seconds{quantile="1"} 0.000904538
go_gc_duration_seconds_sum 0.002091826
go_gc_duration_seconds_count 11
# HELP go_gc_gogc_percent Heap size target percentage configured by the user, otherwise 100. This value is set by the GOGC environment variable, and the runtime/debug.SetGCPercent function.
# TYPE go_gc_gogc_percent gauge
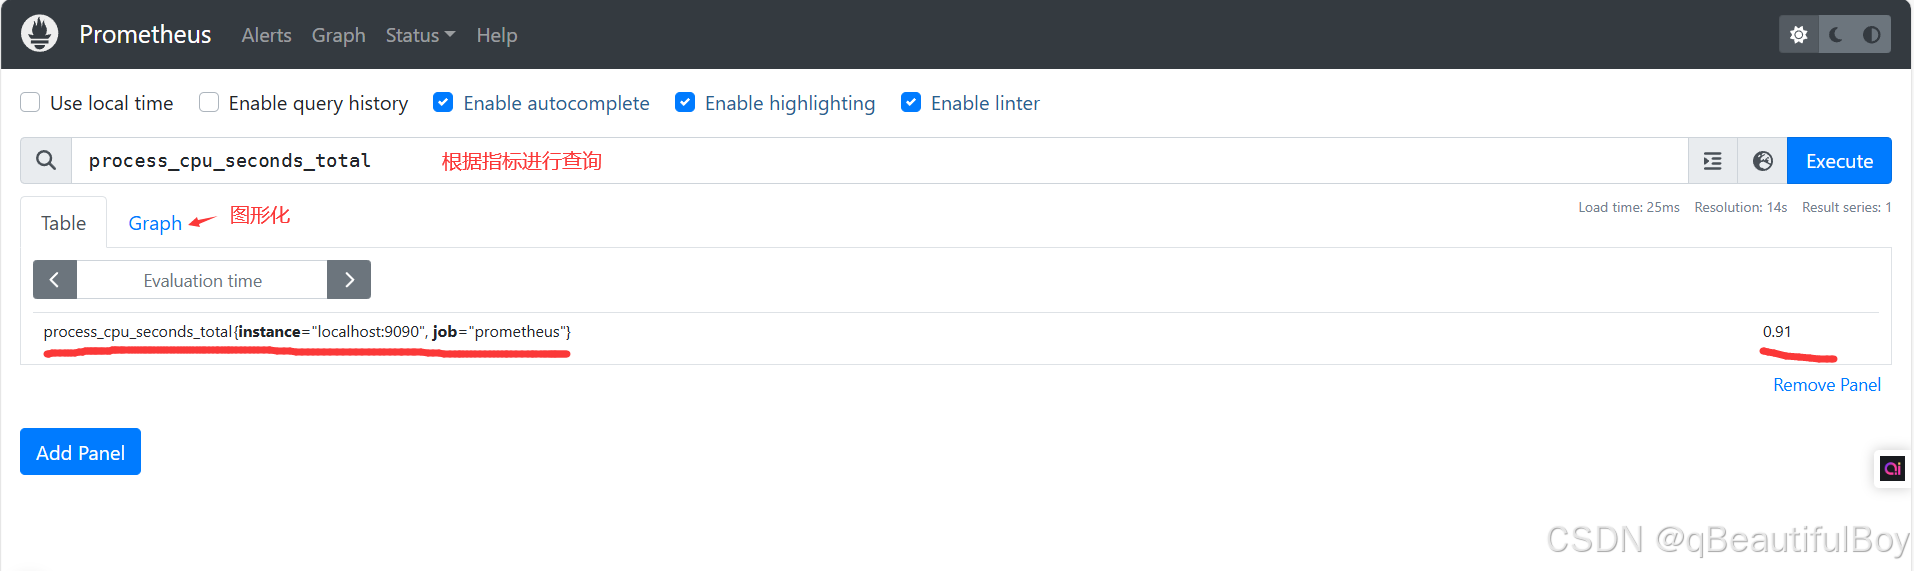
go_gc_gogc_percent 75查询数据
监控案例练习
1.监控linux主机
使用Node Exporter采集主机运行数据
在Prometheus的架构设计中, Prometheus Server并不直接服务监控特定的目标, 其主要任务负责数据的收集,存储并且对外提供数据查询支持。 因此为了能够能够监控到某些东西, 如主机的CPU使用率, 我们需要使用到Exporter。 Prometheus周期性的从Exporter暴露的HTTP服务地址( 通常是/metrics) 拉取监控样本数据。
为了能够采集到主机的运行指标如CPU, 内存, 磁盘等信息。 可以使用Node Exporter。
Node Exporter同样采用Golang编写, 并且不存在任何的第三方依赖, 只需要下载, 解压即可运行。
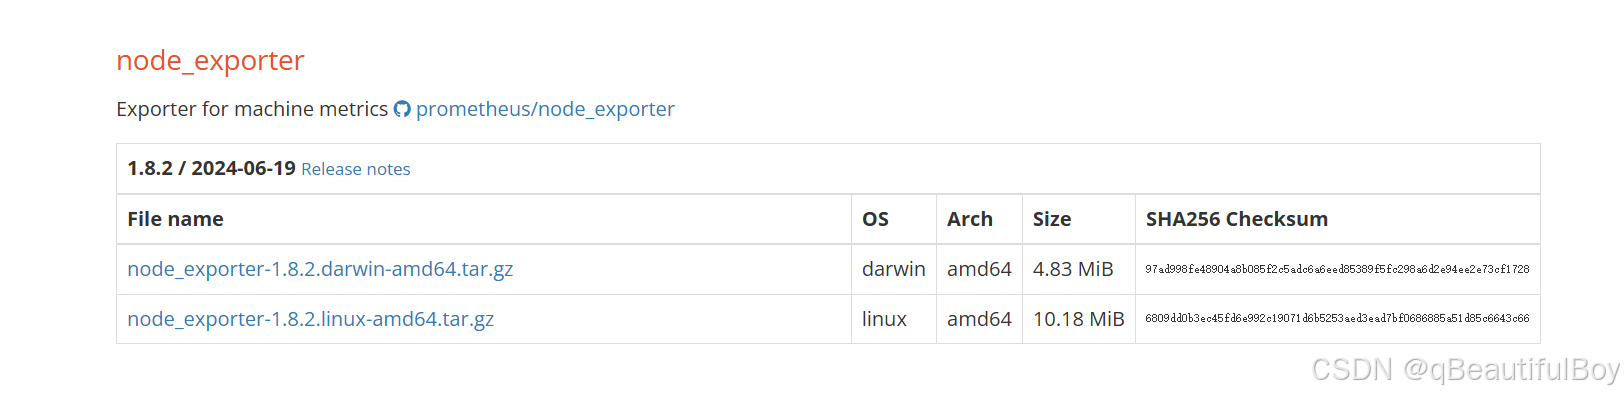
在官网中找到,复制下载链接,在被监控的linux主机上下载Node Exporter
[root@node2 local]# wget -c https://github.com/prometheus/node_exporter/releases/download/v1.8.2/node_exporter-1.8.2.linux-amd64.tar.gz解压:
[root@node2 local]# tar -xf node_exporter-1.8.2.linux-amd64.tar.gz
[root@node2 local]# ll
total 10428
drwxr-xr-x. 2 root root        6 Apr 10  2018 bin
drwxr-xr-x. 2 root root        6 Apr 10  2018 etc
drwxr-xr-x. 2 root root        6 Apr 10  2018 games
drwxr-xr-x. 2 root root        6 Apr 10  2018 include
drwxr-xr-x. 2 root root        6 Apr 10  2018 lib
drwxr-xr-x. 2 root root        6 Apr 10  2018 lib64
drwxr-xr-x. 2 root root        6 Apr 10  2018 libexec
drwxr-xr-x. 2 1001 1002       56 Jul 14 04:58 node_exporter-1.8.2.linux-amd64
-rw-r--r--. 1 root root 10676343 Jul 14 04:58 node_exporter-1.8.2.linux-amd64.tar.gz
drwxr-xr-x. 2 root root        6 Apr 10  2018 sbin
drwxr-xr-x. 5 root root       49 Aug 10 04:08 share
drwxr-xr-x. 2 root root        6 Apr 10  2018 src
创建服务运行用户
useradd prometheus -M -s /sbin/nologin修改权限
chown -R prometheus.prometheus /usr/local/node_exporter-1.8.2.linux-amd64/*添加系统服务
vim /usr/lib/systemd/system/node_exporter.service
[Unit]
Description=node_exporter
After=network.target
[Service]
Type=simple
User=prometheus
ExecStart=/usr/local/node_exporter-1.8.2.linux-amd64/node_exporter
Restart=on-failure
[Install]
WantedBy=multi-user.target
启动服务:
systemctl daemon-reload
systemctl start node_exporter.service
[root@node2 local]# systemctl is-active node_exporter.service
active
[root@node2 local]# netstat -lnupt | grep 9100
tcp6       0      0 :::9100                 :::*                    LISTEN      85999/node_exporter
验证:
此时浏览器访问 http://被监控端IP:9100/metrics 就可以查看到node_exporter在被监控端收集的监控信息

要想在prumetheus server端的web界面中看到被监控端linux主机的数据,还要在Prometheus主配置文件中加入一下配置
[root@master prometheus]# vim /usr/local/prometheus/prometheus.yml
  - job_name: 'agent1'
    static_configs:
      - targets: ['192.168.50.164:9100']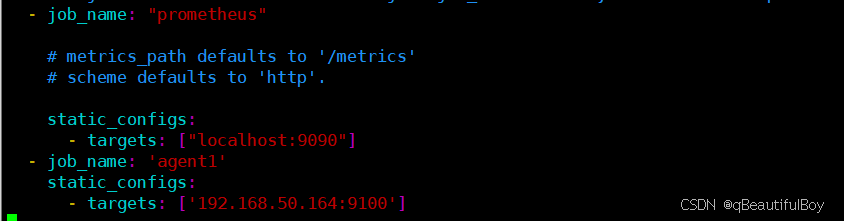
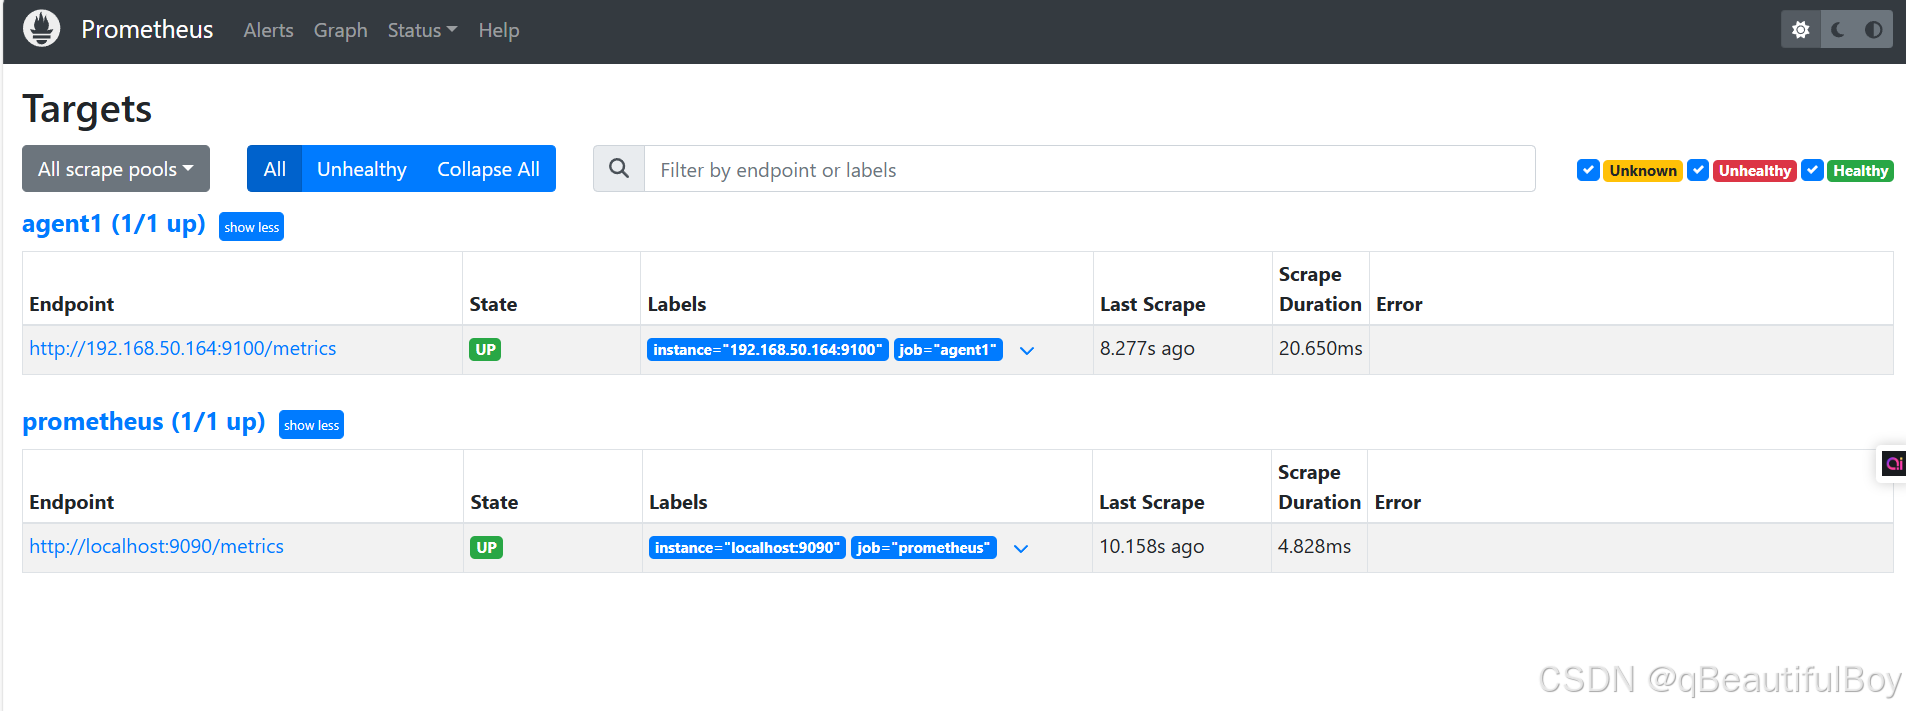
重启服务
[root@master prometheus]# systemctl daemon-reload
[root@master prometheus]#  systemctl restart prometheus.service
在访问web页面即可看到被监控端主机
2.监控远程Mysql
依旧是去官网下载mysql_exporter组件
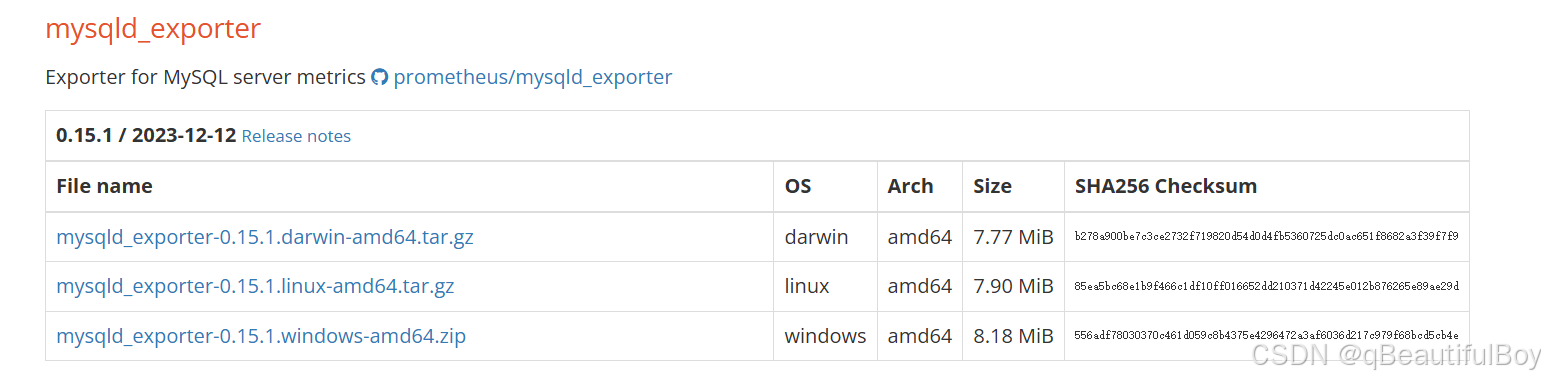
下载组件:
wget -c https://github.com/prometheus/mysqld_exporter/releases/download/v0.15.1/mysqld_exporter-0.15.1.linux-amd64.tar.gz解压组件:
tar -xf mysqld_exporter-0.15.1.linux-amd64安装mariadb数据库,授权账户
yum install -y mariadb-server
systemctl enable --now mariadb

mysql -e "grant select,replication client,process ON *.* to 'mysql_monitor'@'localhost' identified by '123'"
注意:授权ip为localhost,因为不是prometheus服务器来直接找mariadb获取数据,而是prometheus服务器找mysql_exporter,mysql_exporter再找mariadb。所以这个localhost是指的mysql_exporter的IP
创建一个mariadb配置文件,写上连接的用户名与密码(和上面的授权的用户名和密码要对应)
vim /usr/local/mysqld_exporter/.my.cnf

[client]
user=mysql_monitor
password=123
添加系统服务
vim /usr/lib/systemd/system/mysql_exporter.service

[Unit]
Description=mysqld_exporter
After=network.target
[Service]
Type=simple
User=prometheus
ExecStart=/usr/local/mysqld_exporter-0.15.1.linux-amd64/mysqld_exporter --config.my-cnf=/usr/local/mysqld_exporter-0.15.1.linux-amd64/.my.cnf
Restart=on-failure
[Install]
WantedBy=multi-user.target
启动服务
[root@node2 local]# chown -R prometheus.prometheus /usr/local/mysqld_exporter/*
[root@node2 local]# systemctl daemon-reload
[root@node2 local]# systemctl start mysql_exporter.service
[root@node2 local]# netstat -lnupt | grep 9104
tcp6 0 0 :::9104 :::* LISTEN
验证:
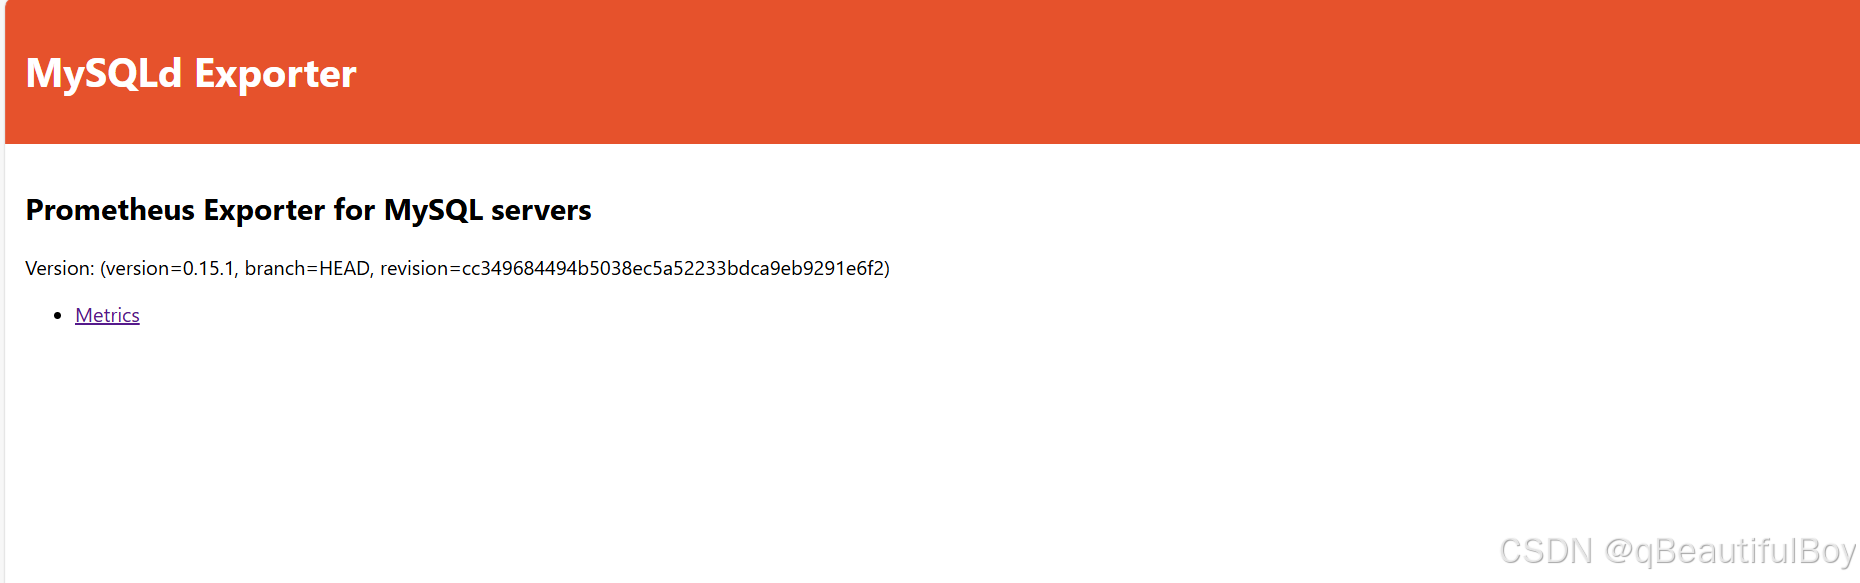
通过浏览器访问http://被监控端IP:9104/metrics就可以查看到mysql_exporter在被监控端收集的监控信息 配置文件中可更改端口
修改Prometheus配置:
添加如下配置:
[root@master prometheus]# vim /usr/local/prometheus/prometheus.yml
- job_name: 'agent1_mariadb'
static_configs:
- targets: ['192.168.50.164:9104']
重启prometheus
[root@master prometheus]# systemctl restart prometheus.service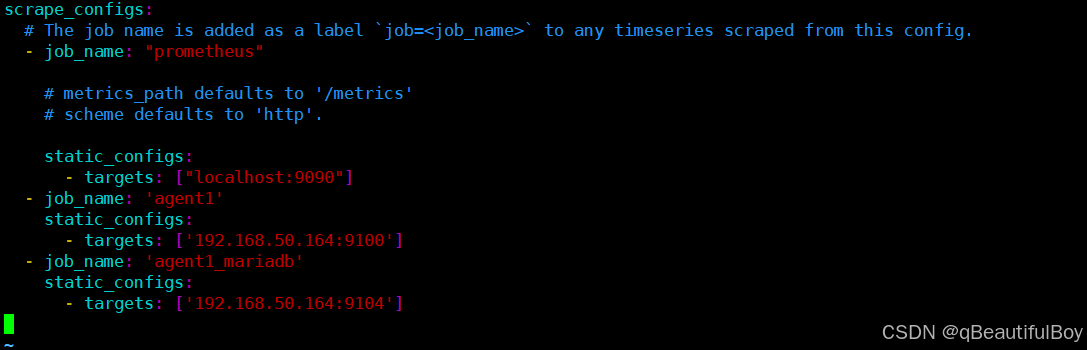
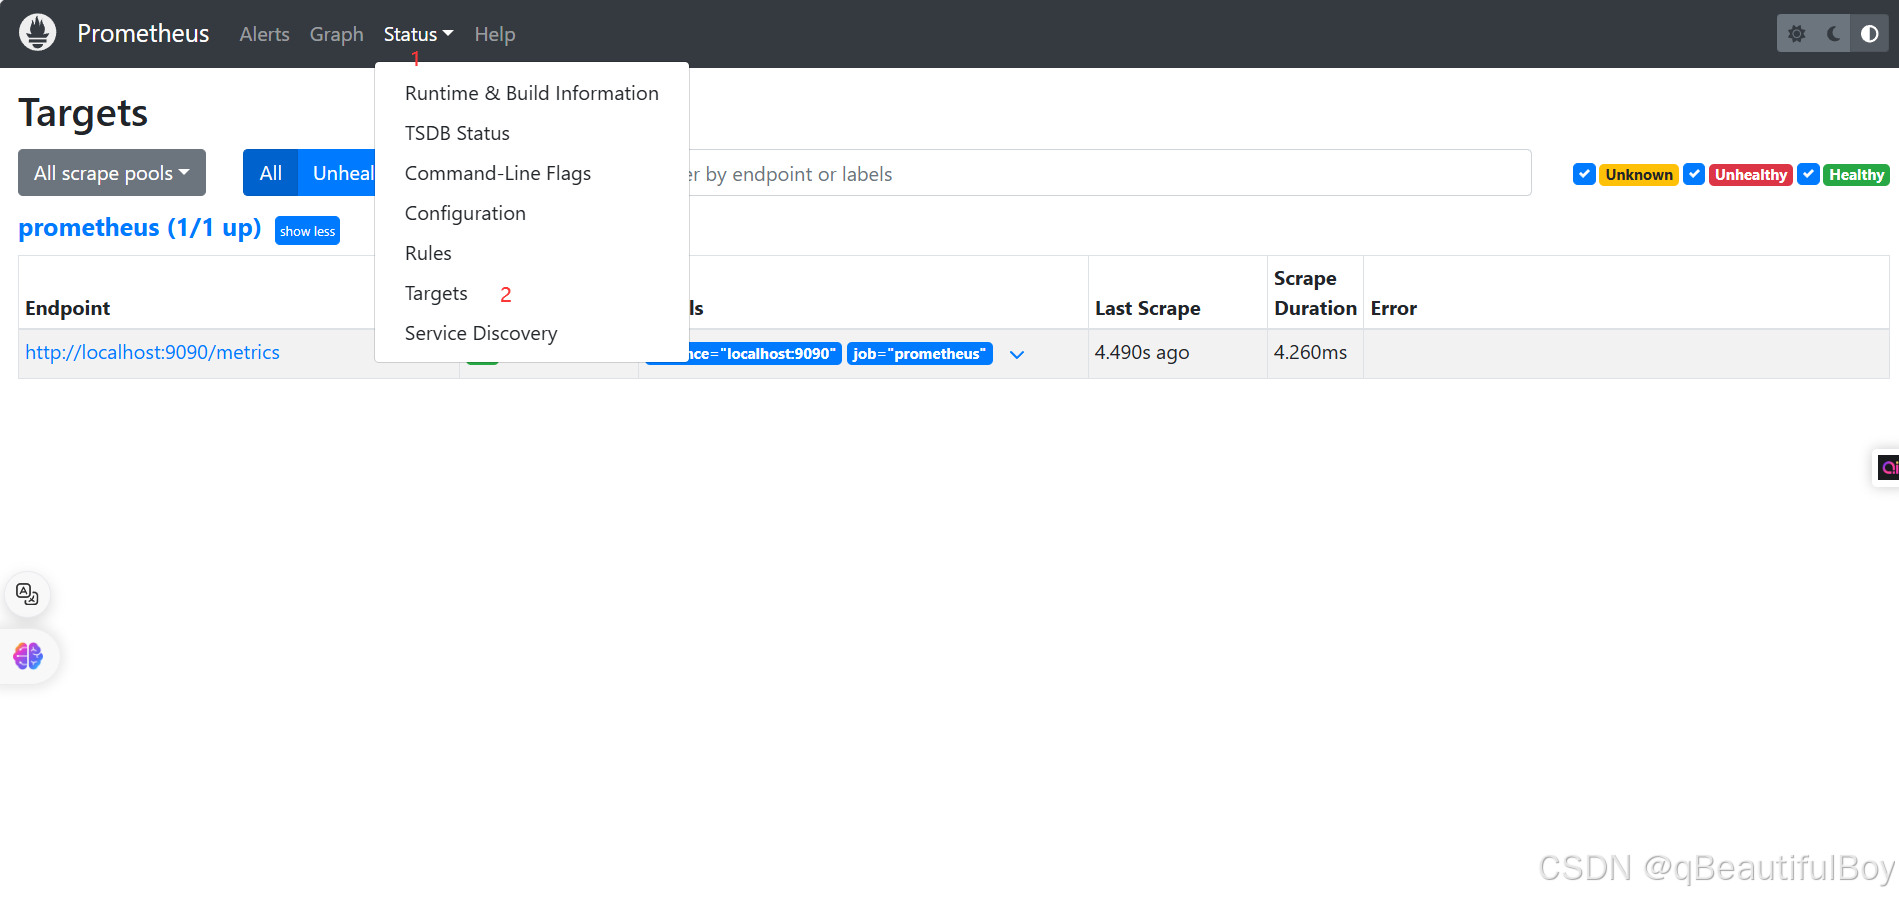
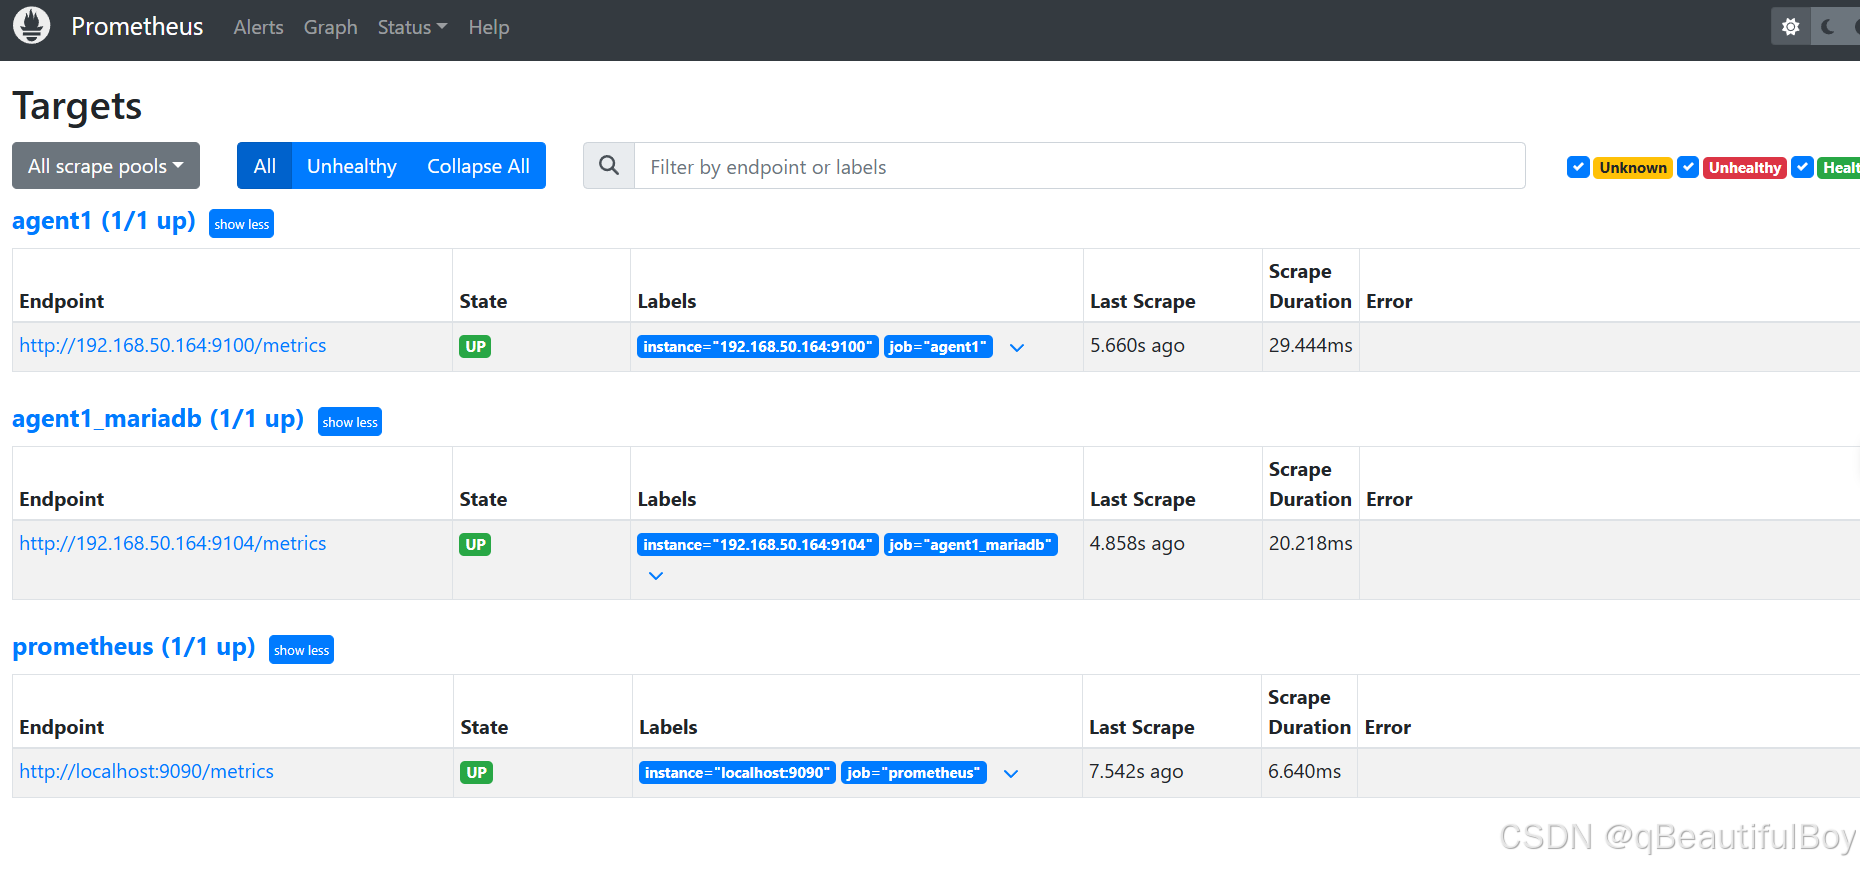
Prometheus web管理界面查看:
Grafana安装与使用
Grafana是一个跨平台的开源的度量分析和可视化工具,可以通过将采集的数据查询然后可视化的展示,并及时通知。它主要有以下六大特点:
1、展示方式:快速灵活的客户端图表,面板插件有许多不同方式的可视化指标和日志,官方库中具有丰富的仪表盘插件,比如热图、折线图、图表等多种展示方式;
2、数据源:Graphite,InfluxDB,OpenTSDB,Prometheus,Elasticsearch,CloudWatch和KairosDB等;
3、通知提醒:以可视方式定义最重要指标的警报规则,Grafana将不断计算并发送通知,在数据达到阈值时通过Slack,PagerDuty等获得通知;
4、混合展示:在同一图表中混合使用不同的数据源,可以基于每个查询指定数据源,甚至自定义数据源;
5、注释:使用来自不同数据源的丰富事件注释图表,将鼠标悬停在事件上会显示完整的事件元数据和标记;
6、过滤器:Ad-hoc过滤器允许动态创建新的键/值过滤器,这些过滤器会自动应用于使用该数据源的所有查询。
安装
在grafana主机下载软件包
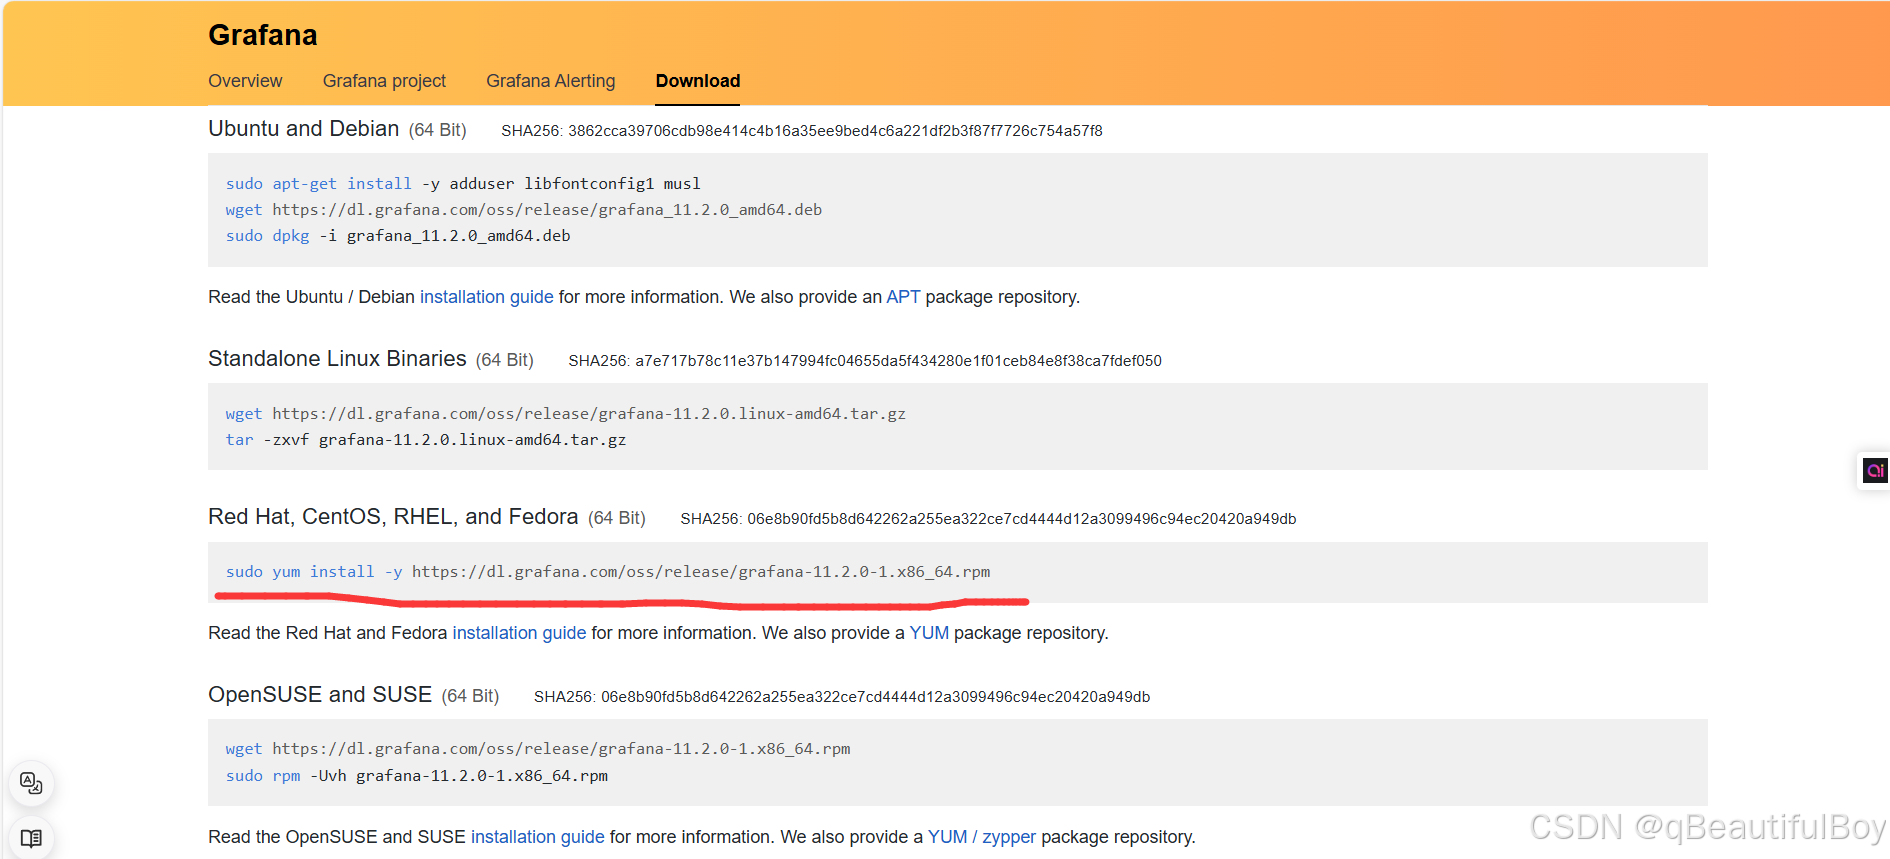
yum install -y https://dl.grafana.com/oss/release/grafana-11.2.0-1.x86_64.rpm由于下载速度过慢,因此去阿里镜像仓库下载
增加repo源:
sudo vim /etc/yum.repos.d/grafana.repo
[grafana]
name=grafana
baseurl=https://mirrors.aliyun.com/grafana/yum/rpm
repo_gpgcheck=0
enabled=1
gpgcheck=0


##再执行
sudo yum makecache
sudo yum install grafana
如果再不行,就直接:
yum install -y https://mirrors.aliyun.com/grafana/yum/rpm/Packages/grafana-10.0.11-1.x86_64.rpm启动服务:
[root@node1 local]# systemctl enable --now grafana-server
Created symlink from /etc/systemd/system/multi-user.target.wants/grafana-server.service to /usr/lib/systemd/system/grafana-server.service.
[root@node1 local]# netstat -lnupt | grep 3000
tcp6       0      0 :::3000                 :::*                    LISTEN      17688/grafana
使用grafana-cli 安装插件
# grafana-cli plugins list-remote 列出所有可用的插件
# grafana-cli plugins install grafana-worldmap-panel 安装世界地图插件
# grafana-cli plugins install grafana-clock-panel 安装时间插件
# grafana-cli plugins install grafana-piechart-panel 安装圆饼插件
# grafana-cli plugins ls 列出已经安装的插件
安装完毕需要重启服务
# systemctl restart grafana-server
·
使用Grafana连接Prometheus
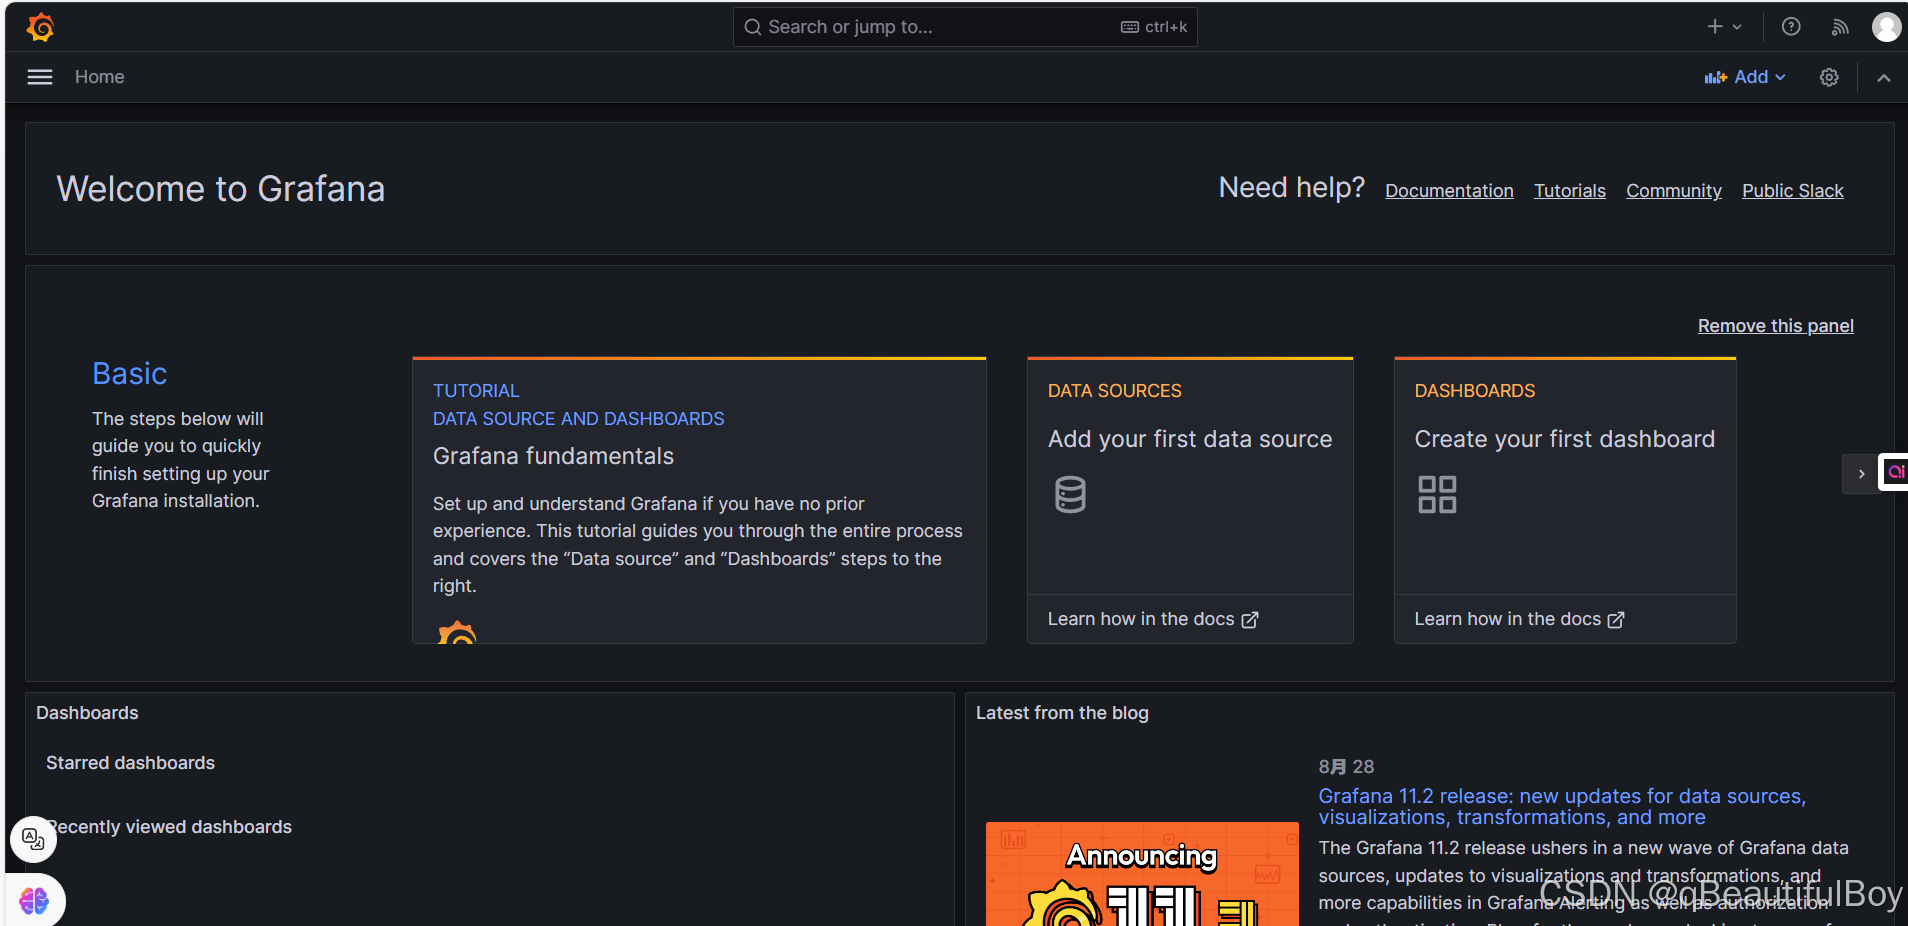
1.登录web界面
通过浏览器访问 http:// grafana服务器IP:3000就到了登录界面,使用默认的admin用户,admin密码就可以登陆了 192.168.50.163:3000
第一次需要修改admin密码 改为好记的密码:123456
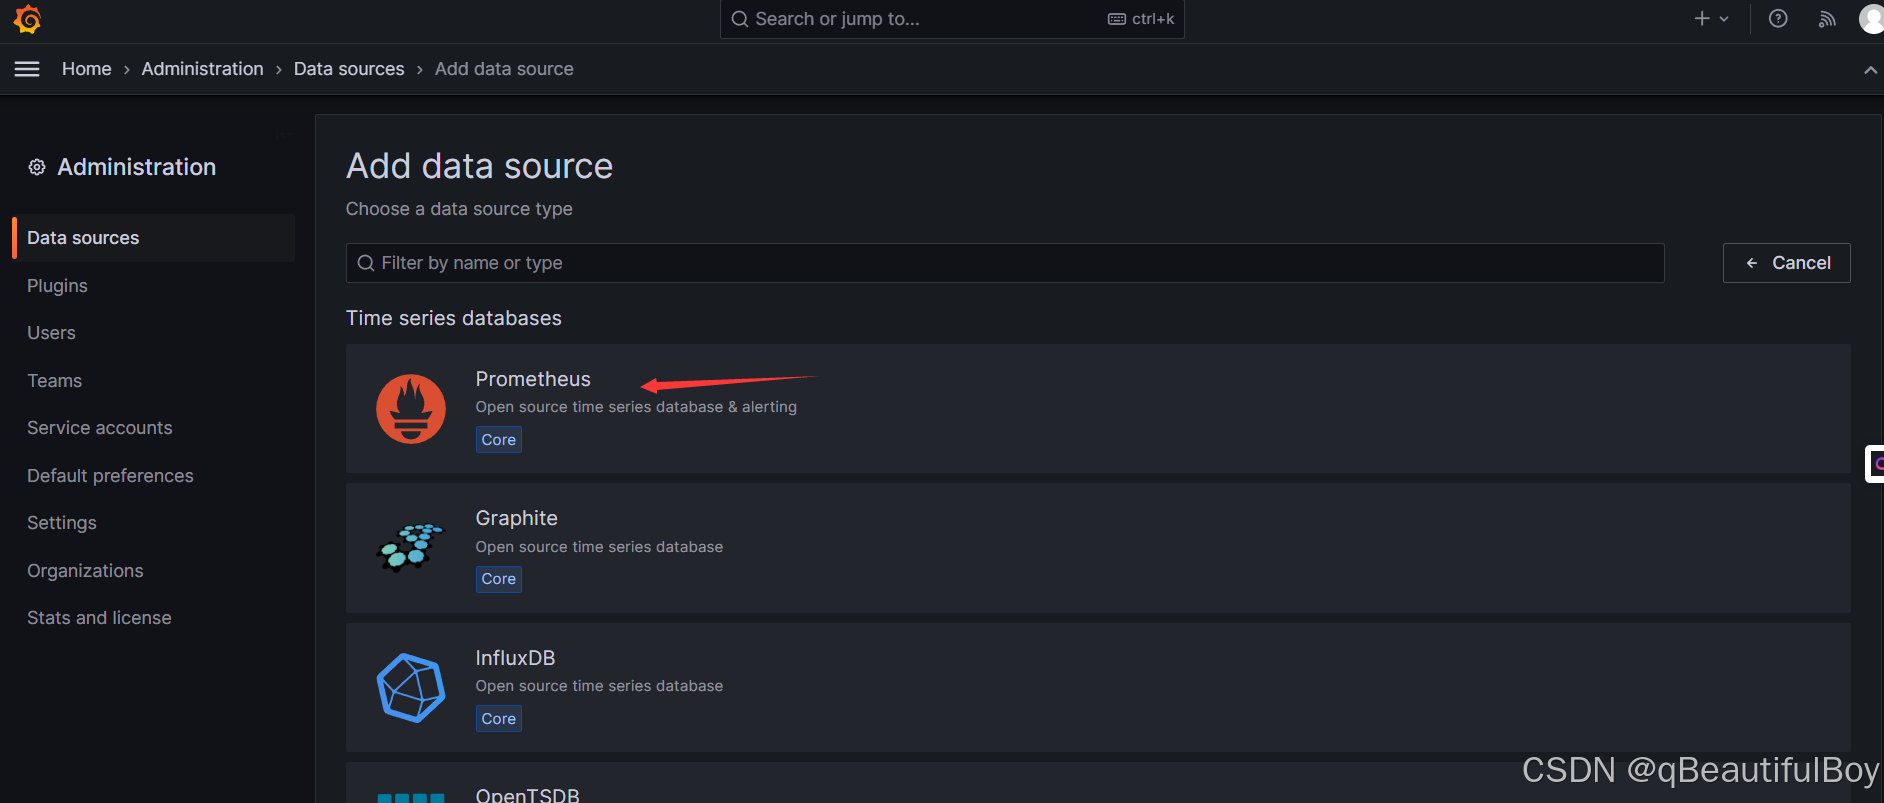
2.添加数据源
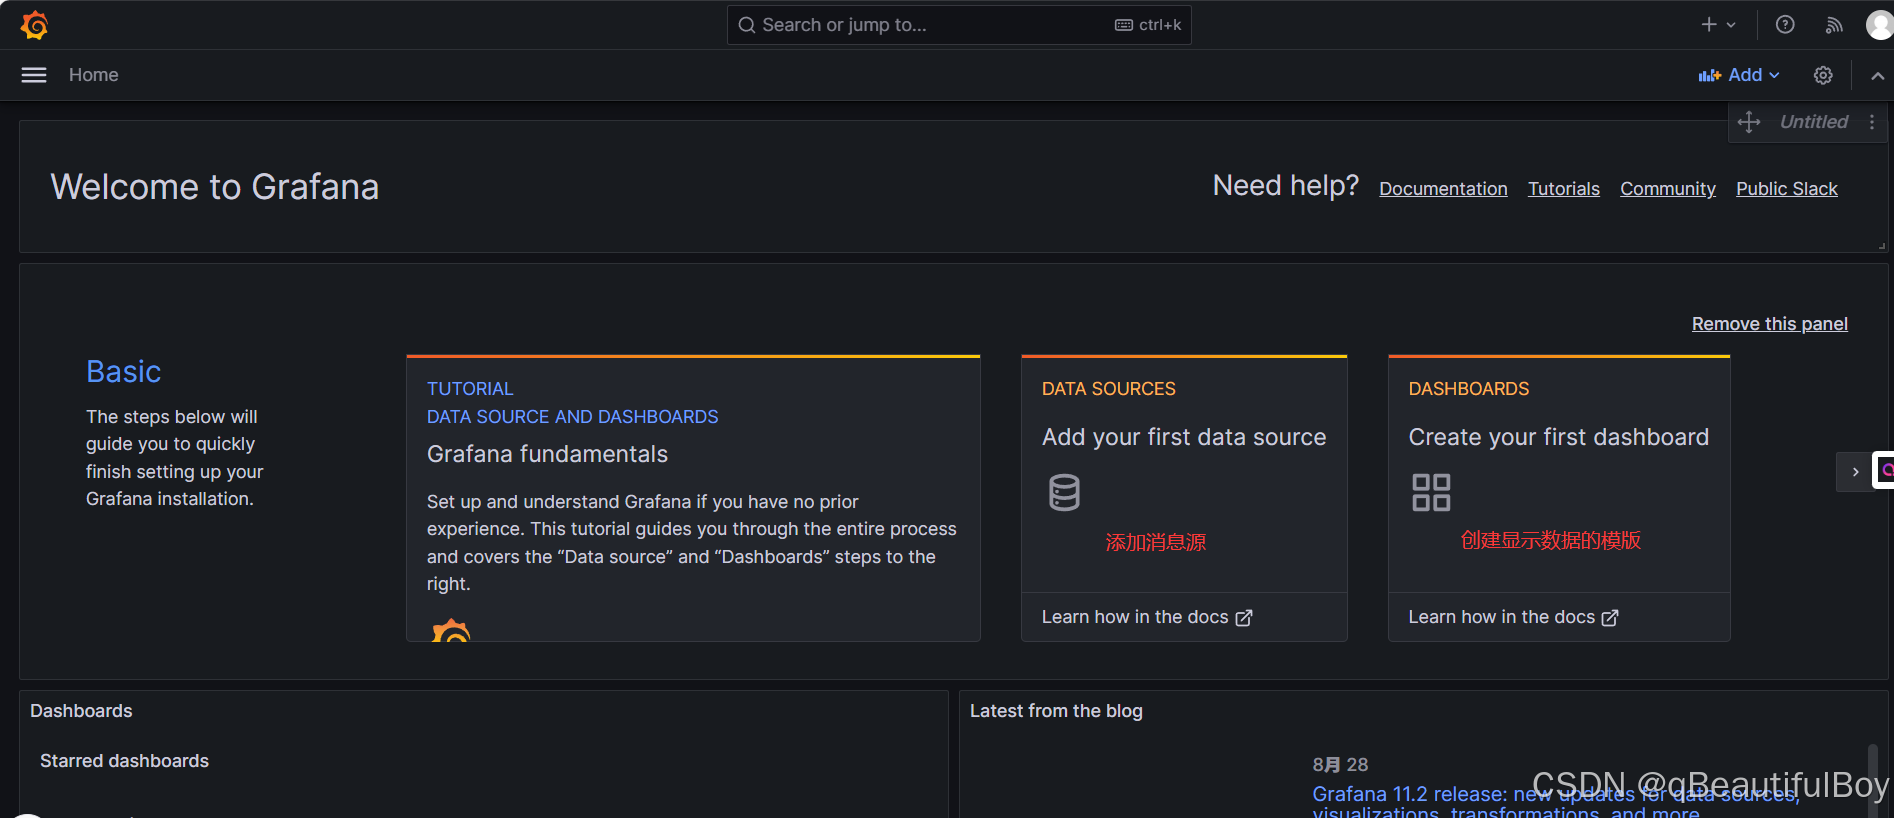
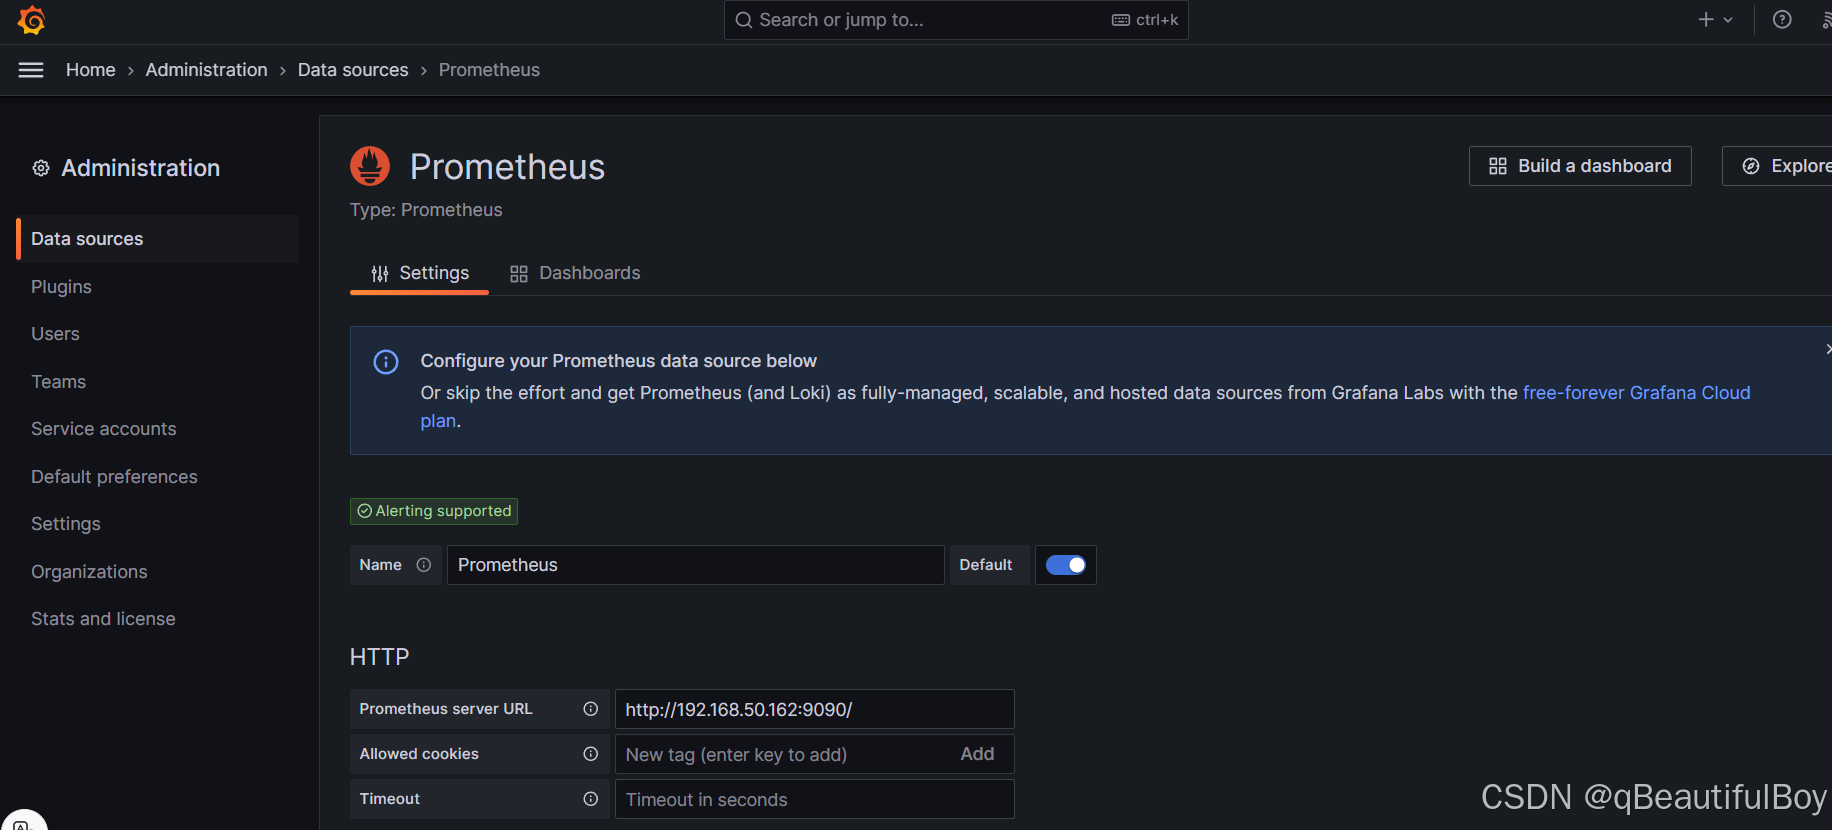
点击Prometheus
填入Prometheus端的主机ip:9090 192.168.50.162:9090
为数据源挑选展示的模版

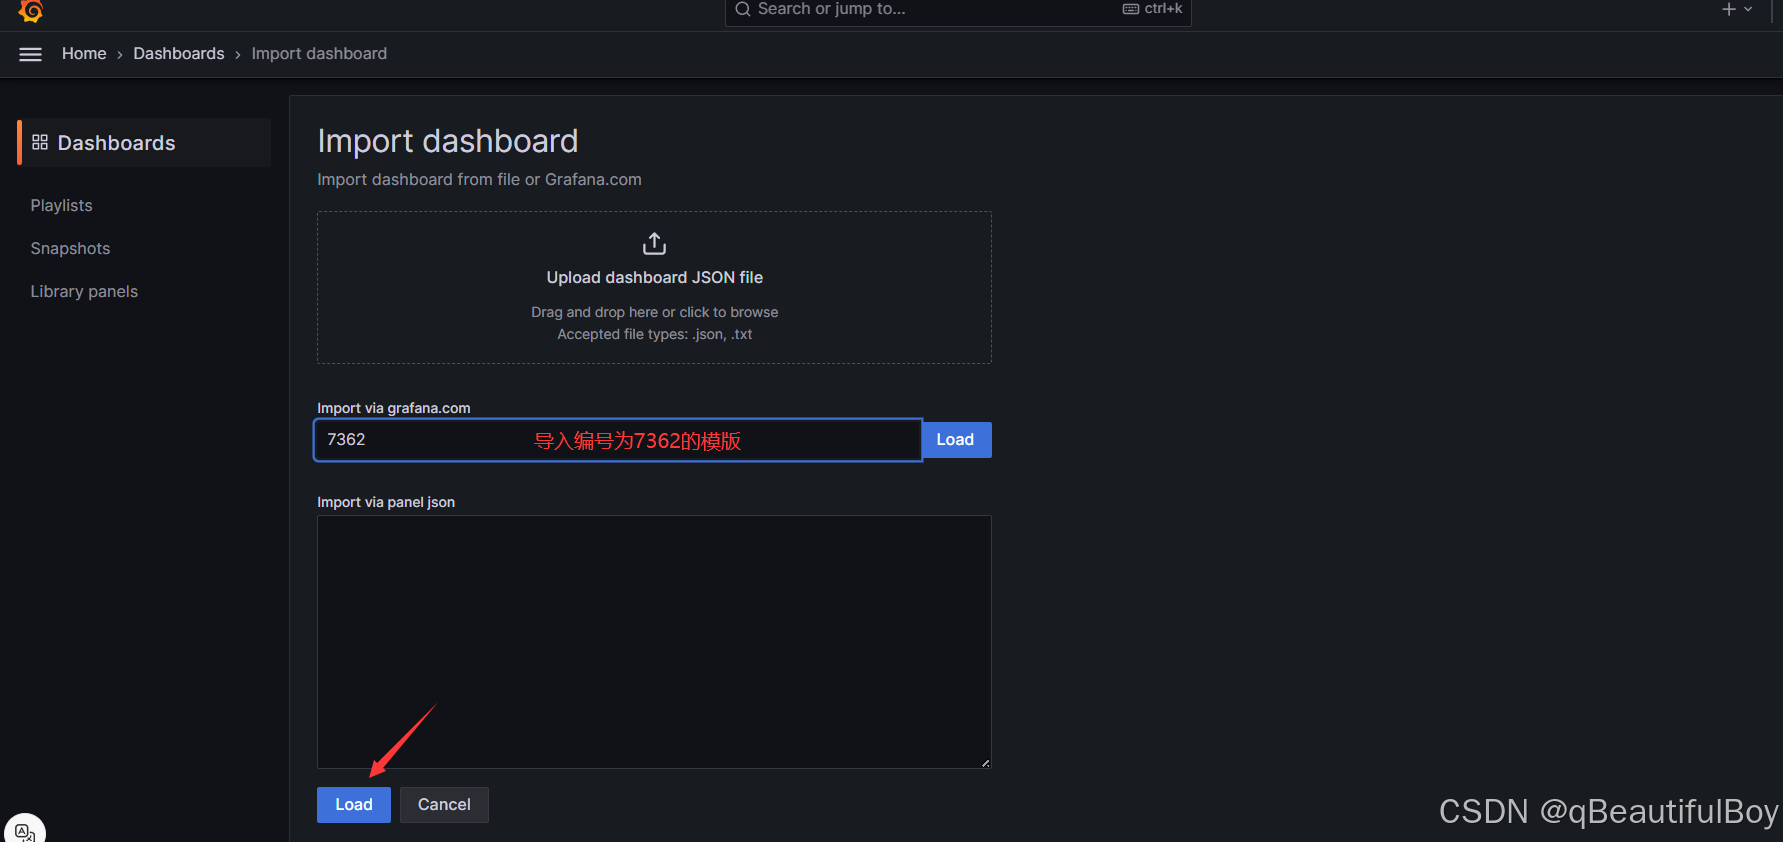 点击中间那个load,标错了
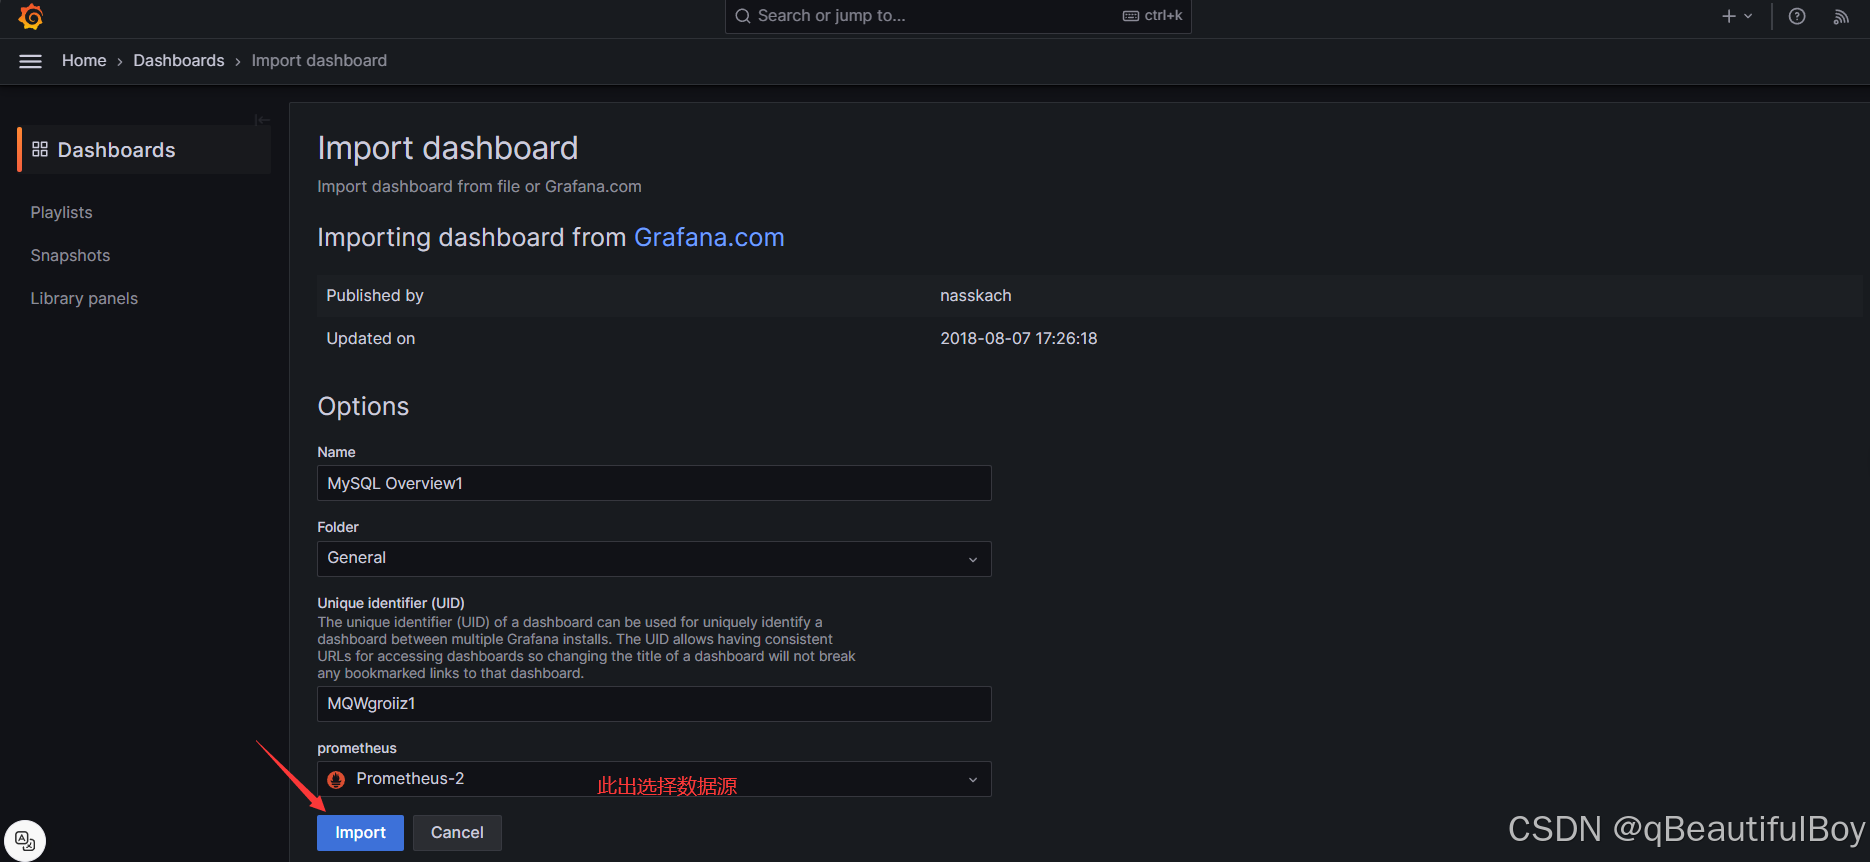
选择数据源之后,点击import
效果展示:

Prometheus告警处理
Prometheus告警简介
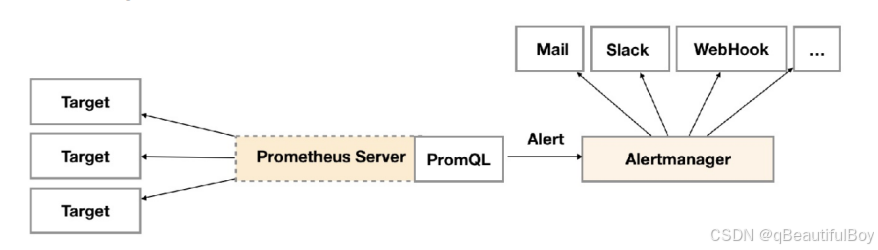
告警能力在Prometheus的架构中被划分成两个独立的部分。 如下所示, 通过在Prometheus中定义AlertRule( 告警规则) ,Prometheus会周期性的对告警规则进行计算, 如果满足告警触发条件就会向Alertmanager发送告警信息。
在Prometheus中一条告警规则主要由以下几部分组成:
告警名称: 用户需要为告警规则命名, 当然对于命名而言, 需要能够直接表达出该告警的主要内容
告警规则: 告警规则实际上主要由PromQL进行定义, 其实际意义是当表达式( PromQL) 查询结果持续多长时间( During) 后出发告警
在Prometheus中, 还可以通过Group( 告警组) 对一组相关的告警进行统一定义。 当然这些定义都是通过YAML文件来统一管理的。Alertmanager作为一个独立的组件, 负责接收并处理来自Prometheus Server(也可以是其它的客户端程序)的告警信息。 Alertmanager可以对这些告警信息进行进一步的处理, 比如当接收到大量重复告警时能够消除重复的告警信息, 同时对告警信息进行分组并且路由到正确的通知方, Prometheus内置了对邮件, Slack等多种通知方式的支持, 同时还支持与Webhook的集成, 以支持更多定制化的场景。同时AlertManager还提供了静默和告警抑制机制来对告警通知行为进行优化。
Alertmanager特性
Alertmanager除了提供基本的告警通知能力以外, 还主要提供了如: 分组、 抑制以及静默等告警特性:
分组
··分组机制可以将详细的告警信息合并成一个通知。 在某些情况下, 比如由于系统宕机导致大量的告警被同时触发, 在这种情况下分组机制可以将这些被触发的告警合并为一个告警通知, 避免一次性接受大量的告警通知, 而无法对问题进行快速定位。例如, 当集群中有数百个正在运行的服务实例, 并且为每一个实例设置了告警规则。 假如此时发生了网络故障, 可能导致大量的服务实例无法连接到数据库, 结果就会有数百个告警被发送到Alertmanager。而作为用户, 可能只希望能够在一个通知中中就能查看哪些服务实例收到影响。 这时可以按照服务所在集群或者告警名称对告警进行分组, 而将这些告警内聚在一起成为一个通知。告警分组, 告警时间, 以及告警的接受方式可以通过Alertmanager的配置文件进行配置。
抑制
·· 抑制是指当某一告警发出后, 可以停止重复发送由此告警引发的其它告警的机制。例如, 当集群不可访问时触发了一次告警, 通过配置Alertmanager可以忽略与该集群有关的其它所有告警。 这样可以避免接收到大量与实际问题无关的告警通知。抑制机制同样通过Alertmanager的配置文件进行设置。
静默
··静默提供了一个简单的机制可以快速根据标签对告警进行静默处理。 如果接收到的告警符合静默的配置,Alertmanager则不会发送告警通知。静默设置需要在Alertmanager的Werb页面上进行设置。
自定义告警
Prometheus中的告警规则允许你基于PromQL表达式定义告警触发条件, Prometheus后端对这些触发规则进行周期性计算, 当满足触发条件后则会触发告警通知。 默认情况下, 用户可以通过Prometheus的Web界面查看这些告警规则以及告警的触发状态。 当Promthues与Alertmanager关联之后, 可以将告警发送到外部服务如Alertmanager中并通过Alertmanager可以对这些告警进行进一步的处理。
告警规则示例:
1. groups:
2. - name: example
3.   rules:
4.   - alert: HighErrorRate
5.     expr: job:request_latency_seconds:mean5m{job="myjob"} > 0.5
6.     for: 10m
7.     labels:
8.       severity: page
9.     annotations:
10.      summary: High request latency
11.      description: description info
在告警规则文件中, 我们可以将一组相关的规则设置定义在一个group下。 在每一个group中我们可以定义多个告警规则(rule)。一条告警规则主要由以下几部分组成:
alert: 告警规则的名称。
expr: 基于PromQL表达式告警触发条件, 用于计算是否有时间序列满足该条件。
for: 评估等待时间, 可选参数。 用于表示只有当触发条件持续一段时间后才发送告警。 在等待期间新产生告警的状态为pending。
labels: 自定义标签, 允许用户指定要附加到告警上的一组附加标签。
annotations: 用于指定一组附加信息, 比如用于描述告警详细信息的文字等, annotations的内容在告警产生时会一同作为参数发送到Alertmanager。
为了能够让Prometheus能够启用定义的告警规则, 我们需要在Prometheus全局配置文件中通过
rule_files:指定一组告警规则文件的访问路径, Prometheus启动后会自动扫描这些路径下规则文件中定义的内容, 并且根据这些规则计算是否向外部发送通知:
默认情况下Prometheus会每分钟对这些告警规则进行计算, 如果用户想定义自己的告警计算周期, 则
可以通过 evaluation_interval 来覆盖默认的计算周期:
1. global:
2.   [ evaluation_interval: <duration> | default = 1m ]
部署和简单应用Alertmanager
官网下载软件包,二进制安装

##下载速度慢的话,可以复制地址去迅雷下载
wget -c https://github.com/prometheus/alertmanager/releases/download/v0.27.0/alertmanager-0.27.0.linux-amd64.tar.gz
解压软件包
tar xf alertmanager-0.21.0.linux-amd64.tar.gz -C /usr/local/修改alertmanager.yml文件
[root@master alertmanagerl]vim alertmanager.yml
global:
  resolve_timeout: 5m
  smtp_smarthost: 'smtp.163.com:465'
  smtp_from: '123456@163.com' # 用于发送告警右键的邮箱
  smtp_auth_username: '123456@163.com'
  smtp_auth_password: 'xxxxxxxxxxxx' #此处为邮箱的授权密码,非邮箱登录密码
  smtp_require_tls: false

route: # 设置报警分发策略
  group_by: ['alertname'] # 分组标签
  group_wait: 10s # 告警等待时间。告警产生后等待10s,如果有同组告警一起发出
  group_interval: 10s # 两组告警的间隔时间
  repeat_interval: 1m # 重复告警的间隔时间,减少相同右键的发送频率 此处为测试设置为1分钟
  receiver: 'mail' # 默认接收者
  routes: # 指定那些组可以接收消息
  - receiver: mail
receivers:
 - name: 'mail'
   email_configs:
   - to: '123456@163.com' # 接收报警邮件的邮箱


检查alertmanager.yml 配置是否正确,注意实际使用时去掉中文注释。

[root@master alertmanager]# ./amtool check-config alertmanager.yml
Checking 'alertmanager.yml' SUCCESS
Found:
- global config
- route
- 0 inhibit rules
- 1 receivers
- 0 templates
关联Prometheus与Alertmanager
-
修改Prometheus.yml文件中的 alerting 配置项及rule_files配置项
Alertmanager configuration
alerting:
alertmanagers:
- static_configs:
- targets: ["localhost:9093"]Load rules once and periodically evaluate them according to the global 'evaluation_interval'.
rule_files:
- "rule.yml"
- "second_rules.yml"

2.编写告规则rule.yml
## 此处用于测试,设置为当内存占用高于10%时,就会告警
vim /usr/local/prometheus/rule.yml

groups:
- name: mem-rule
  rules:
  - alert: "内存报警"
    expr: (node_memory_MemTotal_bytes -(node_memory_MemFree_bytes+node_memory_Buffers_bytes+node_memory_Cached_bytes )) / node_memory_MemTotal_bytes * 100 > 5
    for: 30s
    labels:
      severity: warning
    annotations:
      summary: "服务名:{{$labels.alertname}} 内存报警"
      description: "{{ $labels.alertname }} 内存资源利用率大于 10%"
      value: "{{ $value }}"
3.检查配置文件是否出错:
[root@master prometheus]# ./promtool check config prometheus.yml
Checking prometheus.yml
  SUCCESS: 1 rule files found
 SUCCESS: prometheus.yml is valid prometheus config file syntax

Checking rule.yml
  SUCCESS: 1 rules found
4.重启服务
systemctl restart prometheus.service`
配置alertmanager服务
mkdir -p /usr/local/alertmanager-0.27.0.linux-amd64/data
vim /usr/lib/systemd/system/alertmanager.service

[Unit]
Description=alertmanager
Documentation=https://github.com/prometheus/alertmanager
After=network.target
[Service]
Type=simple
User=prometheus
WorkingDirectory=/usr/local/alertmanager-0.27.0.linux-amd64
ExecStart=/usr/local/alertmanager-0.27.0.linux-amd64/alertmanager --config.file=alertmanager.yml --storage.path=/usr/local/alertmanager-0.27.0.linux-amd64/data --log.level=debug --log.format=json
Restart=on-failure
[Install]
WantedBy=multi-user.target
启动服务
#改变所属用户
chown -R prometheus.prometheus /usr/local/alertmanager/*
[root@master prometheus]# systemctl daemon-reload
[root@master prometheus]# systemctl enable --now alertmanager.service
[root@master prometheus]# netstat -lnupt | grep 9093
tcp6 0 0 :::9093 :::* LISTEN
111019/alertmanager
测试报警
浏览器访问: http://192.168.50.162:9093 (IP:9093)

触发告警,查看邮箱
