在较多的画图场景中,需要对图像进行局部放大,掌握相关方法非常有用,因此我们很有必要一起学习
【1】官网教程
首先是进入官网教程,找到学习资料:
在这里可以看到好看的放大和缩小视图。
【2】代码解读
引入计算模块numpy和画图模块matplotlib:
import matplotlib.pyplot as plt #引入matplotlib模块画图
import numpy as np #引入numpy模块做数学计算

from matplotlib.patches import Polygon
然后自定义函数:
def f(t):
    return np.exp(-t) * np.cos(2*np.pi*t)  #定义子函数
之后定义自变量:
t1 = np.arange(0.0, 3.0, 0.01) #定义变量
再之后定义画图:
ax1 = plt.subplot(212) #定义2行1列第2个图形
ax1.margins(0.05)           # Default margin is 0.05, value 0 means fit
ax1.plot(t1, f(t1)) #输出图形

ax2 = plt.subplot(221) #定义2行2列第1个图形
ax2.margins(2, 2)           # Values >0.0 zoom out
ax2.plot(t1, f(t1))
ax2.set_title('Zoomed out')

ax3 = plt.subplot(222) #定义2行2列第2个图形
ax3.margins(x=0, y=-0.25)   # Values in (-0.5, 0.0) zooms in to center
ax3.plot(t1, f(t1))
ax3.set_title('Zoomed in')
最后输出图形:
plt.show()
输出图形为:
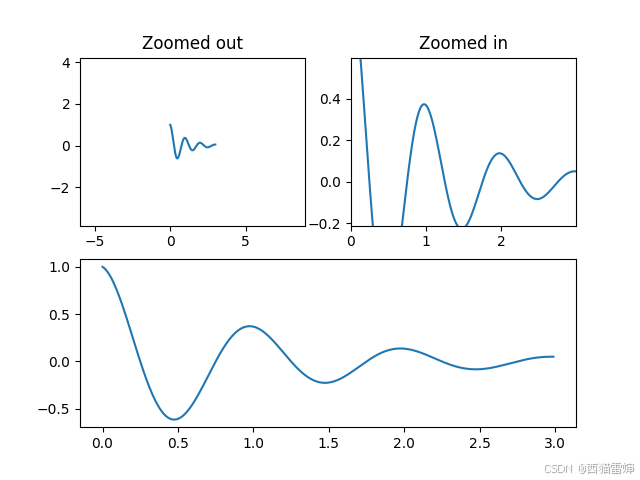
++图1++
由图1可见,通过调节margins()函数中的值,调节函数曲线和X轴Y轴的距离,进而实现图像的放大和缩小。
【3】margins()和xlim()函数/ylim()函数效果对比
前在述学习过程中,已经多次使用xlim()函数和ylim()函数来设置作标轴范围,进而实现对图像的大小进行缩放,未进行对比,将margins()和xlim()函数/ylim()函数效果进行同时输出,设置画图程序如下:
ax1 = plt.subplot(311) #定义3行1列第1个图形
ax1.margins(0.05)           # Default margin is 0.05, value 0 means fit
ax1.plot(t1, f(t1)) #输出图形
ax1.set_title('Zoomed',y=0.68)

ax2 = plt.subplot(312) #定义3行1列第2个图形
ax2.set_ylim(-0.65, 1.1) # Values >0.0 zoom out
ax2.plot(t1, f(t1),color='blue')
ax2.set_title('Set_ylim',y=0.68)
ax2.set_facecolor((0.66,0.36,0.86))

ax3 = plt.subplot(313) #定义3行1列第3个图形
#ax3.margins(x=0, y=-0.25)   # Values in (-0.5, 0.0) zooms in to center
ax3.plot(t1, f(t1),color='green')
ax3.set_title('Origin',y=0.68)
ax3.set_facecolor('#eafff5')
由代码可见,ax1使用了margins()函数,ax2使用了set_ylim()函数,ax3未做限制是默认输出。
运行代码后的结果为:
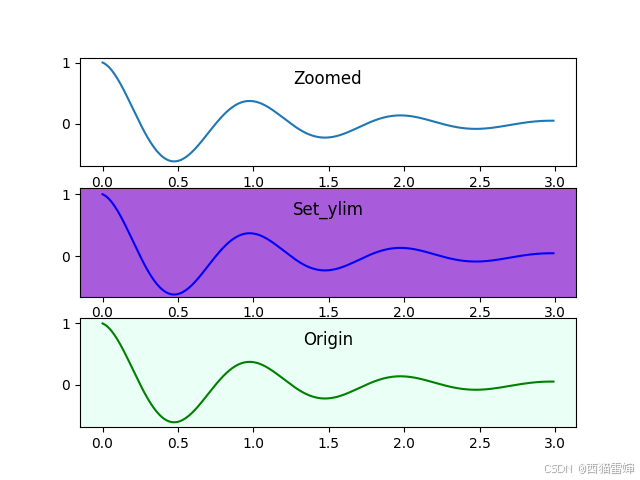
++图2++
由图2可见,margins()和xlim()函数/ylim()函数效果都可以实现良好的输出效果。
如果不想进行限制,默认输出效果同样不错。
实际画图过程中,可根据需要灵活使用函数或者不使用函数以实现画图目的。
至此的完整代码为:
python
import matplotlib.pyplot as plt #引入matplotlib模块画图
import numpy as np #引入numpy模块做数学计算

from matplotlib.patches import Polygon


def f(t):
    return np.exp(-t) * np.cos(2*np.pi*t)  #定义子函数


t1 = np.arange(0.0, 3.0, 0.01) #定义变量

ax1 = plt.subplot(311) #定义3行1列第1个图形
ax1.margins(0.95)           # Default margin is 0.05, value 0 means fit
ax1.plot(t1, f(t1)) #输出图形
ax1.set_title('Zoomed',y=0.68)

ax2 = plt.subplot(312) #定义3行1列第2个图形
ax2.set_ylim(-0.65, 1.1) # Values >0.0 zoom out
ax2.plot(t1, f(t1),color='blue')
ax2.set_title('Set_ylim',y=0.68)
ax2.set_facecolor((0.66,0.36,0.86))

ax3 = plt.subplot(313) #定义3行1列第3个图形
#ax3.margins(x=0, y=-0.25)   # Values in (-0.5, 0.0) zooms in to center
ax3.plot(t1, f(t1),color='green')
ax3.set_title('Origin',y=0.68)
ax3.set_facecolor('#eafff5')

plt.show()
【4】尝试在图形中增开缩小试图
前面已经掌握了对图形进行缩小和方法的方法,有时候需要在一个稍大的图形中,再增加一个缩略图形,为此有必要继续探索。
下述链接给出了简单的教程,点击可一步直达:
基于此我们尝试给margins()函数输出图形增加一个缩略图,增加下述代码:
axins=ax1.inset_axes((0.85,0.5,0.15,0.5))
axins.plot(t1,f(t1))
输出图形为:
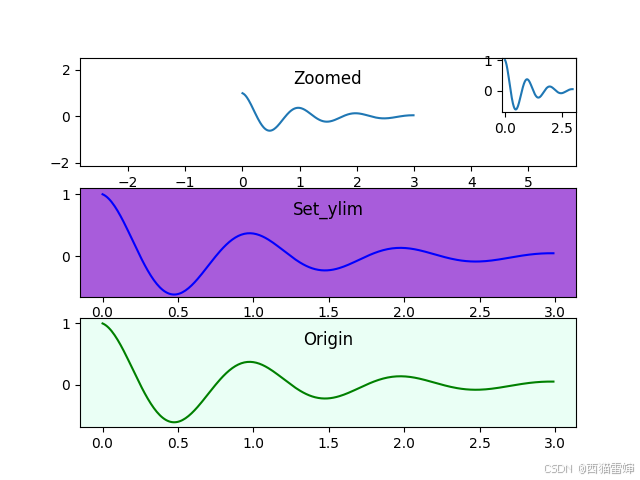
图3
图3即为增加缩略图后的图形。
此时的完整代码为:
python
import matplotlib.pyplot as plt #引入matplotlib模块画图
import numpy as np #引入numpy模块做数学计算

from matplotlib.patches import Polygon


def f(t):
    return np.exp(-t) * np.cos(2*np.pi*t)  #定义子函数


t1 = np.arange(0.0, 3.0, 0.01) #定义变量

ax1 = plt.subplot(311) #定义3行1列第1个图形
ax1.margins(0.95)           # Default margin is 0.05, value 0 means fit
ax1.plot(t1, f(t1)) #输出图形
ax1.set_title('Zoomed',y=0.68)
axins=ax1.inset_axes((0.85,0.5,0.15,0.5))
axins.plot(t1,f(t1))

ax2 = plt.subplot(312) #定义3行1列第2个图形
ax2.set_ylim(-0.65, 1.1) # Values >0.0 zoom out
ax2.plot(t1, f(t1),color='blue')
ax2.set_title('Set_ylim',y=0.68)
ax2.set_facecolor((0.66,0.36,0.86))

ax3 = plt.subplot(313) #定义3行1列第3个图形
#ax3.margins(x=0, y=-0.25)   # Values in (-0.5, 0.0) zooms in to center
ax3.plot(t1, f(t1),color='green')
ax3.set_title('Origin',y=0.68)
ax3.set_facecolor('#eafff5')

plt.show()
【5】局部放大和整体缩小
如果主要想展示局部放大图,同时展示整体缩略图,可以如下设置:
python
import matplotlib.pyplot as plt #引入matplotlib模块画图
import numpy as np #引入numpy模块做数学计算

from matplotlib.patches import Polygon


def f(t):
    return np.exp(-t) * np.cos(2*np.pi*t)  #定义子函数


t1 = np.arange(0.0, 3.0, 0.01) #定义变量

fig , ax1 = plt.subplots( ) #定义3行1列第1个图形
ax1.margins(0.05)           # Default margin is 0.05, value 0 means fit
ax1.plot(t1, f(t1)) #输出图形
ax1.set_title('Zoomed',y=0.68)
axins=ax1.inset_axes((0.85,0.5,0.15,0.5))
axins.plot(t1,f(t1))


plt.show()
输出图像为:
++图4++
图4为常规的图像,大图和小图都是整体图。
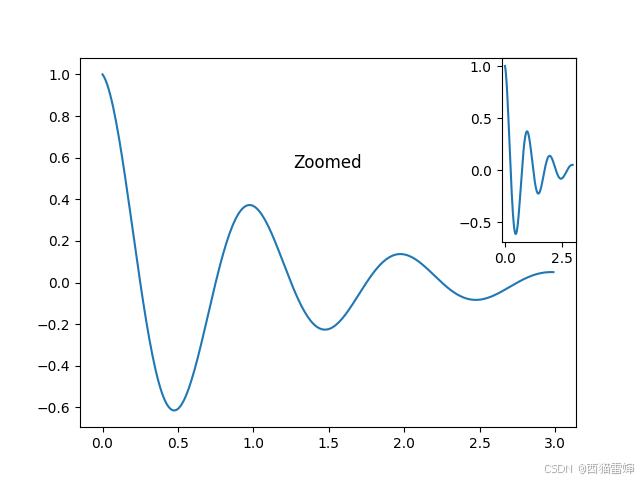
继续调节,将margins()进行修改:
ax1.margins(x=-0.25,y=-0.25)           # Default margin is 0.05, value 0 means fit
ax1.set_ylim(-0.25,0.5)
在修改margins()时,负数可以实现图像放大,设置set_ylim()可以更好地表达图像。
输出图像为:
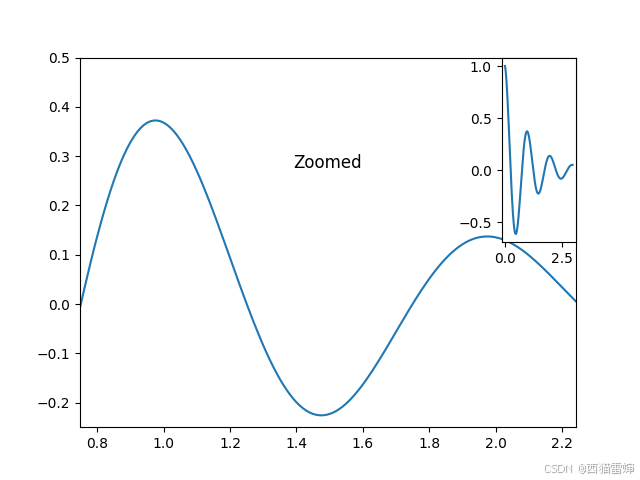
++图5++
python
import matplotlib.pyplot as plt #引入matplotlib模块画图
import numpy as np #引入numpy模块做数学计算

from matplotlib.patches import Polygon


def f(t):
    return np.exp(-t) * np.cos(2*np.pi*t)  #定义子函数


t1 = np.arange(0.0, 3.0, 0.01) #定义变量

fig , ax1 = plt.subplots( ) #定义3行1列第1个图形
ax1.margins(x=-0.25,y=-0.25)           # Default margin is 0.05, value 0 means fit
ax1.set_ylim(-0.25,0.5)
ax1.plot(t1, f(t1)) #输出图形
ax1.set_title('Zoomed',y=0.68)
axins=ax1.inset_axes((0.85,0.5,0.15,0.5))
axins.plot(t1,f(t1))


plt.show()
继续对代码稍作修改:
fig , ax1 = plt.subplots( ) #定义3行1列第1个图形
ax1.margins(x=-0.25,y=-0.25)           # Default margin is 0.05, value 0 means fit
ax1.set_ylim(-0.25,0.5)
ax1.plot(t1, f(t1)) #输出图形
ax1.set_title('Zoomed')
axins=ax1.inset_axes((0.8,0.7,0.2,0.3))
axins.plot(t1,f(t1))
输出图像优化为:
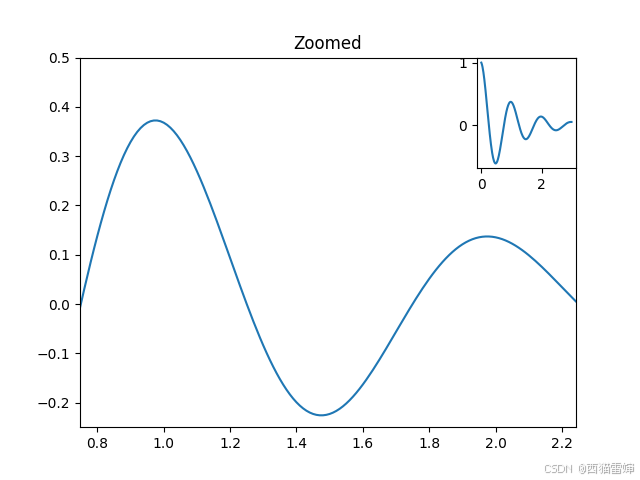
++图6++
可见图6更好地进行了表达。
【6】总结
学习了图像大放大和缩小技巧,探索了将放大和缩小图放在同一个坐标轴内的技巧。