目录
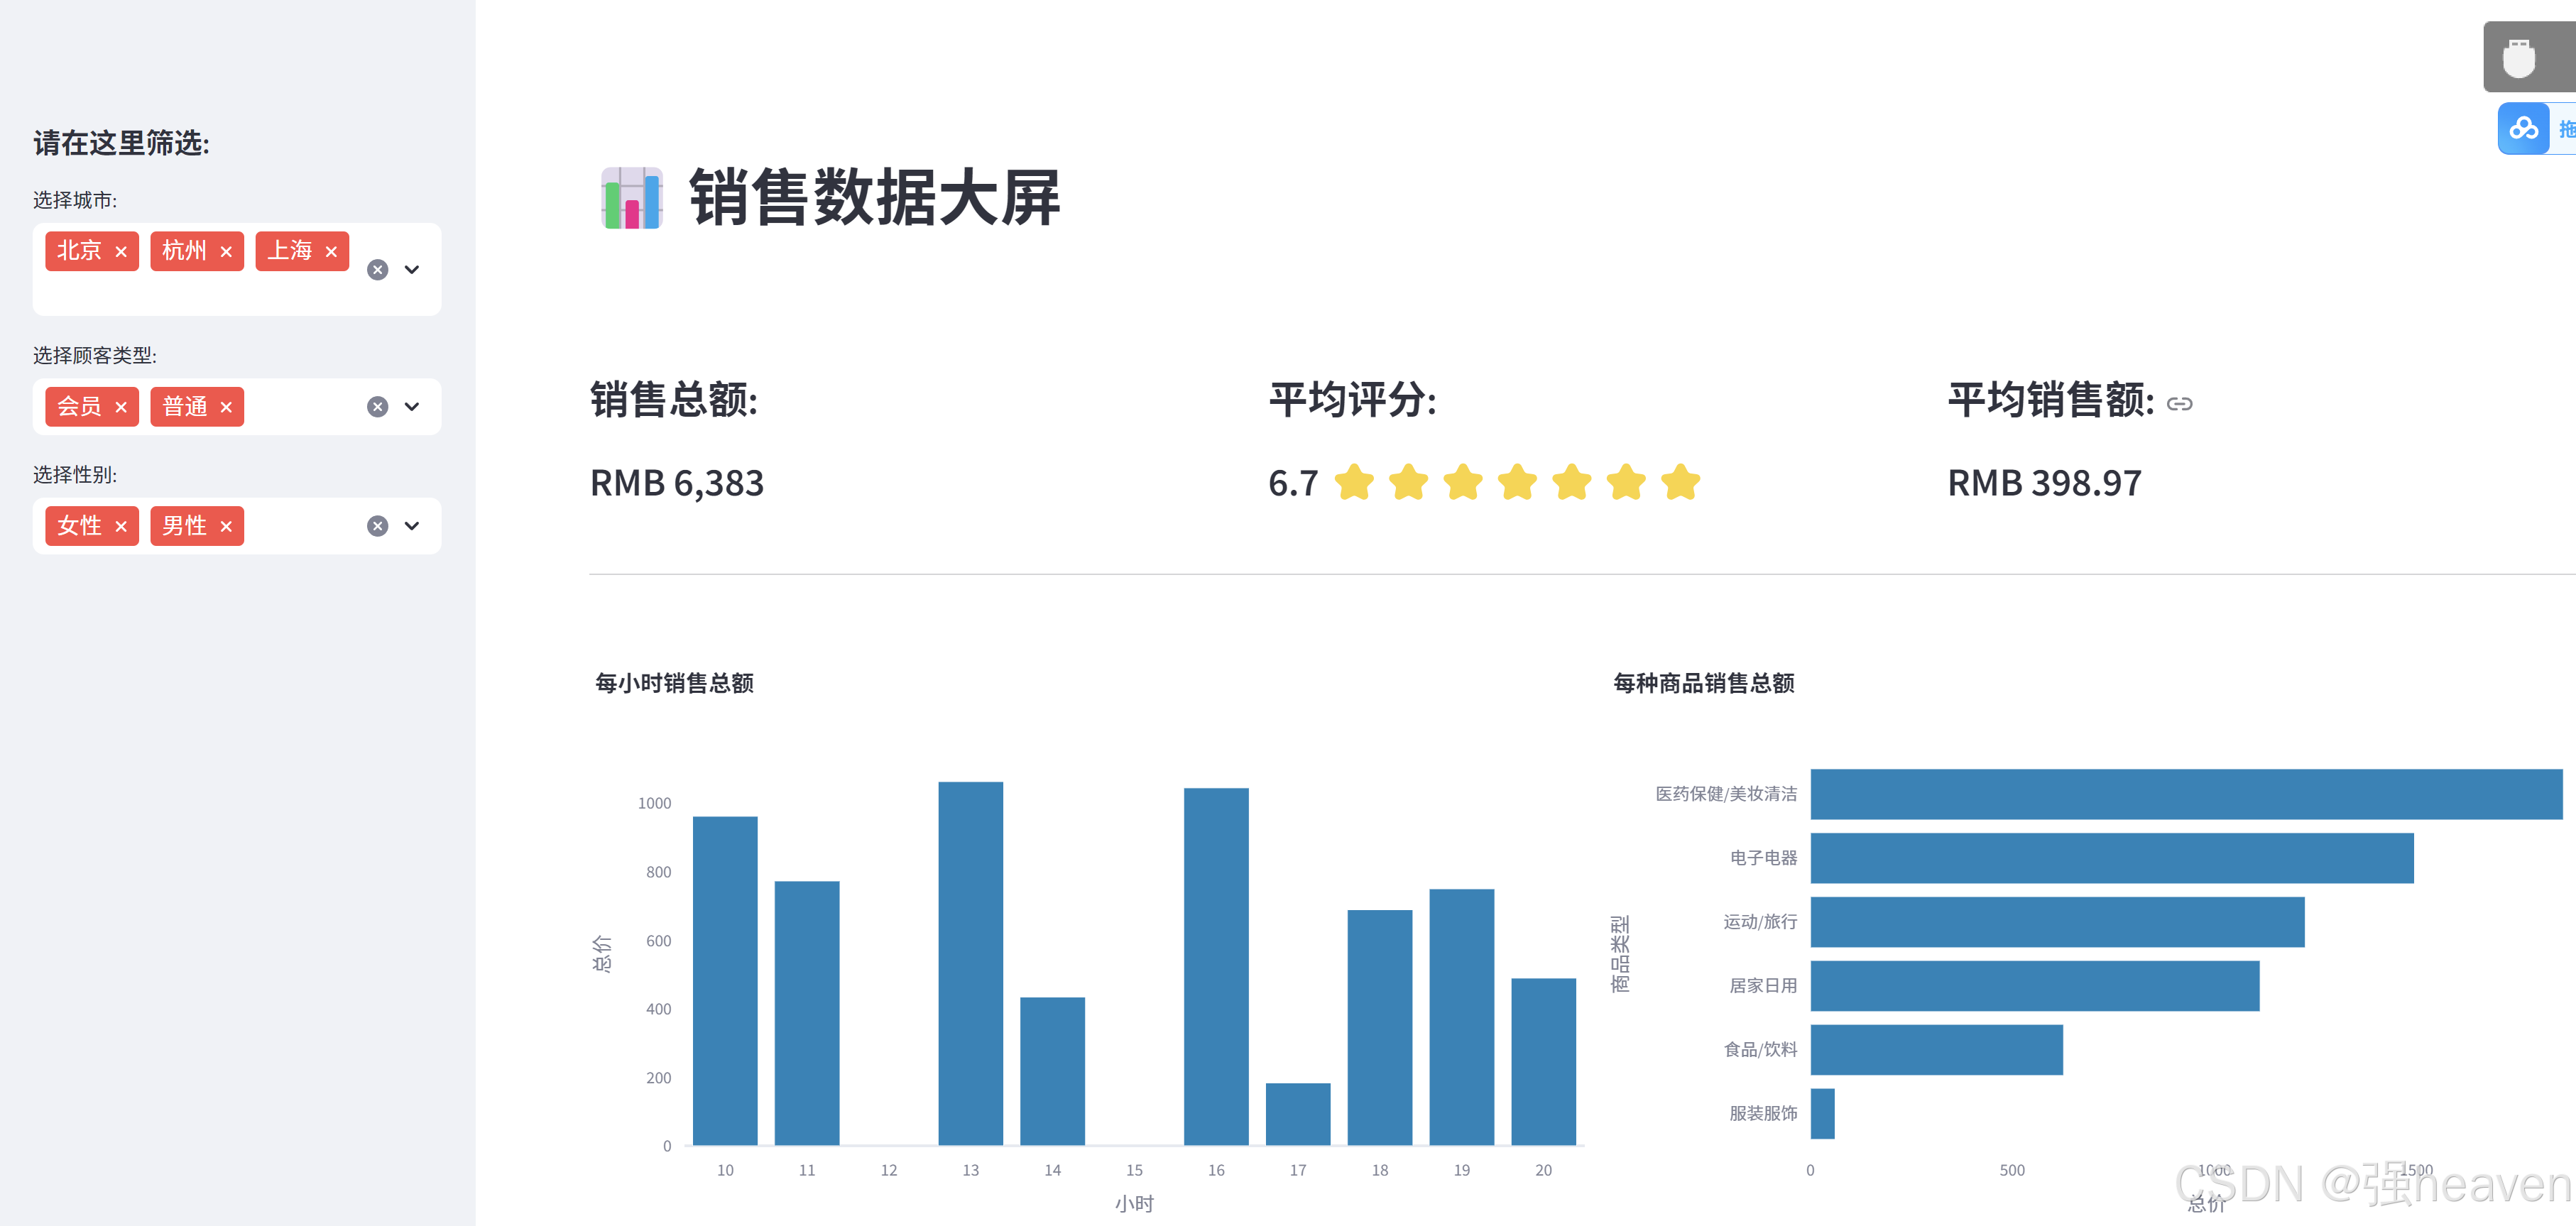
一、案例效果
二、数据分析
使用的数据是虚构数据,某超市销售订单数据(supermarket.csv)。
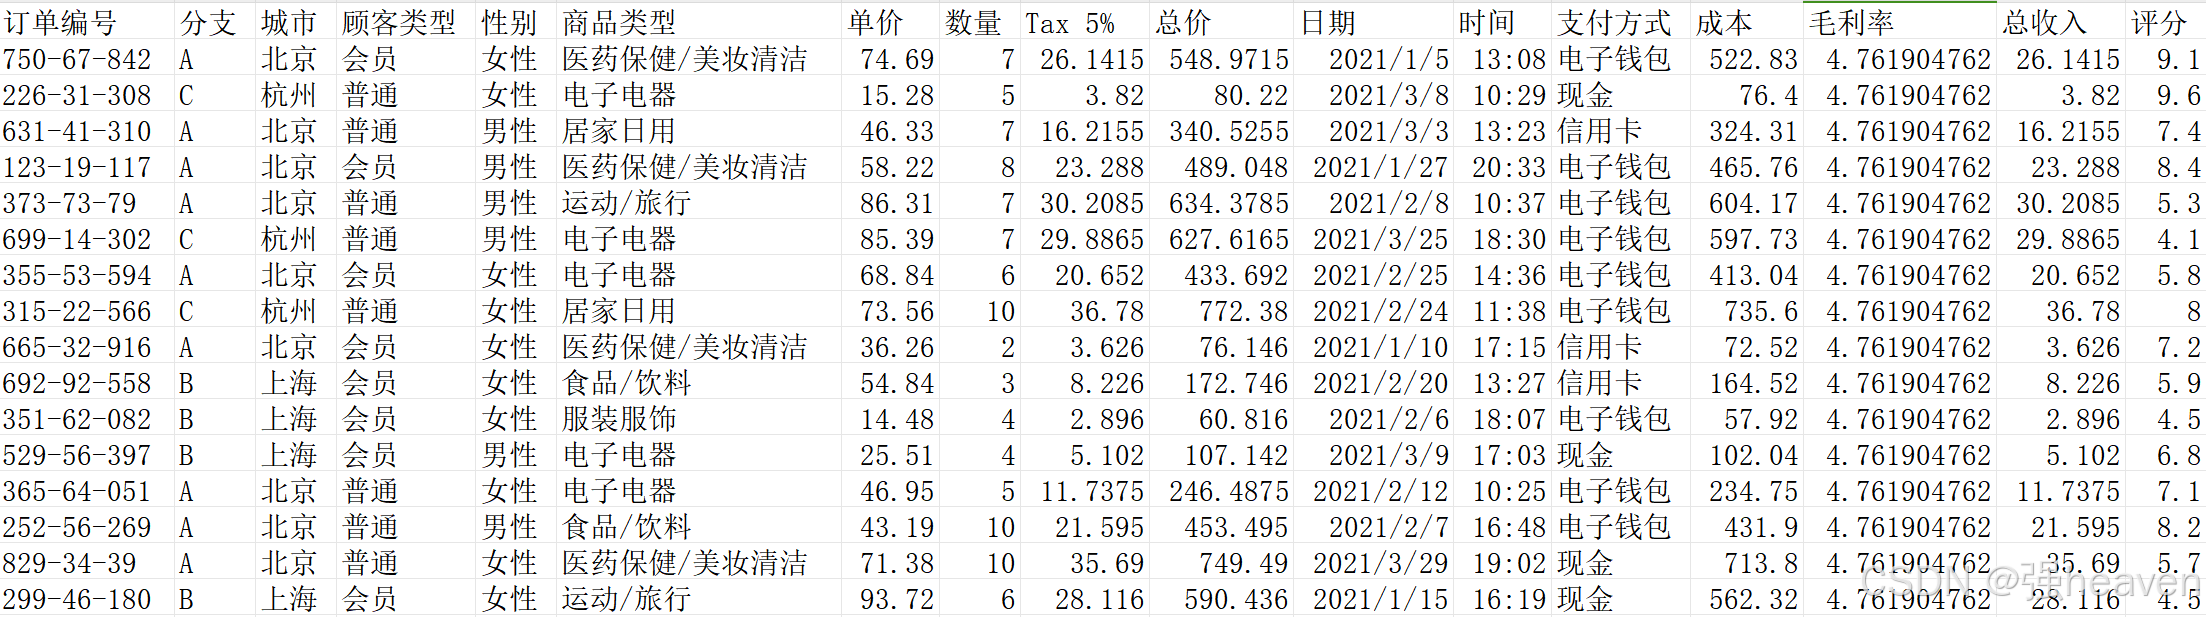
城 市:北京、上海、杭州。
顾客类型:会员和普通。
顾客性别:男性和女性。
其 他:订单编号、商品类型、单价、数量、总价、日期、时间、支付方式、成本、毛利率、总收入、评分等信息。
三、加载数据
import pandas as pd

def get_data_from_csv():
    df = pd.read_csv("supermarket.csv", index_col=0,encoding='gbk')
    # 添加小时列数据
    df["小时"] = pd.to_datetime(df["时间"], format="%H:%M").dt.hour
    return df

df = get_data_from_csv()
print(df)
运行结果:
四、网站前端
(一)网页标题和图标
当浏览器打开一个网页,会有标题和图标。
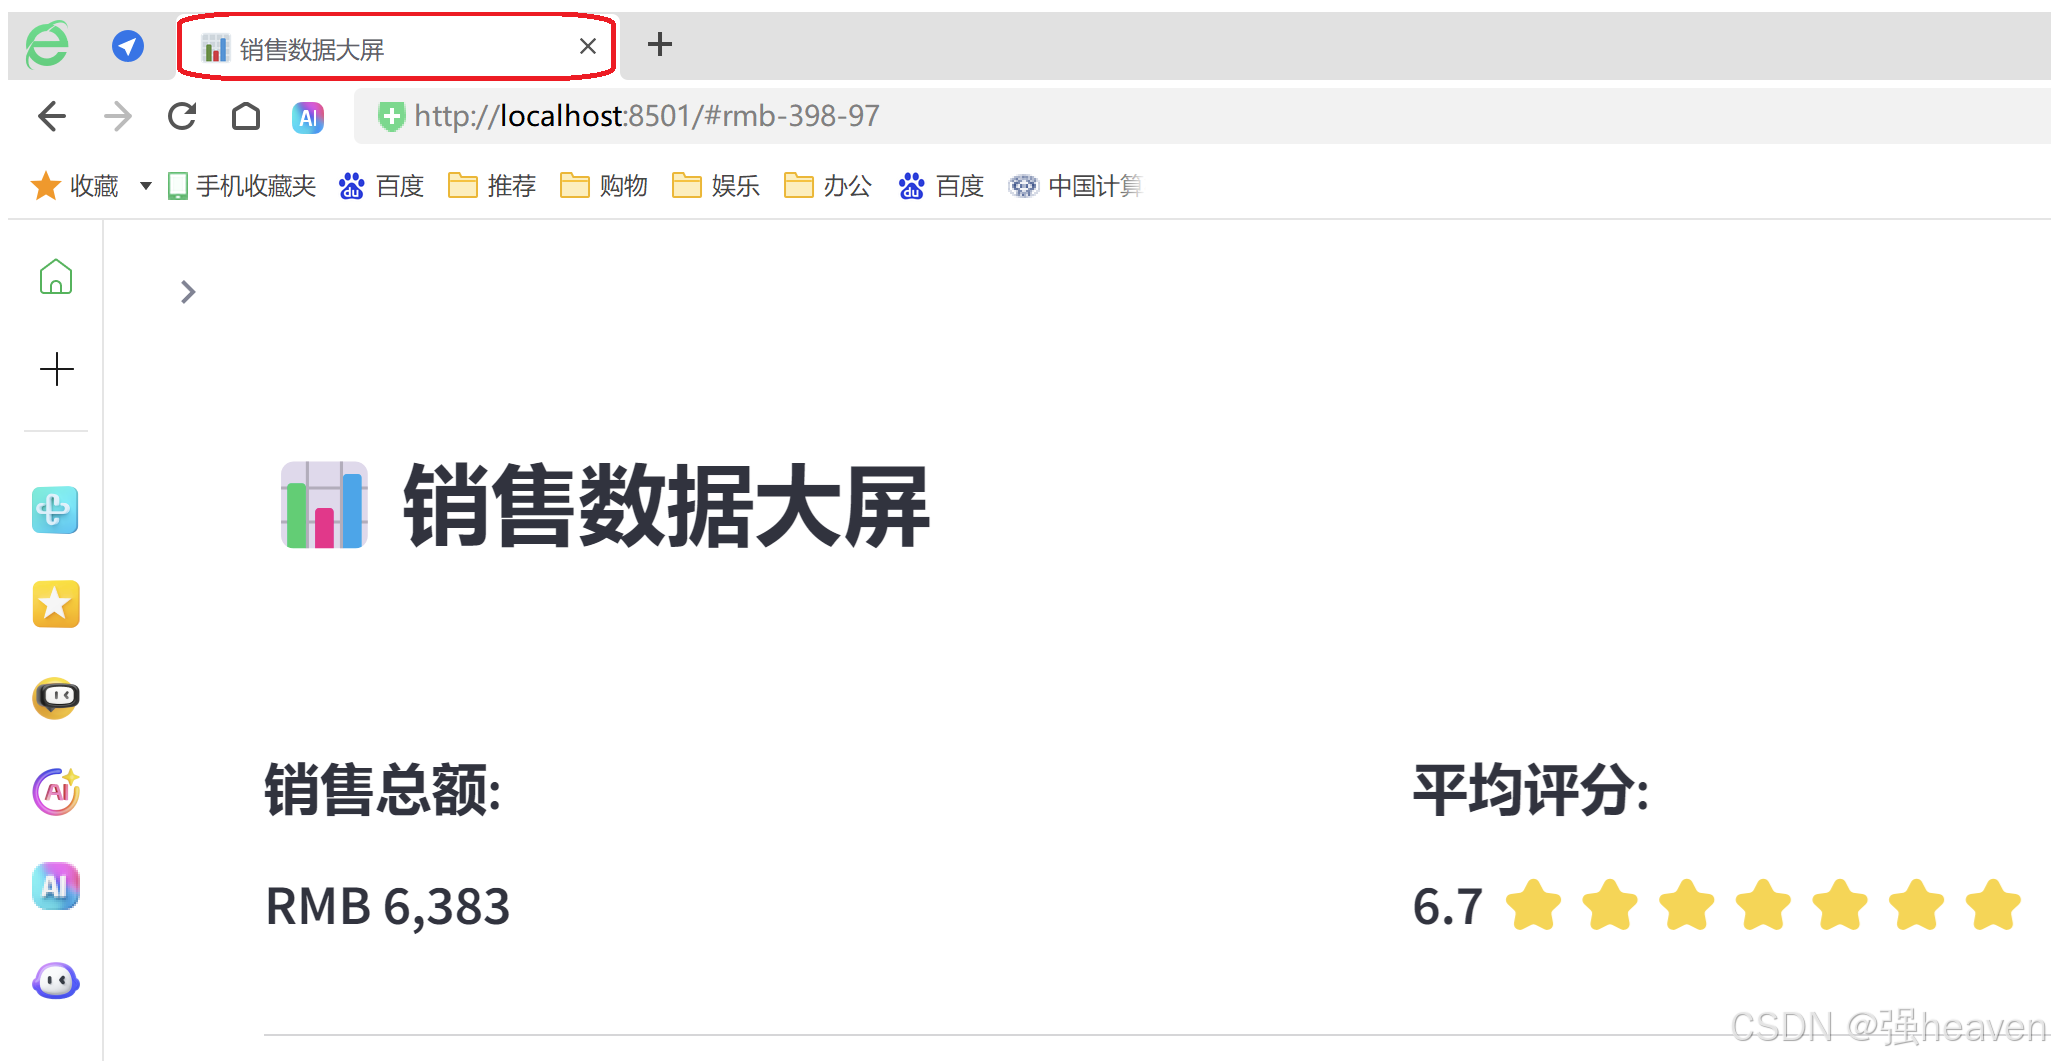
设置本次网页的名称、图标、布局等。使用Streamlit搭建页面。
# 设置网页信息
st.set_page_config(page_title="销售数据大屏", page_icon=":bar_chart:", layout="wide")
其中page_icon参数可以使用表情符号代码来显示图标。
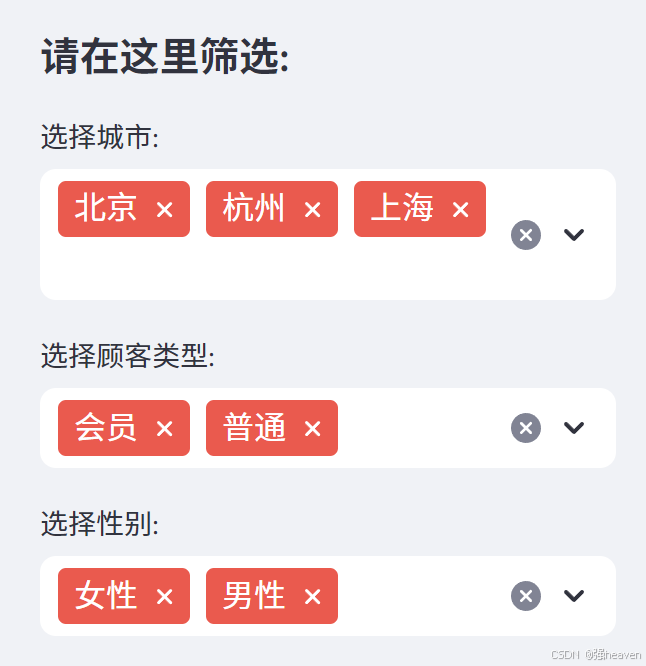
(二)侧边栏和多选框
st.sidebar(侧边栏),每个传递给st.sidebar的元素都会被固定在左边,让用户可以专注于主页中的内容。
multiselect(多选框),是一个交互性的组件,可以通过它进行数据筛选。
# 侧边栏
st.sidebar.header("请在这里筛选:")
city = st.sidebar.multiselect(
    "选择城市:",
    options=df["城市"].unique(),
    default=df["城市"].unique()
)

customer_type = st.sidebar.multiselect(
    "选择顾客类型:",
    options=df["顾客类型"].unique(),
    default=df["顾客类型"].unique(),
)

gender = st.sidebar.multiselect(
    "选择性别:",
    options=df["性别"].unique(),
    default=df["性别"].unique()
)

df_selection = df.query(
    "城市 == @city & 顾客类型 ==@customer_type & 性别 == @gender"
)
结合Pandas的query查询,对数据进行过滤。
(三)主页面信息
编写主页面信息,包含主页标题、销售总额、平均评分、平均销售额信息。
和网页的图标一样,通过表情符号代码实现。
# 主页面
st.title(":bar_chart: 销售数据大屏")
st.markdown("##")

# 核心指标, 销售总额、平均评分、星级、平均销售额数据
total_sales = int(df_selection["总价"].sum())
average_rating = round(df_selection["评分"].mean(), 1)
star_rating = ":star:" * int(round(average_rating, 0))
average_sale_by_transaction = round(df_selection["总价"].mean(), 2)

# 3列布局
left_column, middle_column, right_column = st.columns(3)

# 添加相关信息
with left_column:
    st.subheader("销售总额:")
    st.subheader(f"RMB {total_sales:,}")
with middle_column:
    st.subheader("平均评分:")
    st.subheader(f"{average_rating} {star_rating}")
with right_column:
    st.subheader("平均销售额:")
    st.subheader(f"RMB {average_sale_by_transaction}")

# 分隔符
st.markdown("""---""")
(四)主页面图表
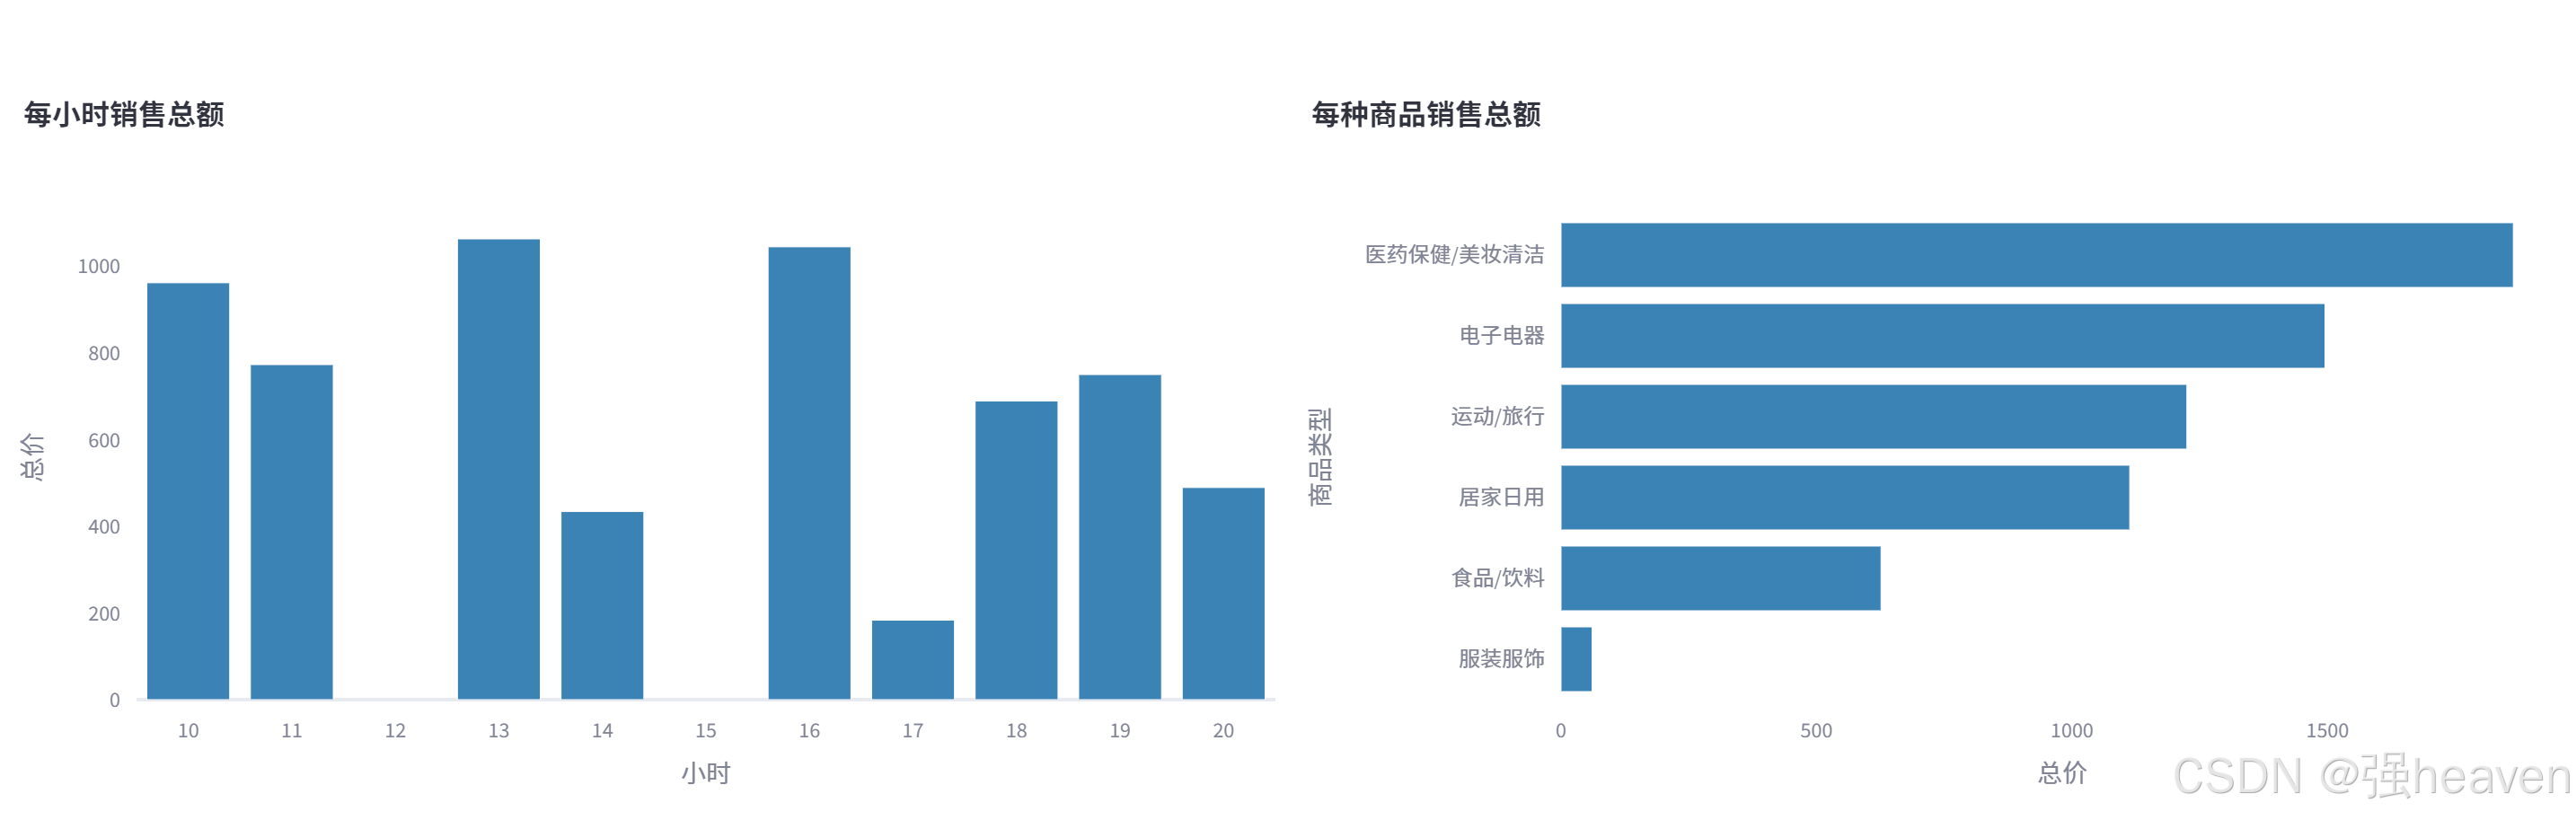
包含了两个图表,一个是每小时销售额,一个是各类商品销售总额。
通过Plotly Express完成图表的绘制。Plotly Express是一个新的高级Python可视化库。
pip install plotly_expressimport plotly_express as px
# 各类商品销售情况(柱状图)
sales_by_product_line = (
    df_selection.groupby(by=["商品类型"]).sum()[["总价"]].sort_values(by="总价")
)
fig_product_sales = px.bar(
    sales_by_product_line,
    x="总价",
    y=sales_by_product_line.index,
    orientation="h",
    title="<b>每种商品销售总额</b>",
    color_discrete_sequence=["#0083B8"] * len(sales_by_product_line),
    template="plotly_white",
)
fig_product_sales.update_layout(
    plot_bgcolor="rgba(0,0,0,0)",
    xaxis=(dict(showgrid=False))
)

# 每小时销售情况(柱状图)
sales_by_hour = df_selection.groupby(by=["小时"]).sum()[["总价"]]
print(sales_by_hour.index)
fig_hourly_sales = px.bar(
    sales_by_hour,
    x=sales_by_hour.index,
    y="总价",
    title="<b>每小时销售总额</b>",
    color_discrete_sequence=["#0083B8"] * len(sales_by_hour),
    template="plotly_white",
)
fig_hourly_sales.update_layout(
    xaxis=dict(tickmode="linear"),
    plot_bgcolor="rgba(0,0,0,0)",
    yaxis=(dict(showgrid=False)),
)


left_column, right_column = st.columns(2)
left_column.plotly_chart(fig_hourly_sales, use_container_width=True)
right_column.plotly_chart(fig_product_sales, use_container_width=True)
添加数据,设置图表配置,以及网页布局。
得到结果如下:
(五)隐藏部件
当我们通过Streamlit搭建一个界面,默认就会有红线、菜单、结尾的"Make with Streamlit"。
为了美观,这里可以将它们都隐藏掉。
# 隐藏streamlit默认格式信息
hide_st_style = """
            <style>
            #MainMenu {visibility: hidden;}
            footer {visibility: hidden;}
            header {visibility: hidden;}
            <![]()yle>
            """

st.markdown(hide_st_style, unsafe_allow_html=True)
这样一个可交互的销售数据看板,就完成搭建啦!
# 安装依赖库
pip install -i https://pypi.tuna.tsinghua.edu.cn/simple plotly==5.24.1
pip install -i https://pypi.tuna.tsinghua.edu.cn/simple streamlit==1.38.0

# 运行
streamlit run main.py【参考文献】https://blog.csdn.net/Pythonxiaoxin6/article/details/130501494