给出点
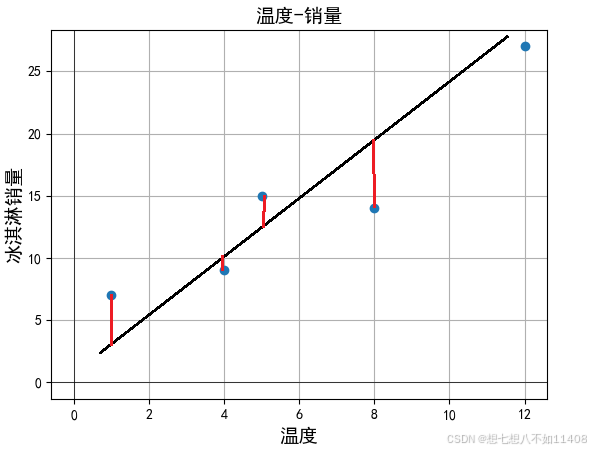
x = [1,4,5,8,12]
y = [7,9,15,14,27]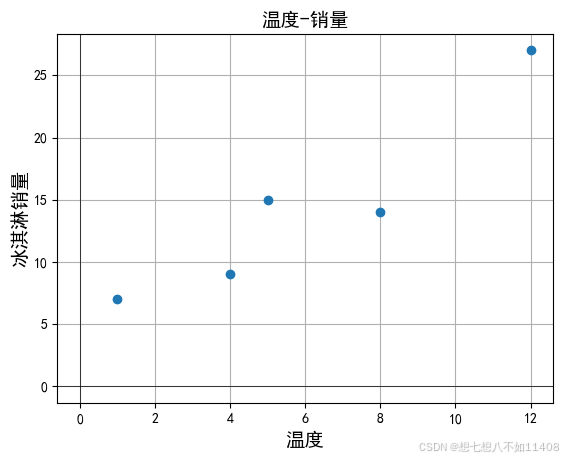
要找出温度和冰淇淋销量之间的关系,通过线性回归来拟合求出属性和结果之间的线性关系。
如果直接把这些点连起来,是吃力不讨好的,因为如果有新数据进来大概率不在这条线上,这个行为也叫做过拟合。
对于这种明显有相关关系的数据,直接用一条直线去拟合这些数据,一次函数y=kx+b,k、b确定了直线也就确定了。找最合适的直线的过程就叫线性回归。
评判标准
找出每个真实数据点到直线的距离。

列个表看看:
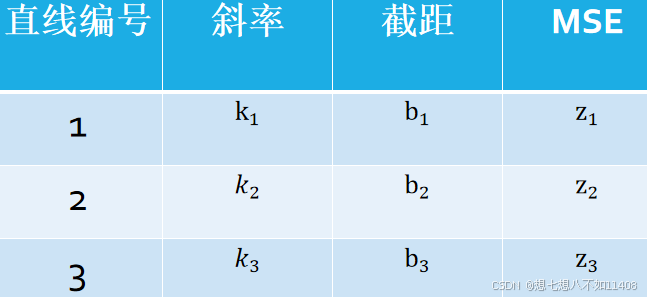
定义损失函数 f(k,b)=z
python
import numpy as np
import matplotlib.pyplot as plt
from mpl_toolkits.mplot3d import Axes3D

x = np.array([1, 4, 5, 8, 12])
y_true = np.array([7, 9, 15, 14, 27])

def model(x, k, b):
    return k * x + b
def mse_loss(y_true, y_pred):
    return np.mean((y_true - y_pred) ** 2)

# 生成参数 k 和 b 的取值范围
k_values = np.linspace(0, 3, 100)
b_values = np.linspace(-5, 5, 100)

# 创建网格
K, B = np.meshgrid(k_values, b_values)

# 计算每个 (k, b) 组合下的损失值
Z = np.zeros_like(K)
for i in range(len(k_values)):
    for j in range(len(b_values)):
        y_pred = model(x, K[i, j], B[i, j])
        Z[i, j] = mse_loss(y_true, y_pred)

# 绘制三维损失函数曲面图
fig = plt.figure(figsize=(10, 7))
ax = fig.add_subplot(111, projection='3d')

ax.plot_surface(K, B, Z, cmap='viridis')

ax.set_xlabel('Slope (k)')
ax.set_ylabel('Intercept (b)')
ax.set_zlabel('MSE Loss')
ax.set_title('3D Loss Function Surface')

plt.show()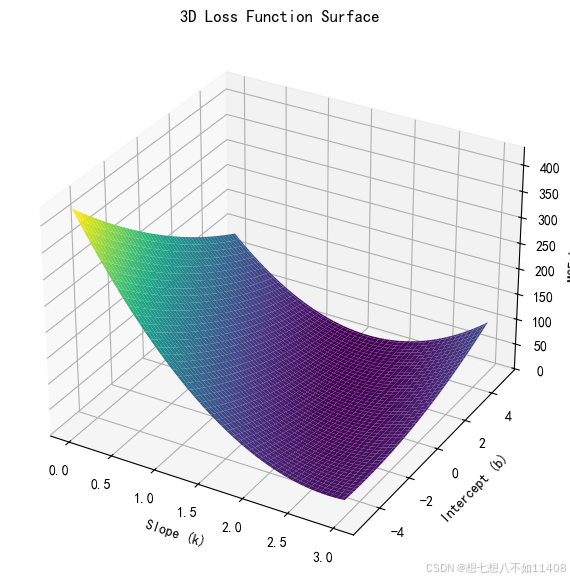
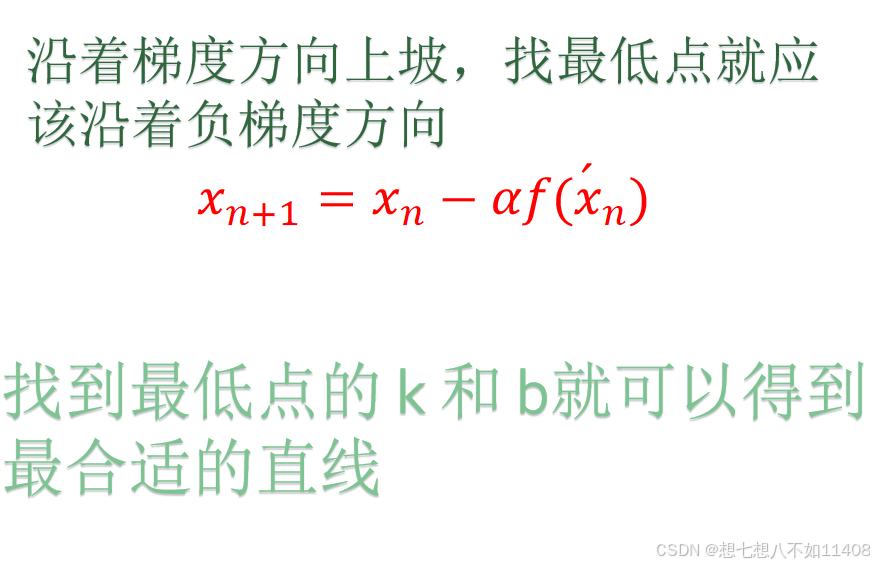
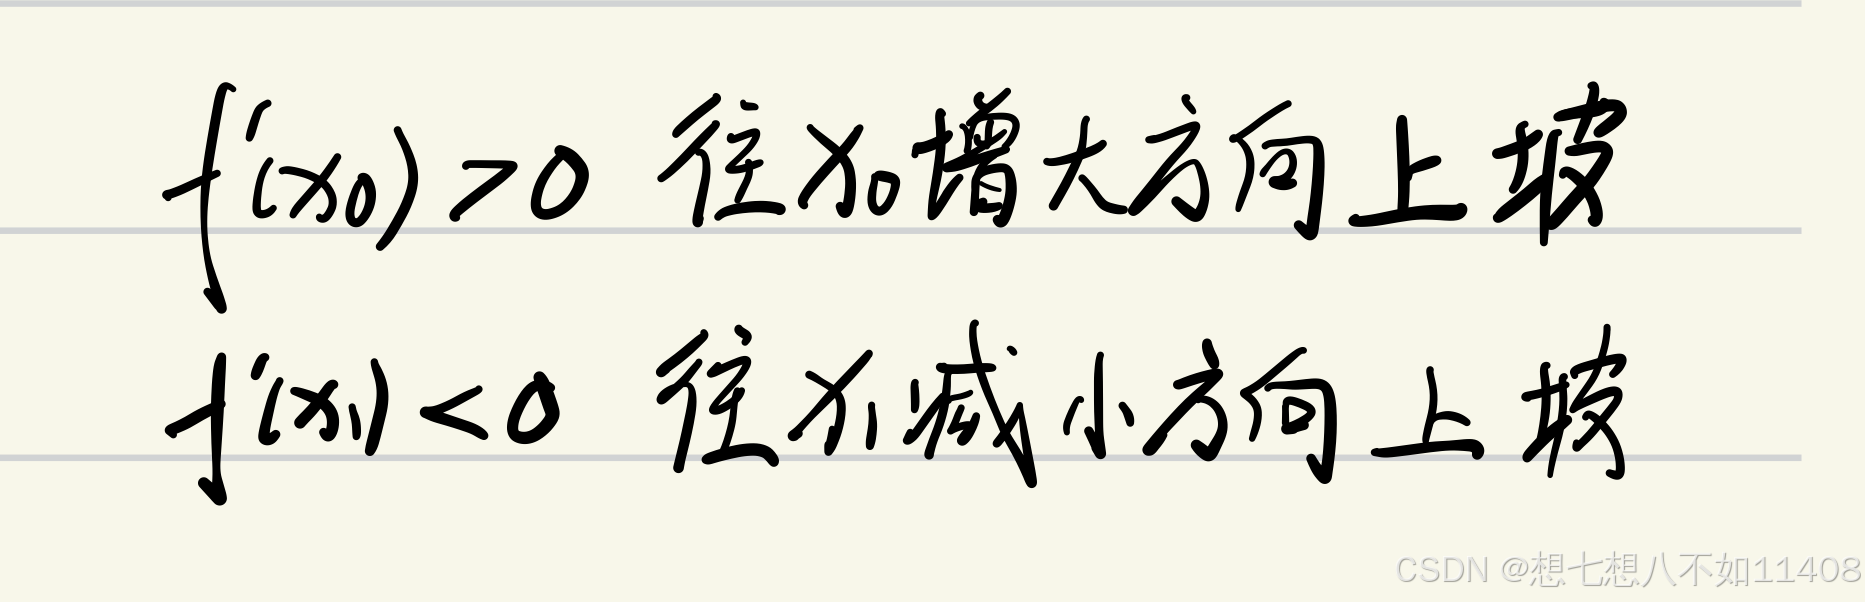
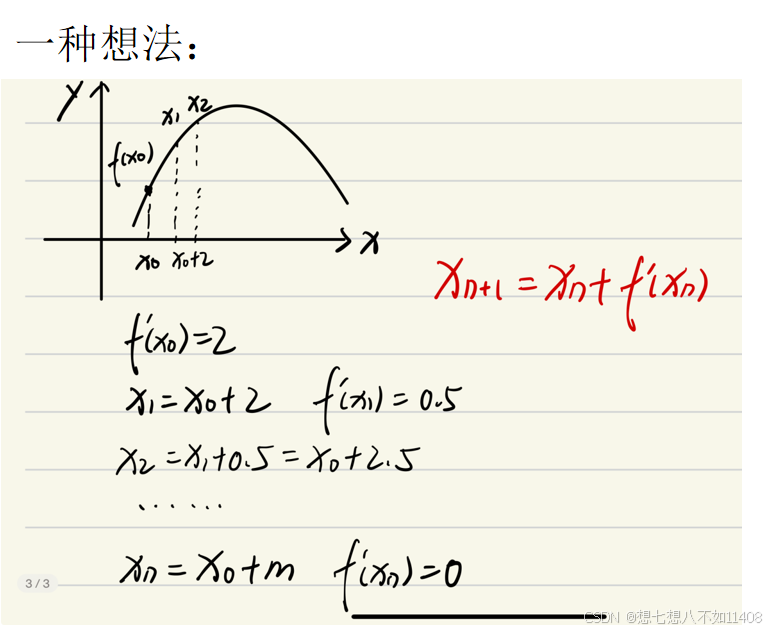
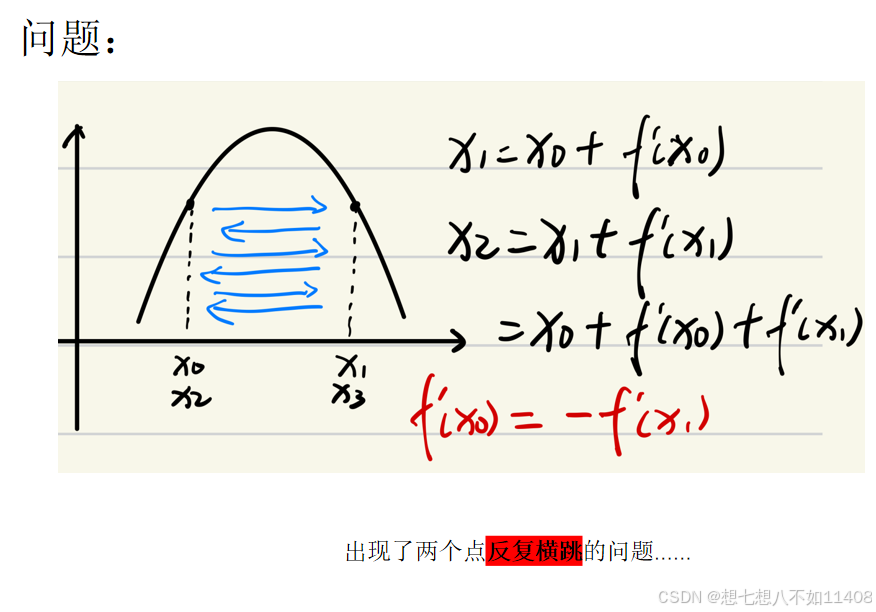
问题就转化成了找到图像的谷底。
对于一次函数:
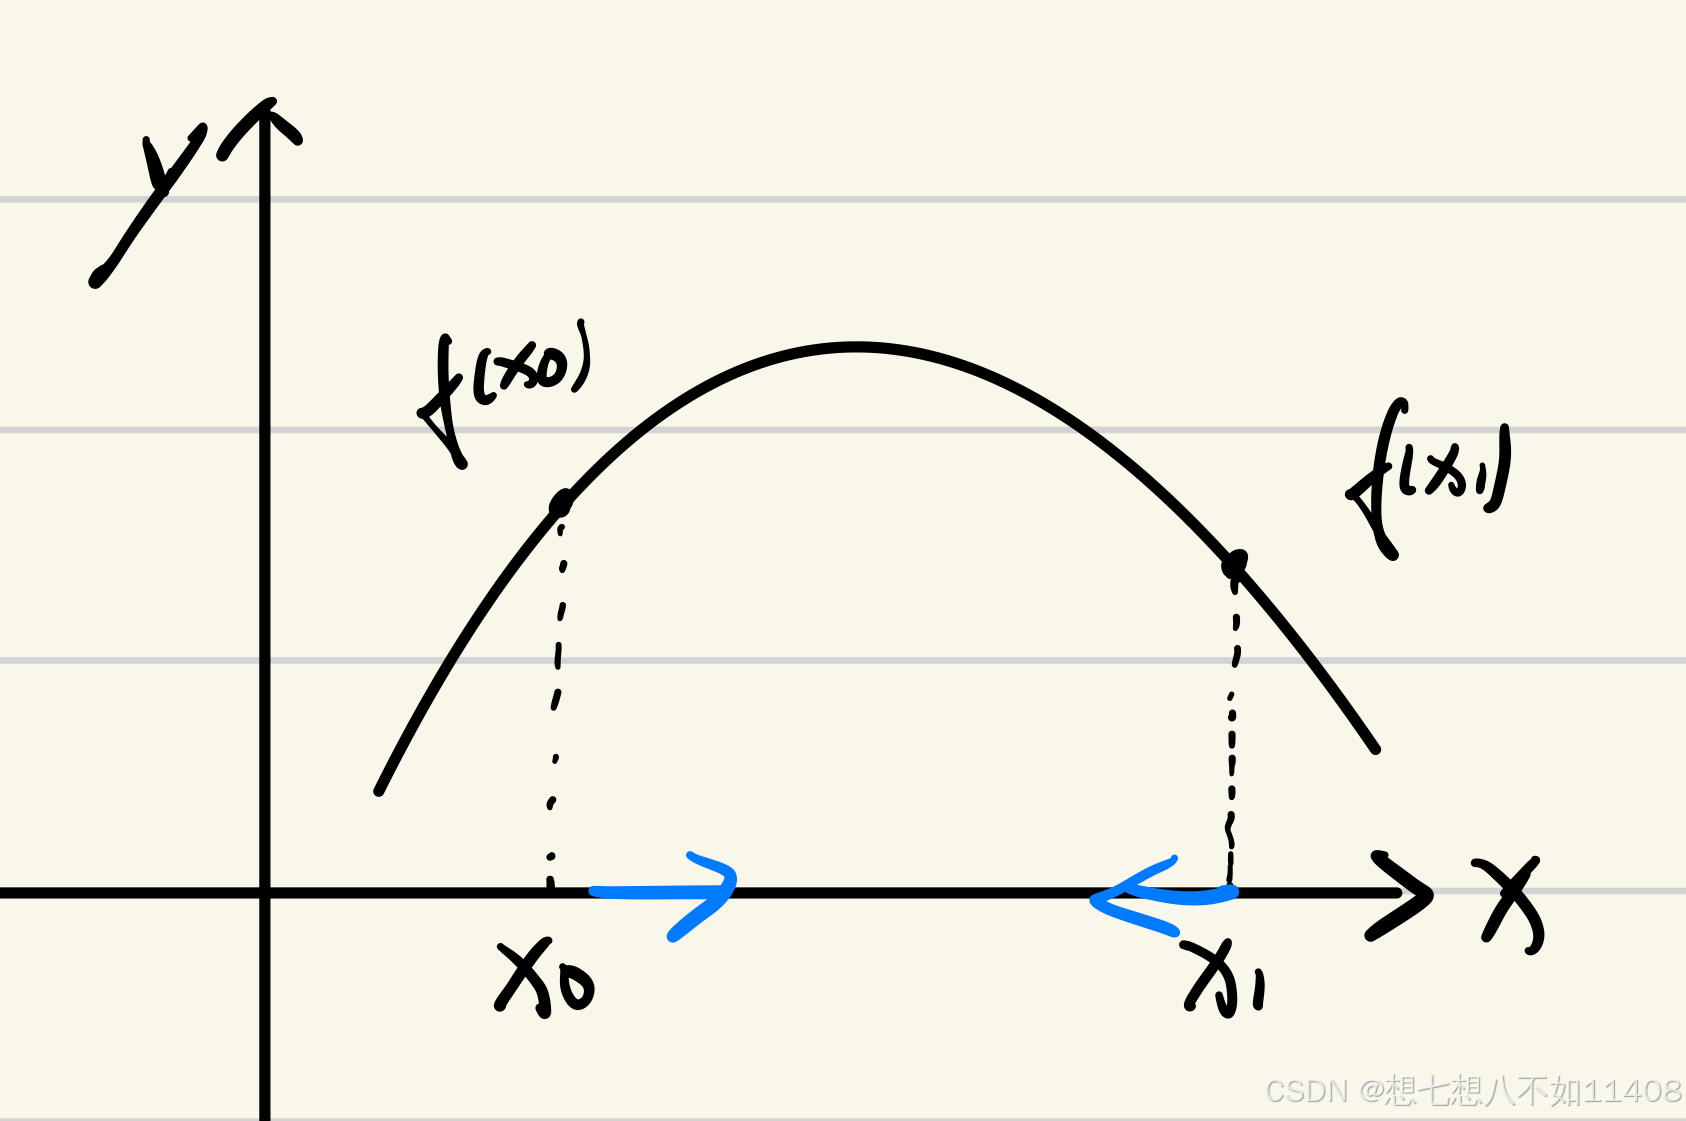
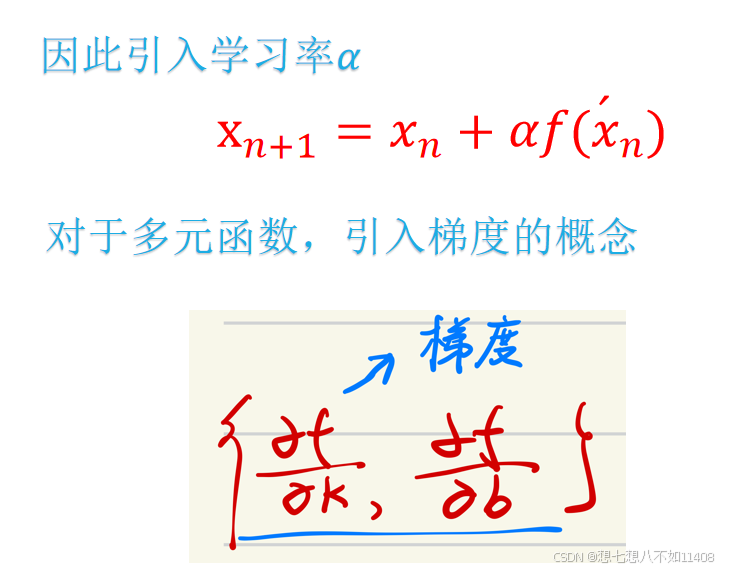
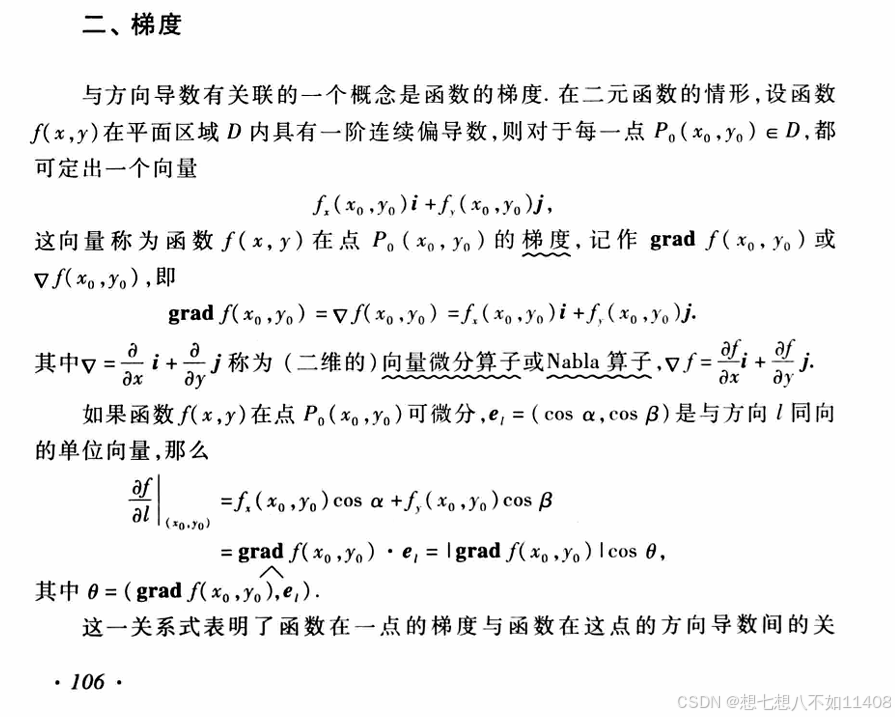
高等数学下中对于梯度的介绍: