前言
PostgreSQL 介绍
PostgreSQL 是一个高度稳定和功能丰富的开源关系数据库系统。其功能集、扩展性和开源特性使其成为各种类型应用的理想选择,它支持高级特性如事务处理、扩展插件和多种编程语言接口,适用于从 web 应用到企业级系统的各种场景。无论是小型项目还是大型企业级应用 PostgreSQL 都提供可靠、高性能的数据管理解决方案,助力创新和业务增长。
PostgreSQL 核心特性如下:
- SQL 兼容:PostgreSQL 支持大部分 SQL 标准并提供了许多其他先进功能,比如复杂查询、外键、触发器、视图、事务完整性以及多版本并发控制 (MVCC)。
- 扩展性:用户可以通过添加新的数据类型、函数、操作符或者索引方法来扩展 PostgreSQL。
- 高度并发:PostgreSQL 的 MVCC 特性允许数据在读取时不被锁定,从而增加了并发性能和读写操作的效率。
- 多种索引技术:包括 B-tree, hash, GiST, SP-GiST, BRIN 和 GIN 等多种索引技术,使得 PostgreSQL 在不同类型的查询中表现出优异的性能。
- 可靠性和持久性:它支持点对点复制和异步复制以增强数据的安全性和可靠性。
- 程序化:支持多种存储过程语言,如 PL/pgSQL(类似 Oracle 的 PL/SQL)、PL/Python、PL/Perl、PL/Ruby 等。
- JSON 支持:提供对 JSON 数据格式的原生支持,允许直接在数据库中处理 JSON 数据。
使用可观测性工具对 PostgreSQL 数据库进行监控和跟踪至关重要,因为它们提供了对数据库性能、健康状况和运行状况的深入洞察。通过可观测性,数据库管理员和开发人员能够实时检测和诊断问题,从而快速响应并解决潜在的性能瓶颈、查询效率低下或系统错误。此外,可观测性还有助于预测未来的资源需求,优化数据库配置,以及确保数据的安全性和合规性。总之,可观测性是确保 PostgreSQL 数据库稳定、高效运行的关键因素。
观测云介绍
作为一款具备可观测性的统一实时监测应用,观测云可以帮助用户快速实现系统可观测性,统一满足云平台、云原生、应用及业务相关的监测需求,为每一个完整的应用构建全链路的可观测性。观测云数据的采集是通过 DataKit 来实现的,只需要安装 DataKit,开通 PostgreSQL 采集器,即可从 PostgreSQL 实例中采集实例运行状态指标,并将指标采集到观测云,帮助监控分析 PostgreSQL 各种异常情况。以下是安装 DataKit 并开启配置 PostgreSQL 采集器的介绍。
前提条件
部署 DataKit
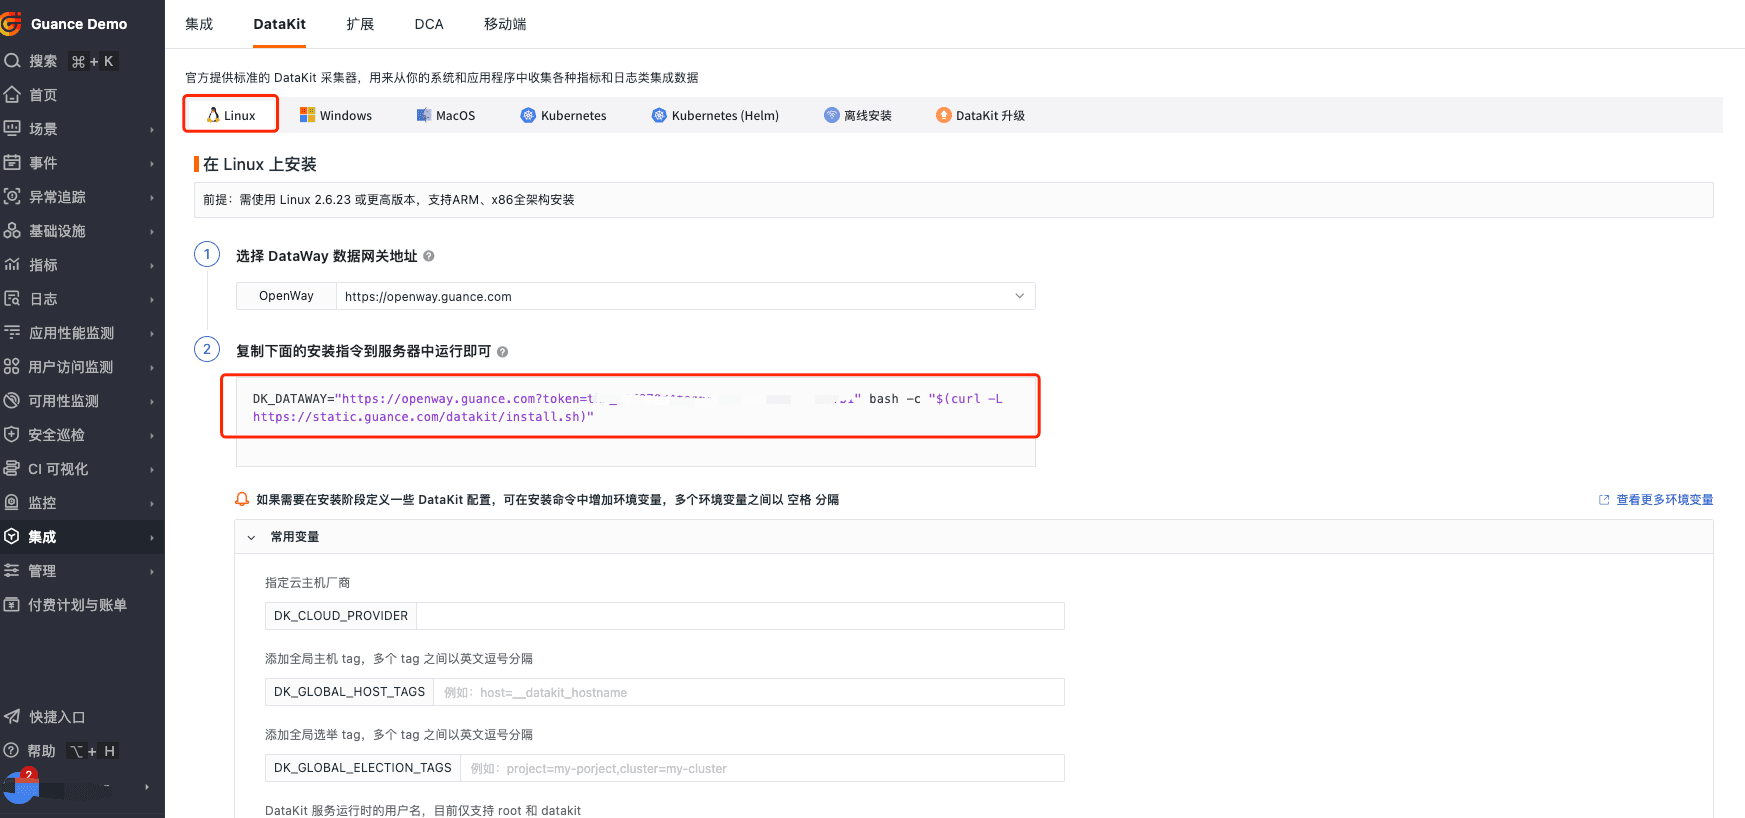
登录观测云控制台,点击「集成」 -「DataKit」 - 「Linux」,复制命令并执行。
PostgreSQL 监控帐号
-
PostgreSQL 版本 >= 9.0
-
创建监控帐号
-- PostgreSQL >= 10
create user datakit with password '';
grant pg_monitor to datakit;
grant SELECT ON pg_stat_database to datakit;-- PostgreSQL < 10
create user datakit with password '';
grant SELECT ON pg_stat_database to datakit;
操作步骤
指标采集
以下主要是通过主机的方式进行采集,进入 DataKit 安装目录下的 conf.d/db 目录,复制 postgresql.conf.sample 并命名为 postgresql.conf。
注意:address 定义了连接到 postgresql 服务器的 URI,这里的 datakit 是用户名,PASSWORD 应被替换为实际的密码,localhost 是数据库服务器地址,sslmode=disable 表示不使用 SSL 连接。
postgresql_lock ,postgresql_stat ,postgresql_index ,postgresql_size ,postgresql_statio 这些指标需要开启配置文件中的 relations 字段。
[[inputs.postgresql]]
  ## Server address
  # URI format
  # postgres://[datakit[:PASSWORD]]@localhost[/dbname]?sslmode=[disable|verify-ca|verify-full]
  # or simple string
  # host=localhost user=pqgotest password=... sslmode=... dbname=app_production

  address = "postgres://datakit:PASSWORD@localhost?sslmode=disable"

  ## Ignore databases which are gathered. Do not use with 'databases' option.
  #
  # ignored_databases = ["db1"]

  ## Specify the list of the databases to be gathered. Do not use with the 'ignored_databases' option.
  #
  # databases = ["db1"]

  ## Specify the name used as the "server" tag.
  #
  # outputaddress = "db01"

  ## Collect interval
  # Time unit: "ns", "us" (or "µs"), "ms", "s", "m", "h"
  #
  interval = "10s"

  ## Relations config
  # The list of relations/tables can be specified to track per-relation metrics. To collect relation
  # relation_name refer to the name of a relation, either relation_name or relation_regex must be set.
  # relation_regex is a regex rule, only takes effect when relation_name is not set.
  # schemas used for filtering, ignore this field when it is empty
  # relkind can be a list of the following options:
  #   r(ordinary table), i(index), S(sequence), t(TOAST table), p(partitioned table),
  #   m(materialized view), c(composite type), f(foreign table)
  #
[[inputs.postgresql.relations]]
  #relation_name = "products"
  relation_regex = ".*"
  schemas = ["public"]
  relkind = ["r", "p"]
...
日志采集
PostgreSQL 日志输出
PostgreSQL 日志默认是输出至 stderr ,如需开启文件日志,可在 PostgreSQL 的配置文件 /var/lib/pgsql/15/data/postgresql.conf 调整输出:
logging_collector = on    # 开启日志写入文件功能

log_directory = 'pg_log'  # 设置文件存放目录,绝对路径或相对路径(相对 PGDATA)

log_filename = 'pg.log'   # 日志文件名称
log_statement = 'all'     # 记录所有查询

#log_duration = on
log_line_prefix= '%m [%p] %d [%a] %u [%h] %c ' # 日志行前缀
log_file_mode = 0644

# For Windows
#log_destination = 'eventlog'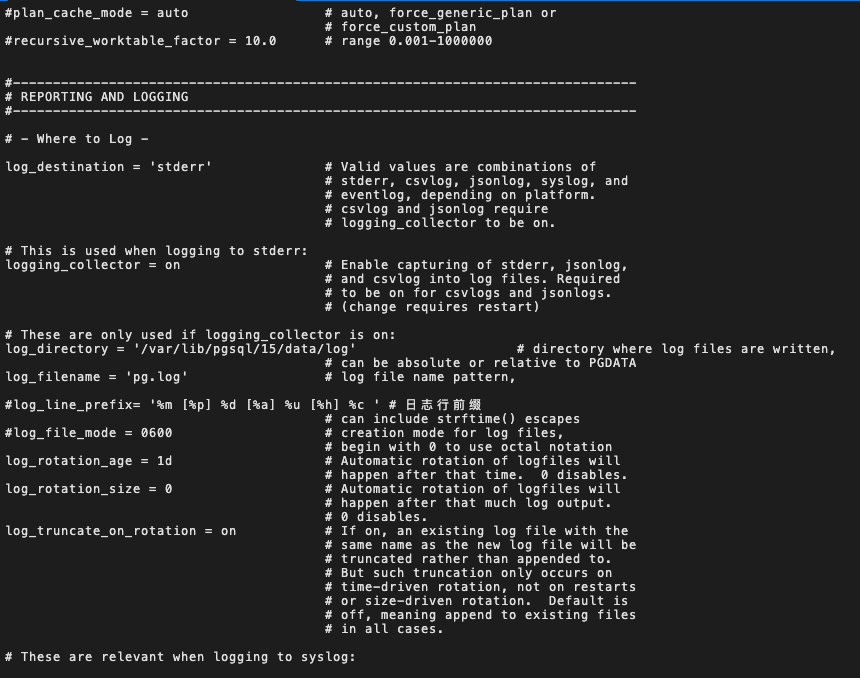
PostgreSQL 采集器开启日志采集
PostgreSQL 采集器默认是未开启日志采集功能,可在 conf.d/db/postgresql.conf 中将 files 打开,并写入 PostgreSQL 日志文件的绝对路径。在 [inputs.postgresql.log] 模块下开启日志采集器配置,如下:
[[inputs.postgresql]]

  ...

  [inputs.postgresql.log]
  files = ["/tmp/pgsql/postgresql.log"]
  multiline_match = '''^\S'''
  auto_multiline_detection = true
  auto_multiline_extra_patterns = []
日志 Pipeline 切割
Pipelines 是一种运行在 DataKit 上的轻量级脚本语言,用于对采集到的数据进行自定义解析和修改。通过定义解析规则,它们能够将不同种类的数据细粒度地切割并转换为结构化的格式,以满足具体的数据管理需求。以下是使用pipeline新建规则对日志原文进行切割的步骤:
在观测云工作空间「日志 > Pipelines」,点击「新建 Pipeline」,在新建 Pipeline 页面,可以先过滤出想要进行文本处理的「数据范围」,然后再定义「解析规则」,若想要测试输入的解析规则是否正确有效,可以在「样本解析」测试输入对应的数据进行测试,测试通过后点击「保存」即可创建 Pipeline 文件。
pipeline 规则:
add_pattern("application_name", "\\[\\w+ \\d+ - DB:\\w+\\]")
grok(_, '%{TIMESTAMP_ISO8601:time} %{NOTSPACE:timezone} \\[%{NOTSPACE:process_id}\\] %{NOTSPACE:db_name} %{application_name:application_name} %{NOTSPACE:user} \\[%{NOTSPACE:localhost}\\] %{NOTSPACE:session_id} ')
default_time(time)       # 将 time 字段作为输出数据的时间戳
日志原文:
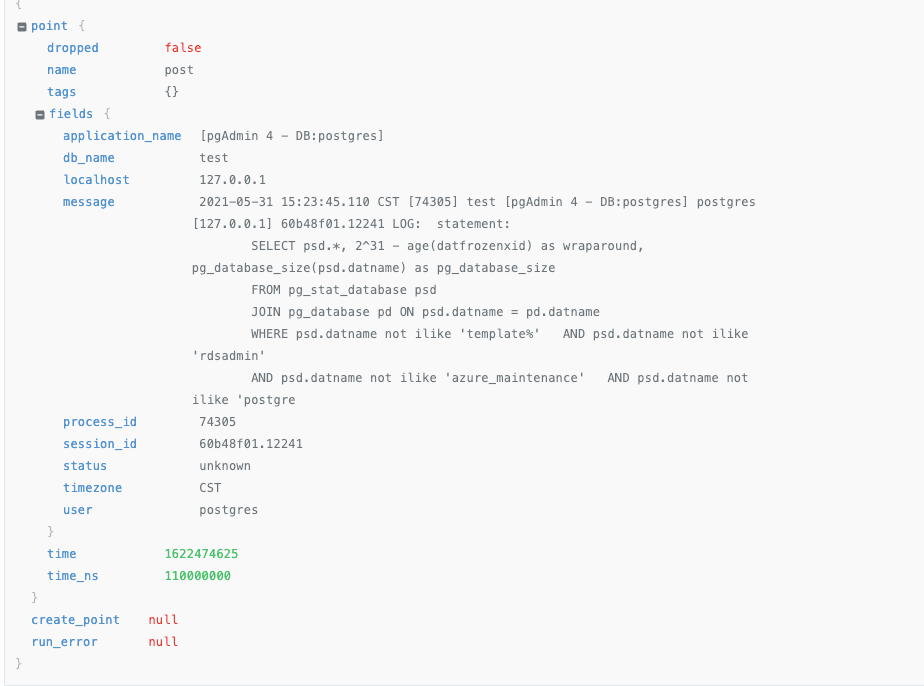
2021-05-31 15:23:45.110 CST [74305] test [pgAdmin 4 - DB:postgres] postgres [127.0.0.1] 60b48f01.12241 LOG:  statement:
        SELECT psd.*, 2^31 - age(datfrozenxid) as wraparound, pg_database_size(psd.datname) as pg_database_size
        FROM pg_stat_database psd
        JOIN pg_database pd ON psd.datname = pd.datname
        WHERE psd.datname not ilike 'template%'   AND psd.datname not ilike 'rdsadmin'
        AND psd.datname not ilike 'azure_maintenance'   AND psd.datname not ilike 'postgres'
切割效果:
PostgreSQL 采集器完整配置
# {"version": "1.34.0", "desc": "do NOT edit this line"}

[[inputs.postgresql]]
  ## Server address
  # URI format
  # postgres://[datakit[:PASSWORD]]@localhost[/dbname]?sslmode=[disable|verify-ca|verify-full]
  # or simple string
  # host=localhost user=pqgotest password=... sslmode=... dbname=app_production

  address = "postgres://datakit:datakit@localhost/mydb?sslmode=disable"

  ## Ignore databases which are gathered. Do not use with 'databases' option.
  #
  # ignored_databases = ["db1"]

  ## Specify the list of the databases to be gathered. Do not use with the 'ignored_databases' option.
  #
  # databases = ["db1"]

  ## Specify the name used as the "server" tag.
  #
  # outputaddress = "db01"

  ## Collect interval
  # Time unit: "ns", "us" (or "µs"), "ms", "s", "m", "h"
  #
  interval = "10s"

  ## Relations config
  # The list of relations/tables can be specified to track per-relation metrics. To collect relation
  # relation_name refer to the name of a relation, either relation_name or relation_regex must be set.
  # relation_regex is a regex rule, only takes effect when relation_name is not set.
  # schemas used for filtering, ignore this field when it is empty
  # relkind can be a list of the following options:
  #   r(ordinary table), i(index), S(sequence), t(TOAST table), p(partitioned table),
  #   m(materialized view), c(composite type), f(foreign table)
  #
[[inputs.postgresql.relations]]
  #relation_name = "products"
  relation_regex = ".*"
  schemas = ["public"]
  relkind = ["r", "p"]

  ## Set true to enable election
  election = true

  ## Run a custom SQL query and collect corresponding metrics.
  #
  # [[inputs.postgresql.custom_queries]]
  #   sql = '''
  #     select datname,numbackends,blks_read
  #     from pg_stat_database
  #     limit 10
  #   '''
  #   metric = "postgresql_custom_stat"
  #   tags = ["datname" ]
  #   fields = ["numbackends", "blks_read"]

  ## Log collection
  #
  [inputs.postgresql.log]
  files = ["/var/lib/pgsql/15/data/log/*.log"]
  # pipeline = "postgresql.p"
  multiline_match = '''^\S'''
  auto_multiline_detection = true
  auto_multiline_extra_patterns = []
  ## Custom tags
  #
  [inputs.postgresql.tags]
   server = "pgsql"
  # more_tag = "some_other_value"
  # ...
重启 Datakit
Datakit 配置调整完成后,需要重启才能生效。
datakit service -R监控视图
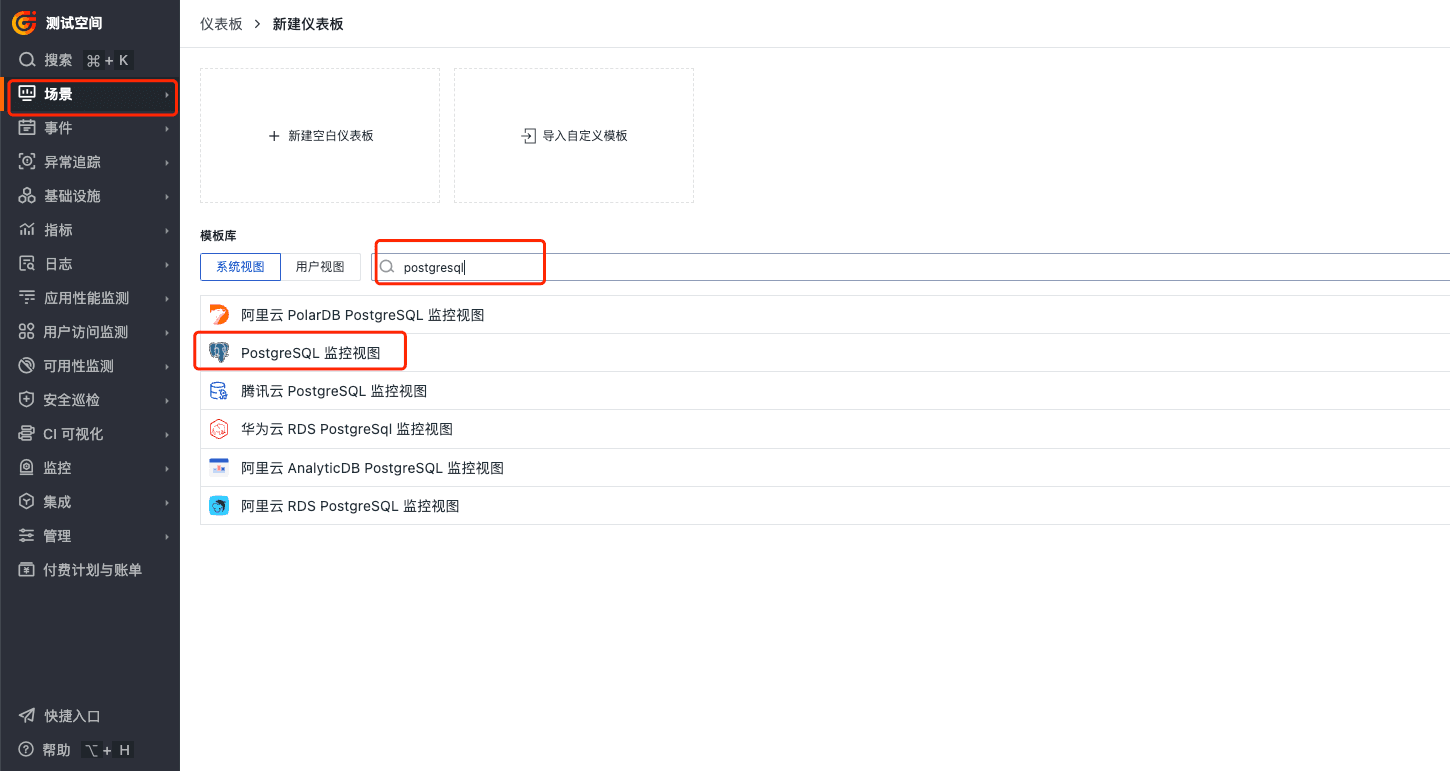
登录观测云控制台,点击「场景」 -「新建仪表板」,输入 " PostgreSQL ", 选择" PostgreSQL 监控视图 ",点击"确定"。
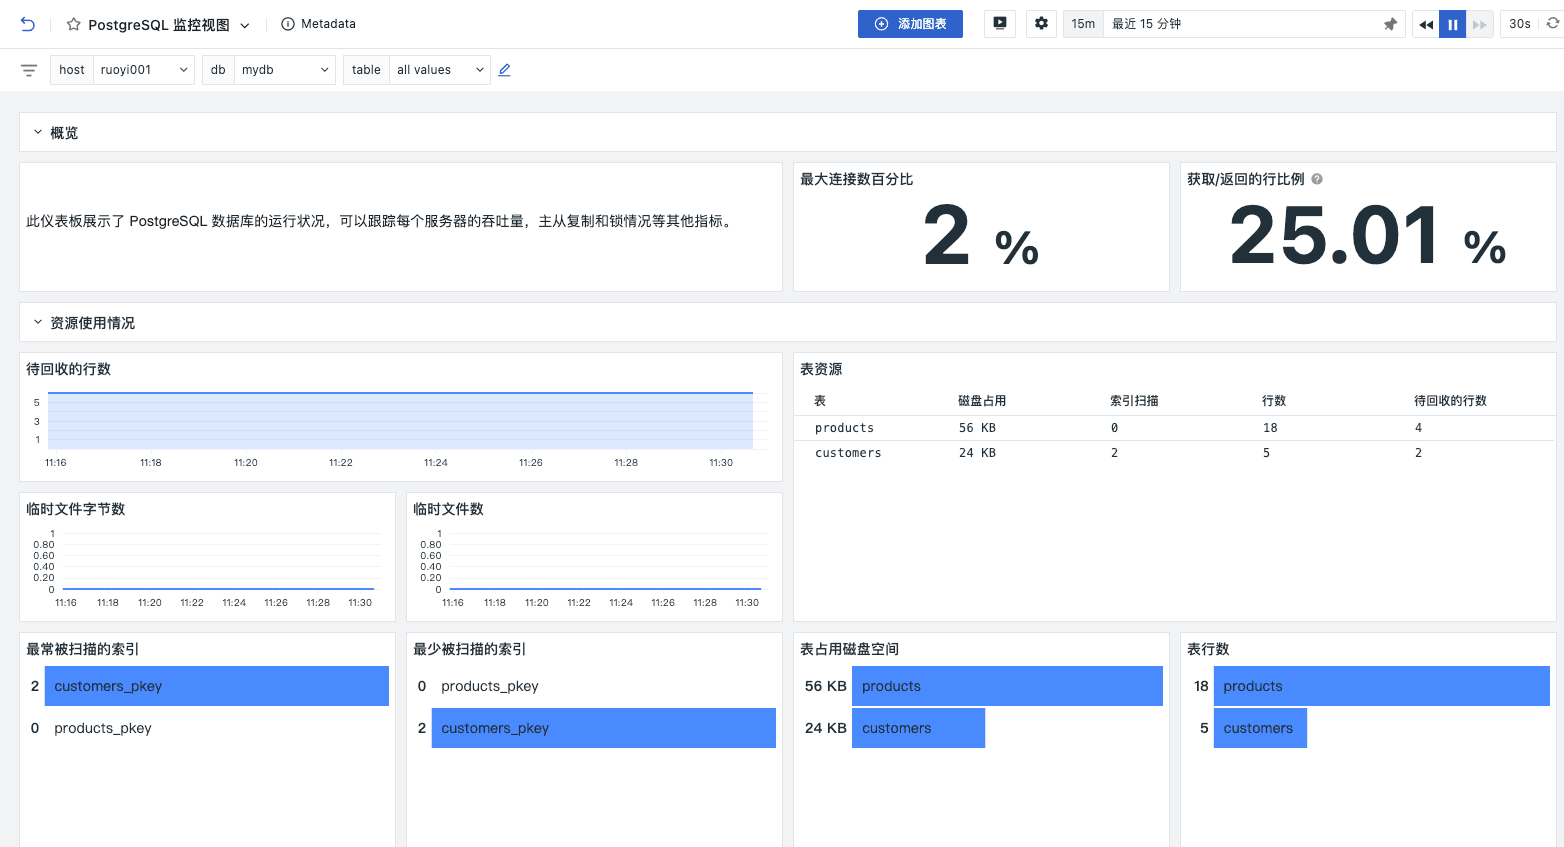
关键指标
| 序号 | 指标名称 | 指标描述 | 类型 |
|---|---|---|---|
| 1 | numbackends | The number of active connections to this database.当前数据库的活动连接数 | int |
| 2 | max_connections | The maximum number of client connections allowed to this database.允许连接到此数据库的最大客户端连接数 | float |
| 3 | percent_usage_connections | The number of connections to this database as a fraction of the maximum number of allowed connections.当前连接数占最大允许连接数的百分比 | float |
| 4 | active_time | Time spent executing SQL statements in this database, in milliseconds.在此数据库中执行 SQL 语句的时间 | float |
| 5 | blks_hit | Number of times disk blocks were found already in the SLRU (simple least-recently-used.)在 SLRU 缓存中找到已存在磁盘块的次数 |
int |
| 6 | blks_read | Number of disk blocks read for this SLRU (simple least-recently-used) cache. SLRU caches are created with a fixed number of pages.为 SLRU 缓存读取的磁盘块数量 |
int |
| 7 | deadlocks | The number of deadlocks detected in this database.此数据库中检测到的死锁数量 | int |
| 8 | sessions | Total number of sessions established to this database.与此数据库建立的会话总数 | int |
| 9 | idx_scan | The number of index scans initiated on this table, tagged by index.对该表发起的索引扫描次数 | int |
| 10 | seq_scan | The number of sequential scans initiated on this table.对该表发起的顺序扫描次数 | int |
| 11 | n_live_tup | The estimated number of live rows.估计的活跃行数 | int |
| 12 | n_dead_tup | The estimated number of dead rows.估计的死行数 | int |
| 13 | temp_bytes | The amount of data written to temporary files by queries in this database.查询在此数据库中写入临时文件的数据量 | int |
| 14 | xact_commit | The number of transactions that have been committed in this database.此数据库中已提交的事务数量 | int |
| 15 | xact_rollback | The number of transactions that have been rolled back in this database.此数据库中已回滚的事务数量 | int |
| 16 | tup_inserted | The number of rows inserted by queries in this database.查询在此数据库中插入的行数 | int |
| 17 | tup_updated | The number of rows updated by queries in this database.查询在此数据库中更新的行数 | int |
| 18 | tup_deleted | The number of rows deleted by queries in this database.查询在此数据库中删除的行数 | int |
缓存
通过对 blks_hit 和 blks_read 这两个关键指标的详细监控和分析,用户可以全面了解 PostgreSQL 数据库的缓存命中率和磁盘 I/O 性能。
blks_hit指标记录了在 SLRU 缓存中成功命中的磁盘块数量,高的blks_hit值表示大部分数据请求能够直接从缓存中获取,减少了磁盘 I/O 操作,从而提升了数据库的整体性能和响应速度blks_read指标记录了从 SLRU 缓存中未命中时,从磁盘实际读取的磁盘块数量,高的blks_read值意味着频繁的磁盘读取操作,可能导致响应时间延长和吞吐量下降
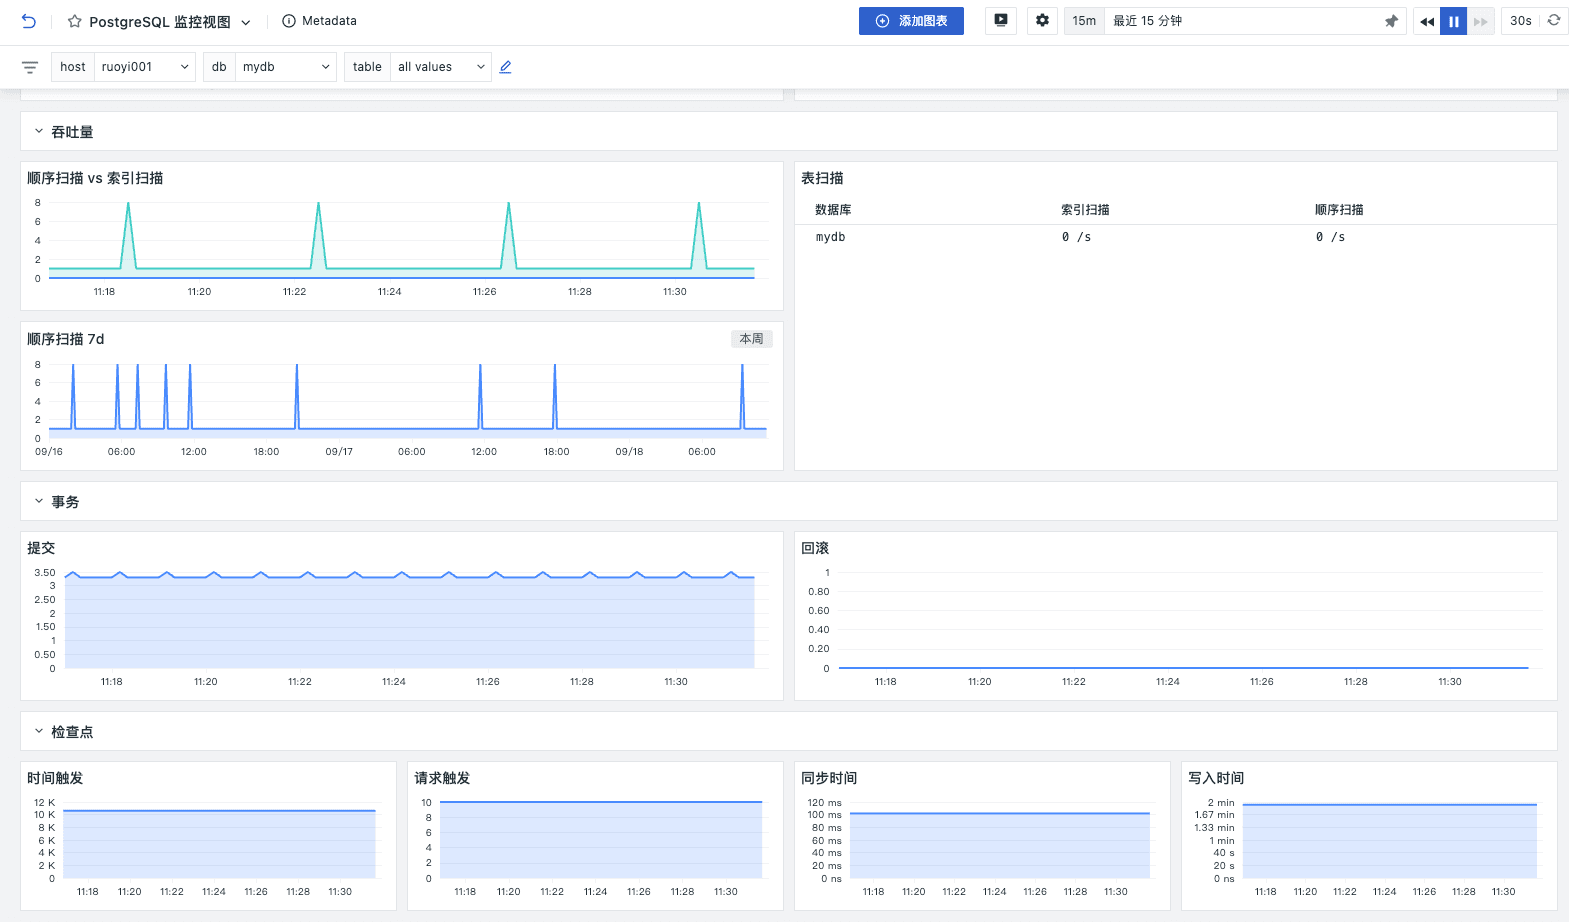
事物活动
xact_commit 和 xact_rollback 这两个关键指标在监控数据库事务活动、评估系统稳定性和优化性能方面有很大作用。
xact_commit指标记录了在指定时间段内,成功提交到数据库中的事务总数,通过这个指标可以了解业务的吞吐量,评估数据库的使用状况,较高的提交事务数表示数据库正在处理大量的操作- xact_rollback指标记录了在指定时间段内,因各种原因未能成功提交并被回滚的事务总数。高的回滚次数可能反映出系统存在潜在问题,如应用程序逻辑错误、数据一致性问题或并发事务冲突
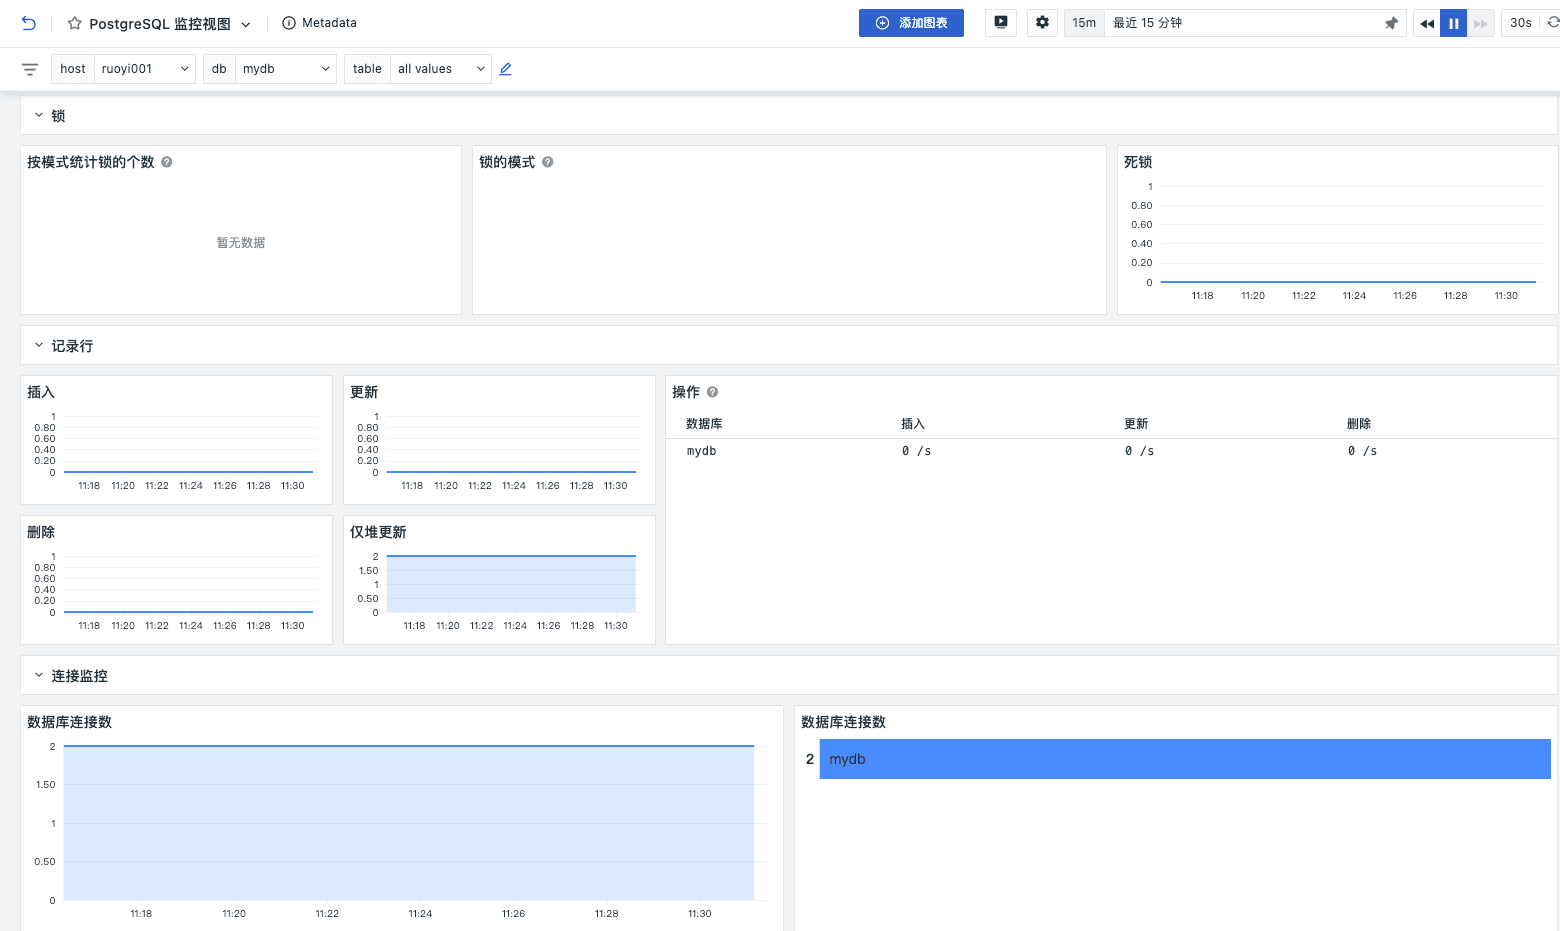
死锁
dealocks 指标记录了在指定时间段内,数据库中检测到的死锁事件总数,死锁事件的频繁发生会导致部分事务无法完成,进而影响整体数据库的稳定性和可靠性。
行数变动
tup_inserted:插入的行数。tup_updated:更新的行数。tup_deleted:删除的行数。
这些指标反映了数据库中新增数据的速率和量级、变更的频率和规模、数据清理的情况和频率,读取的负载和查询效率等。这些指标反映了数据库的操作量,识别哪些业务功能最为活跃,以及业务高峰期的数据库需求,从而进行更精准的资源分配和优化有助于了解业务负载及其对数据库的影响,辅助容量规划和性能优化。
监控器
观测云拥有强大的异常监测能力,不仅提供了包括 Docker、Elasticsearch、Host 等一系列监控模板,还支持自定义监控器。通过监控器配置数据指标检测,从而即时触发告警事件,配合告警通知功能,可及时发现帮助您快速发现问题、定位问题、解决问题。
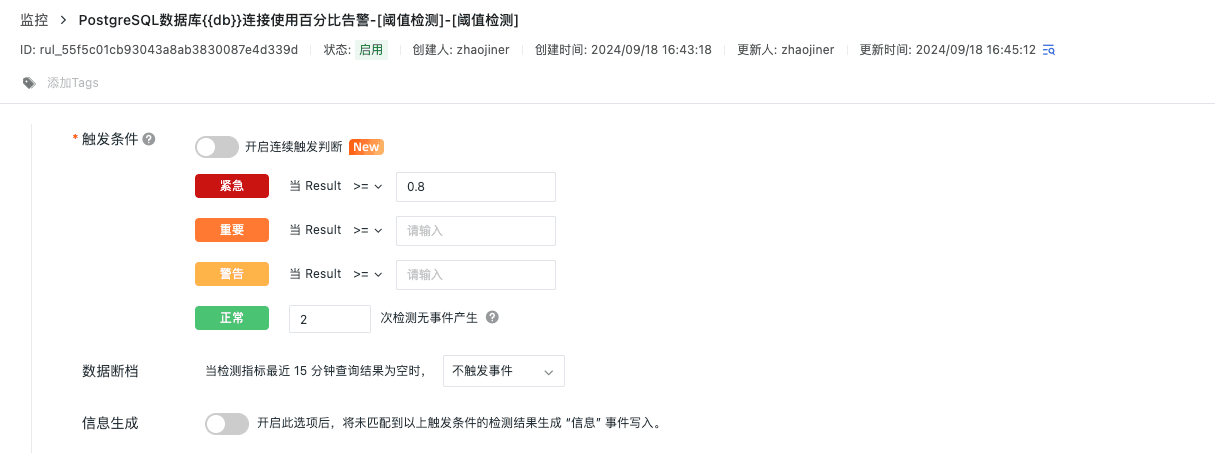
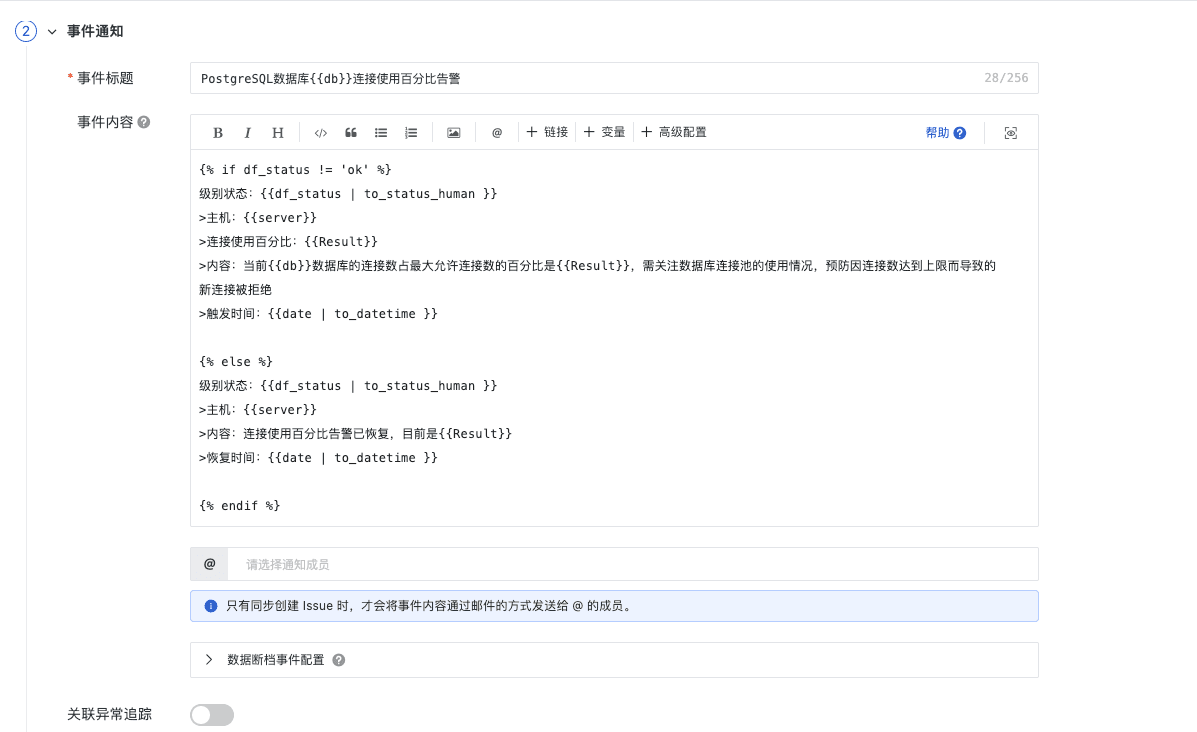
连接使用率告警
如果 PostgreSQL 连接使用率过高,可能会导致新的连接请求被拒绝,从而影响到应用程序的正常运行。告警可以在连接数接近数据库最大连接数之前,能够采取相应措施,比如增加数据库连接数限制、优化应用程序的连接使用策略或扩展硬件资源,以避免性能瓶颈和潜在的服务中断。

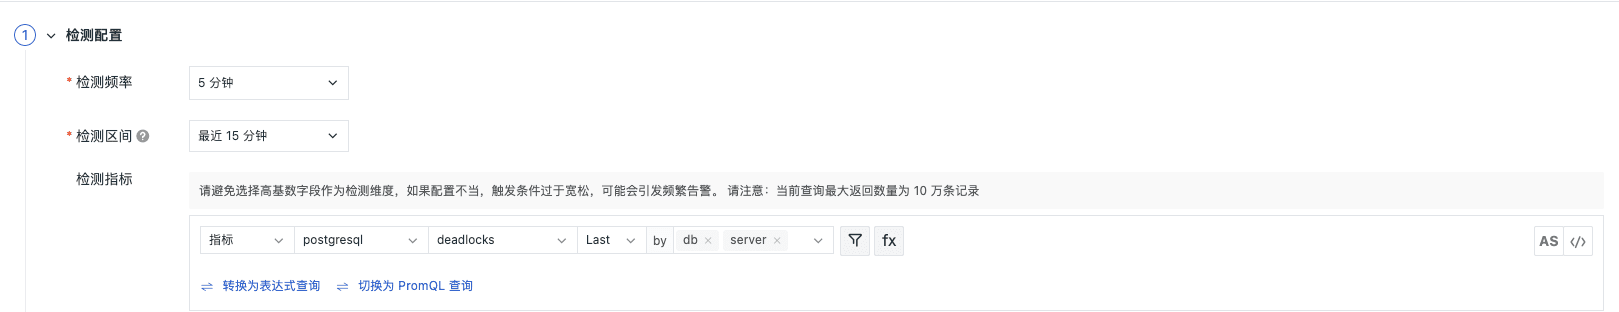
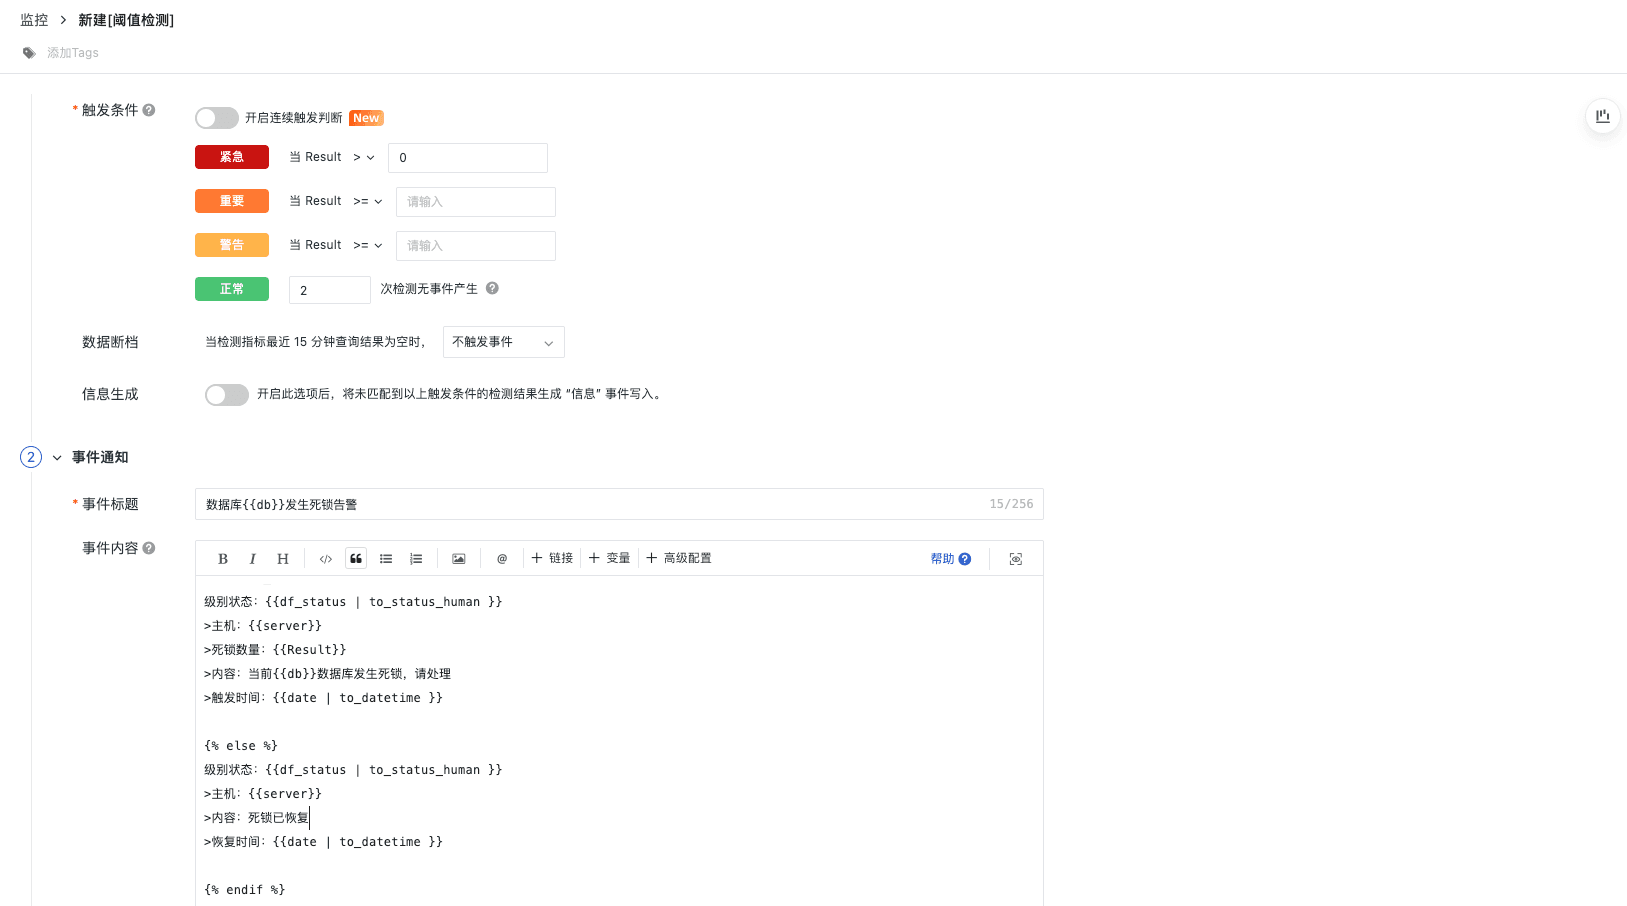
死锁数监控
死锁事件的频繁发生会导致部分事务无法完成,进而影响整体数据库的稳定性和可靠性。
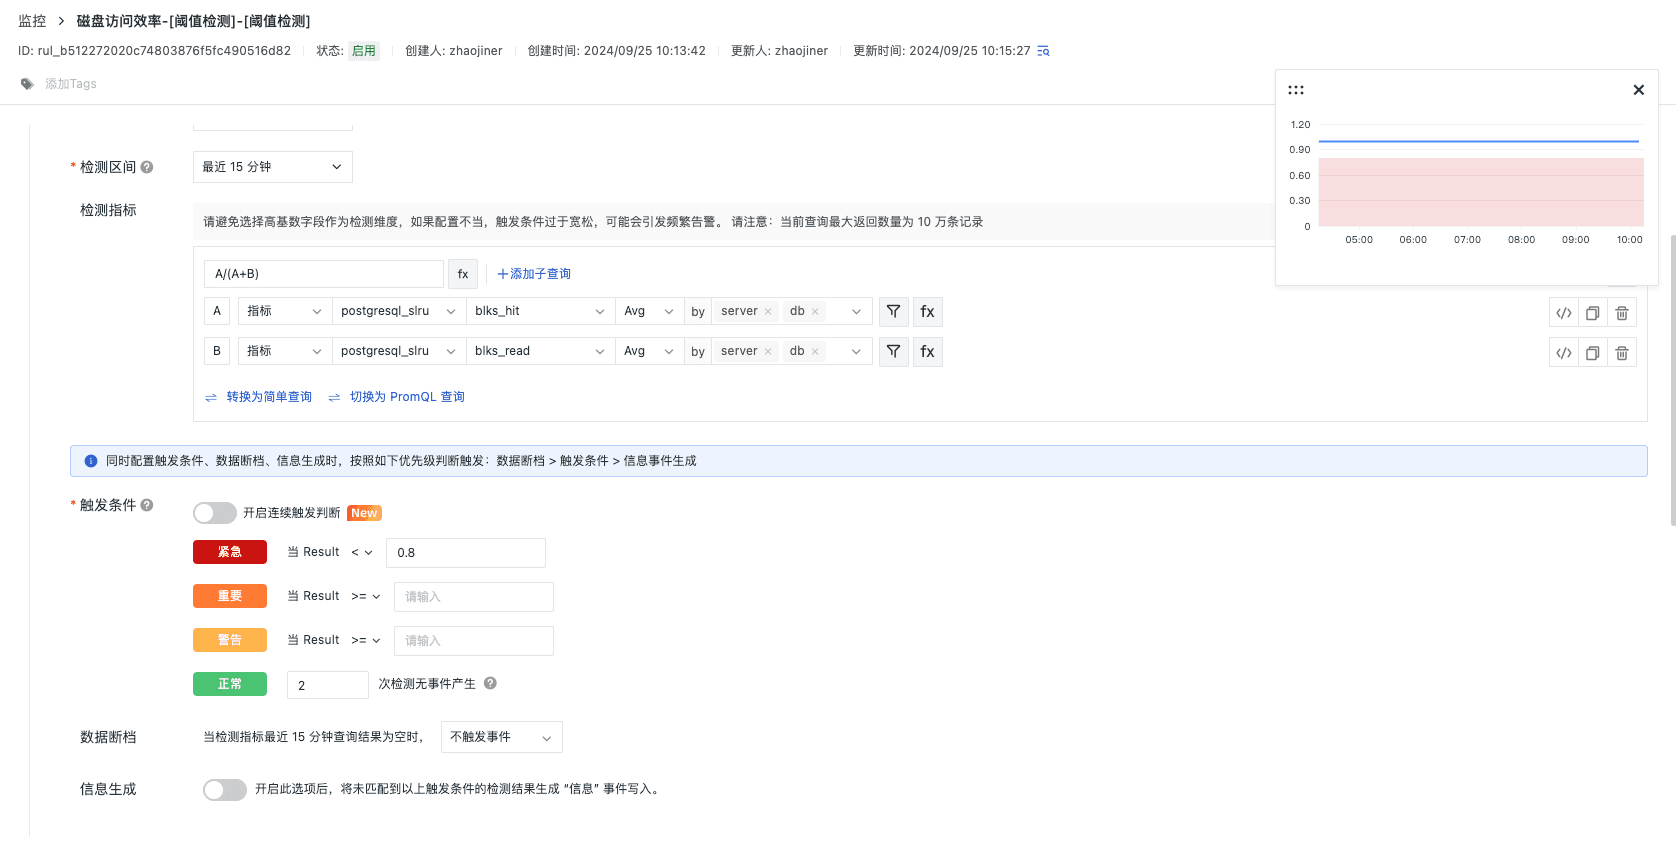
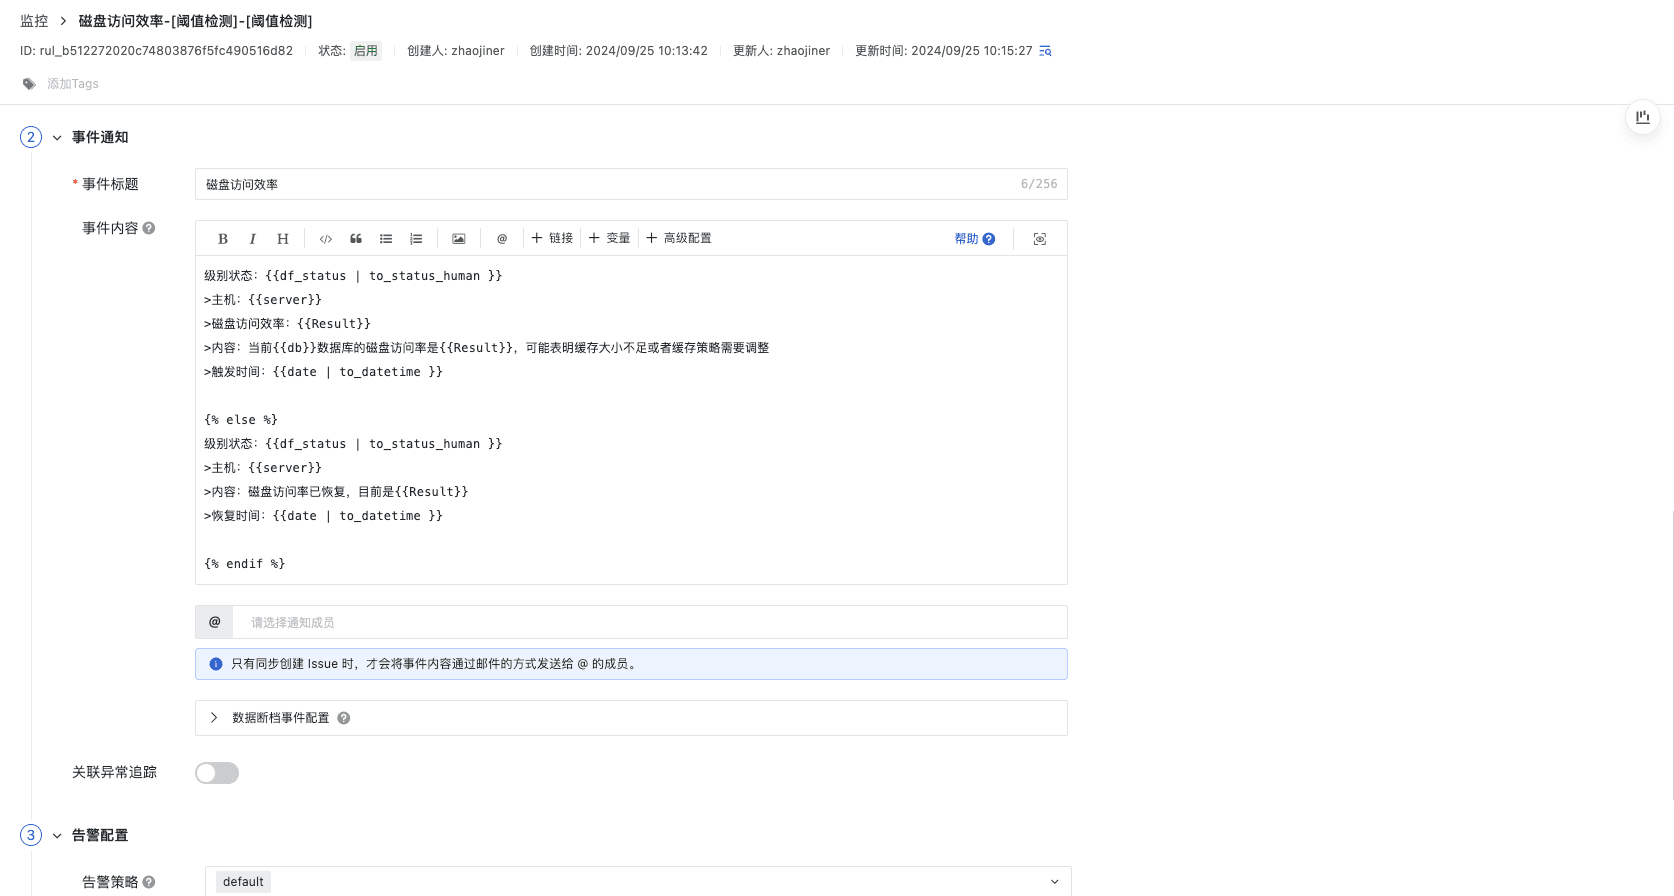
磁盘访问效率告警
使用 blks_hit 和 blks_read ,我们可以计算缓存命中率,这是衡量缓存效率的一个重要指标。缓存命中率指的是从缓存中获取数据块的操作占所有数据块获取操作(包括从磁盘读取和从缓存获取)的比例。
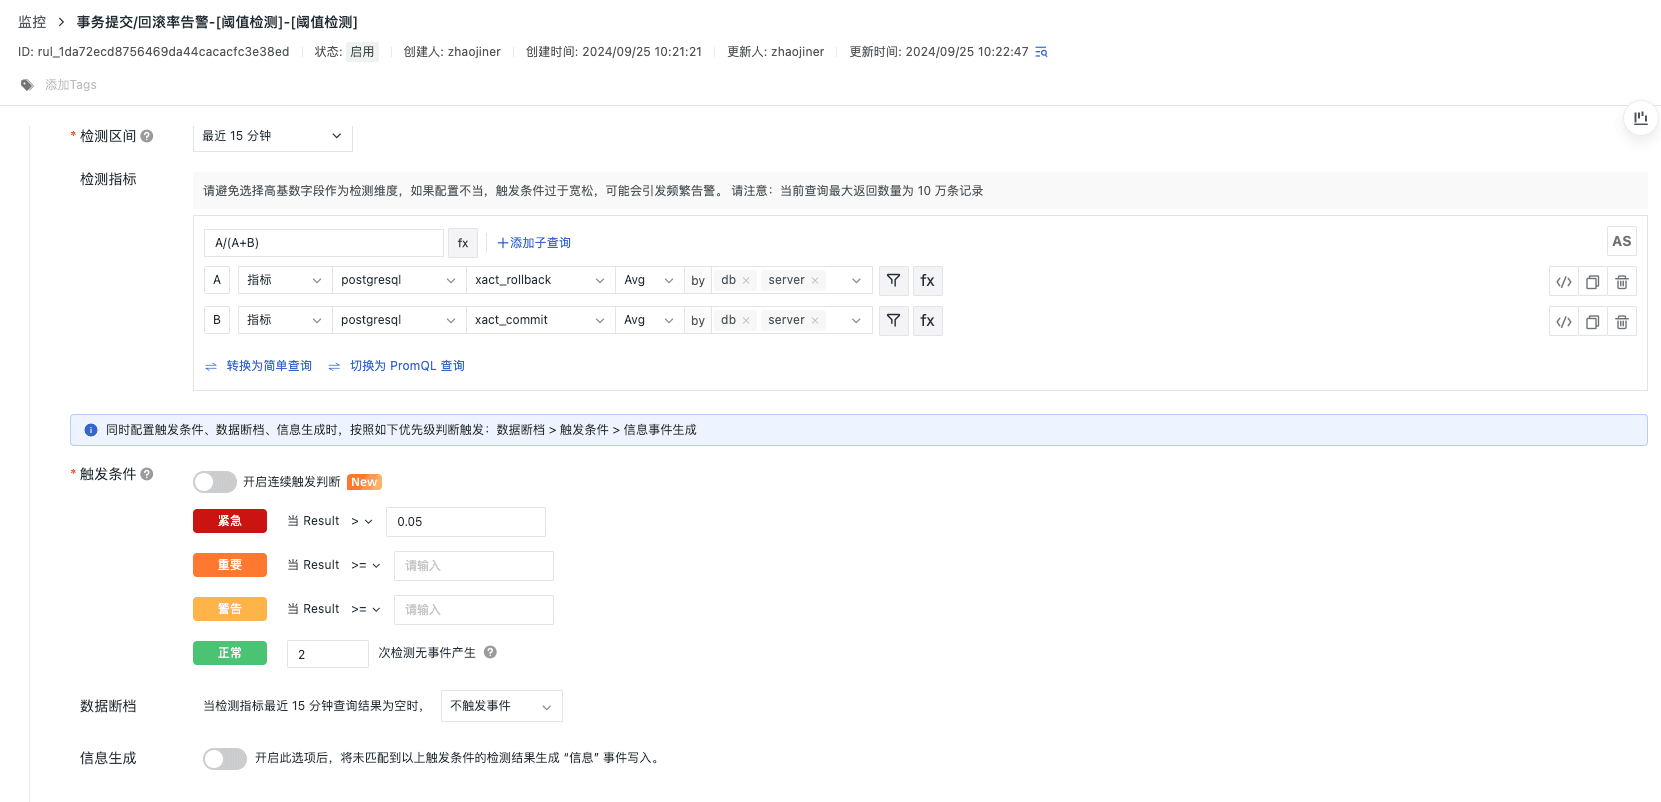
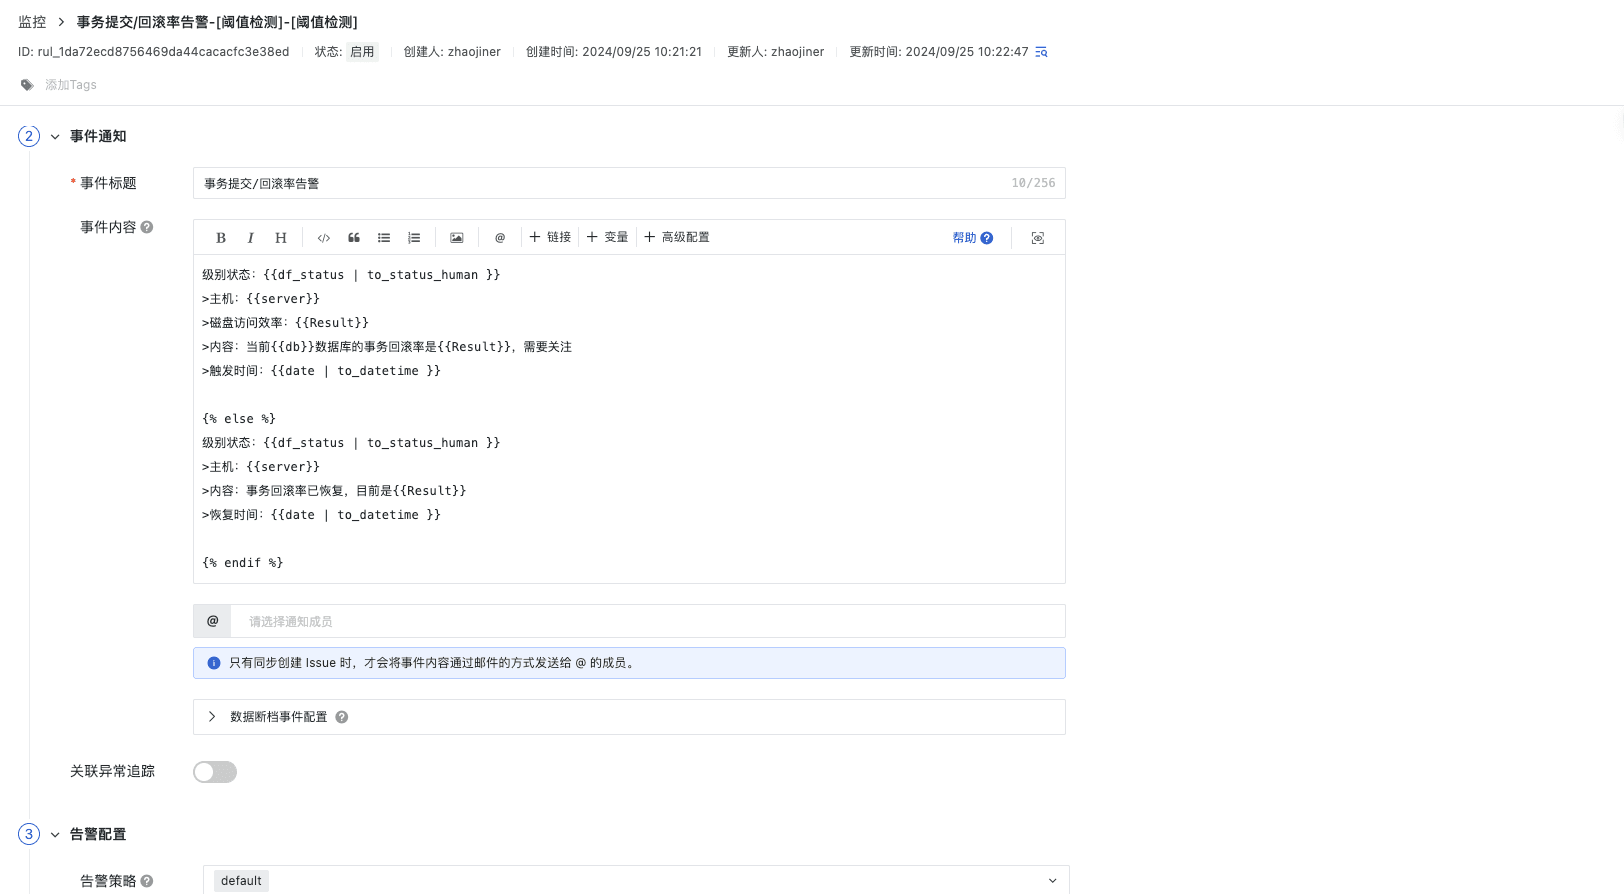
事物提交/回滚告警
事务提交/回滚率告警和磁盘块访问效率告警,关注数据库事务的健康和数据库读取效率
总结
观测云监控工具为 PostgreSQL 数据库提供全面的性能监控与管理解决方案,能够实时收集和分析关键性能指标和系统日志,可以确保数据库的稳定运行和高效性能。通过整合和分析来自不同来源的数据,观测云使得数据库管理更加智能化和自动化。