一.基础绘图
- 折线图plot
- 散点图scatter
- 柱状图bar
- 饼图pie
二.图表设置
- 设置标题
- 设置线条
- 设置坐标轴
- 添加图例
- 添加注释
- 设置画布大小与分辨率
三.高级功能
- 绘制子图
- 保存图形
一.基础绘图
1.折线图plot
python
import matplotlib.pyplot as plt
x = [1, 2, 3, 4, 5]
y = [2, 3, 5, 7, 11]
plt.plot(x, y)
plt.show()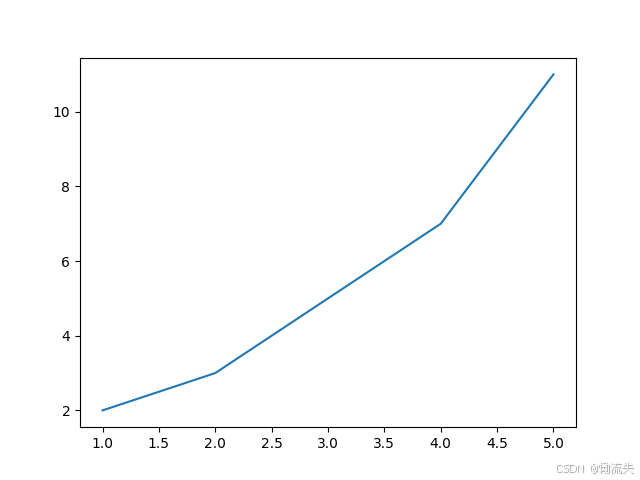
2.散点图scatter
python
import matplotlib.pyplot as plt
x = [1, 2, 3, 4, 5]
y = [2, 3, 5, 7, 11]
plt.scatter(x, y)
plt.show()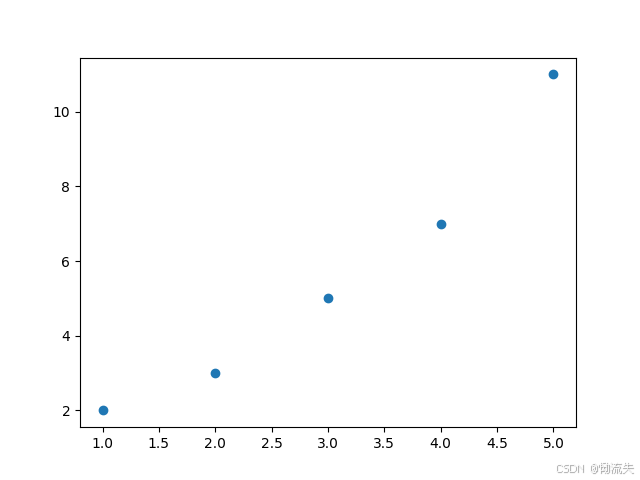
3.柱状图bar
python
import matplotlib.pyplot as plt
x = [1, 2, 3, 4, 5]
y = [2, 3, 5, 7, 11]
plt.bar(x, y)
plt.show()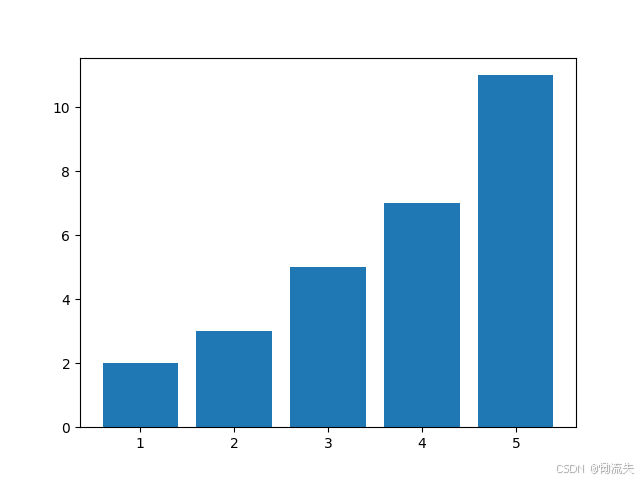
4.饼图pie
python
import matplotlib.pyplot as plt
x = [1, 2, 3, 4, 5]
y = [2, 3, 5, 7, 11]
plt.pie(y, labels=x)
plt.show()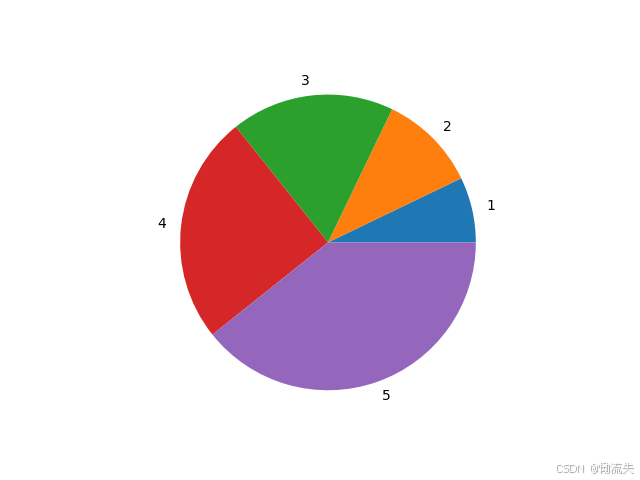
二.图表设置(以下案例以折线图为例)
1.设置标题
语法格式:plt.title("图标签名",大小,粗细,颜色,位置)
python
import matplotlib.pyplot as plt
plt.rcParams['font.sans-serif'] = ['SimHei']
plt.rcParams['axes.unicode_minus'] = False
x = [1, 2, 3, 4, 5]
y = [2, 3, 5, 7, 11]
plt.plot(x, y)
plt.title("折线例图", fontsize=24, fontweight='bold', color='blue',loc="center")  #
plt.show()
2.设置线条
语法格式:plt.plot(x,y,线条形式,线条宽度,节点标记,节点标记大小,透明度,颜色)
在plt.plot()中可以设置以下参数
- color:设置线条颜色
- linestyle:设置线条形式
- marker:设置节点标记
- alpha:线条透明度
- marksize:节点标记的大小
- linewidth:设置线条粗细
python
import matplotlib.pyplot as plt
plt.rcParams['font.sans-serif'] = ['SimHei']
plt.rcParams['axes.unicode_minus'] = False
x = [1, 2, 3, 4, 5]
y = [2, 3, 5, 7, 11]
plt.plot(x, y, color='red', linestyle='--', marker='o',alpha=0.7, markersize=10, linewidth=2)  #
plt.title("折线例图")
plt.show()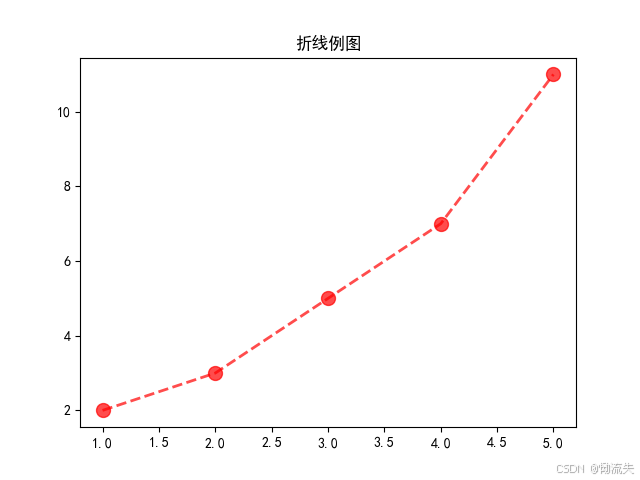
3.设置坐标轴
1.设置刻度与标签
1.xlabel/ylabel:表示x/y轴的标签设置
语法格式:plt.xlabel("x轴",字体大小,粗细,样式)
- fontsize:表示标签的字体大小
- fontweight:表示字体的粗细
-
'light':细体 -
'normal'或'regular':正常体 -
'medium':中等粗细 -
'semibold'或'demibold':半粗体 -
'bold':粗体 -
'heavy':特粗体 -
'extra bold':额外粗体 -
'black':极粗体
- fontname:表示字体样式
2.xticks/yticks:表示x/y轴的刻度设置
语法格式:plt.xticks(点位,点位标签,旋转角度,字体大小,粗细,颜色,水平,垂直)
- ticks:表示画刻度的点位
- labels:表示刻度的对应点位的标签
- rotation:旋转角度
- fontsize:字体大小
- color:字体颜色
- fontweight:字体粗细
- ha:字体水平对齐方式有left,right,center
- va:字体垂直对齐方式有center,top,bottom,baseline
python
import matplotlib.pyplot as plt
plt.rcParams['font.sans-serif'] = ['SimHei']
plt.rcParams['axes.unicode_minus'] = False
x = [1, 2, 3, 4, 5]
y = [2, 3, 5, 7, 11]
plt.plot(x, y)
plt.xlabel('x轴', fontsize=10, fontweight='bold', fontname='SimHei')
plt.ylabel('y轴', fontsize=10, fontweight='bold', fontname='SimHei')
plt.xticks(ticks=x,labels=['a','b','c','d','e'], rotation=0, fontsize=12, fontweight='bold', ha='right', va='center')
plt.yticks(y, rotation=0, fontsize=12, fontweight='bold', ha='right', va='center')
plt.show()
2. 设置坐标轴范围
语法格式:plt.xlim()
python
import matplotlib.pyplot as plt
# 设置字体和负号显示
plt.rcParams['font.sans-serif'] = ['SimHei']
plt.rcParams['axes.unicode_minus'] = False
# 绘制一条简单的线
x = [0, 1, 2, 3, 4]
y = [0, 1, 4, 9, 16]
plt.plot(x, y)
plt.xlim(0, 6)
plt.ylim(0, 12)
plt.show()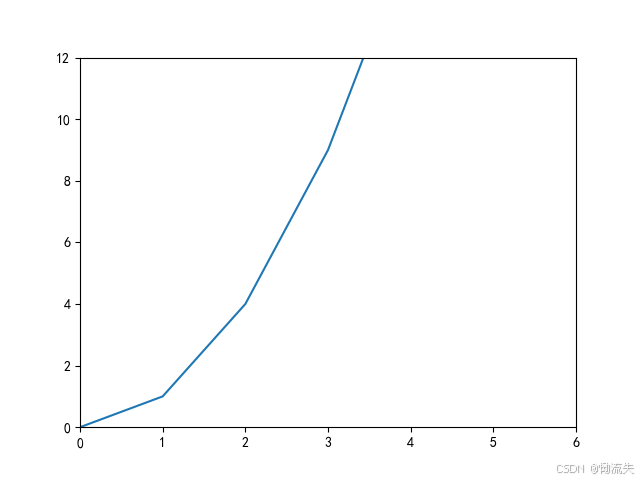
3.设置网格线
python
import matplotlib.pyplot as plt
# 设置字体和负号显示
plt.rcParams['font.sans-serif'] = ['SimHei']
plt.rcParams['axes.unicode_minus'] = False
# 绘制一条简单的线
x = [0, 1, 2, 3, 4]
y = [0, 1, 4, 9, 16]
plt.plot(x, y)
plt.xlim(0, 6)
plt.ylim(0, 12)
plt.grid(True)
plt.show()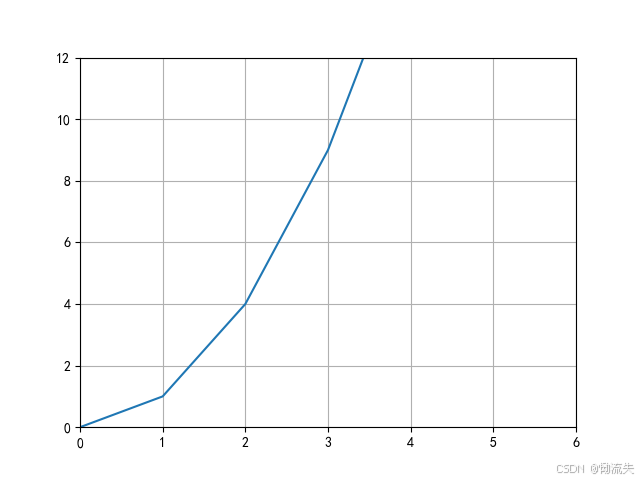
4.添加图例
在绘制图表时,可以通过在plt.plot()函数中添加label参数来设置图例的标签,然后使用plt.legend()来显示图例。
python
import matplotlib.pyplot as plt
plt.rcParams['font.sans-serif'] = ['SimHei']
plt.rcParams['axes.unicode_minus'] = False
x = [1, 2, 3, 4, 5]
y = [2, 3, 5, 7, 11]
plt.plot(x, y,label="折线图")
plt.legend(loc="best")
plt.show()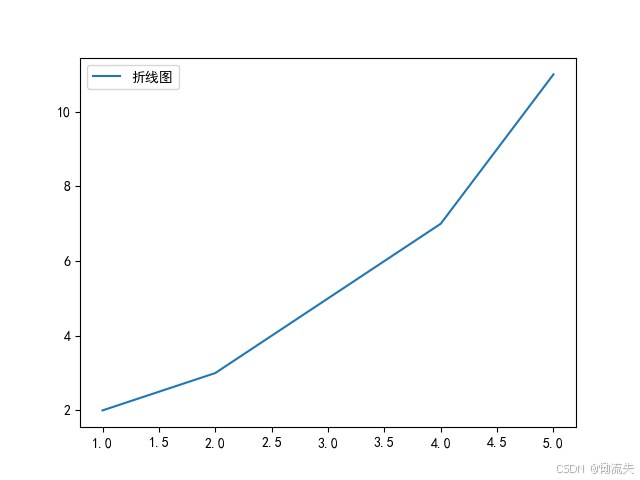
5.添加注释
添加注释通常使用annotate方法,该方法允许你在图表中的指定位置添加文本注释,并可以附加箭头等指示
语法格式:plt.annotate(注释,注释指向位置,注释起点位置)
- xy:注释指向位置
- xytext:注释起点位置
python
import matplotlib.pyplot as plt

# 设置字体和负号显示
plt.rcParams['font.sans-serif'] = ['SimHei']
plt.rcParams['axes.unicode_minus'] = False

# 绘制一条简单的线
x = [0, 1, 2, 3, 4]
y = [0, 1, 4, 9, 16]
plt.plot(x, y)

# 添加注释
plt.annotate('这是一个点', xy=(2, 4), xytext=(3, 6),
             arrowprops=dict(facecolor='black', shrink=0.05),
             horizontalalignment='left', verticalalignment='bottom')

# 对每个点添加注释,避免嵌套循环
for i in range(len(x)):
    # 调整注释位置以避免覆盖数据点
    if i == 0:  # 第一个点可能需要特殊处理以避免在y轴上重叠
        xytext = (x[i] + 0.1, y[i] - 0.7)
    elif i == len(x) - 1:  # 最后一个点避免在x轴上重叠
        xytext = (x[i]-0.5,y[i]-1)
    else:
        xytext = (x[i] + 0.1, y[i] + 0.1)
    plt.annotate(f"({x[i]},{y[i]})",xy=(x[i], y[i]), xytext=xytext,
                 horizontalalignment='left', verticalalignment='bottom')
plt.show()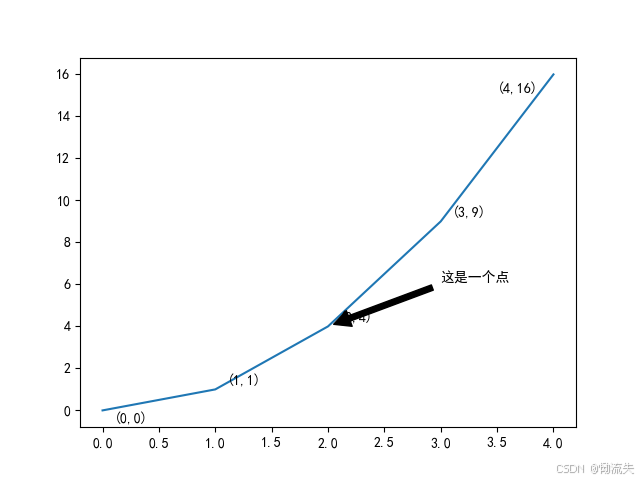
6.设置画布大小与分辨率
python
import matplotlib.pyplot as plt
# 设置字体和负号显示
plt.rcParams['font.sans-serif'] = ['SimHei']
plt.rcParams['axes.unicode_minus'] = False
# 绘制一条简单的线
x = [0, 1, 2, 3, 4]
y = [0, 1, 4, 9, 16]
plt.plot(x, y)
plt.figure(figsize=(8, 6), dpi=100)
plt.show()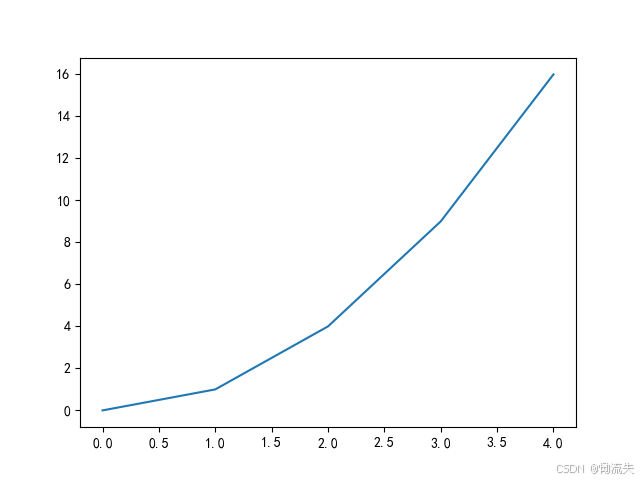
三.高级功能
1.绘制子图
使用subplot()函数头,通长含有三个参数,subplot(2,2,1)表示绘制在第二行第二列,并在第一个图绘制
python
import matplotlib.pyplot as plt
# 设置字体和负号显示
plt.rcParams['font.sans-serif'] = ['SimHei']
plt.rcParams['axes.unicode_minus'] = False
# 绘制一条简单的线
x = [0, 1, 2, 3, 4]
y = [0, 1, 4, 9, 16]
plt.subplot(2, 1, 1)  # 两行一列的第一个子图
plt.plot(x, y)
plt.subplot(2, 1, 2)  # 两行一列的第二个子图
plt.scatter(x, y)
plt.tight_layout()  # 自动调整子图间距
plt.show()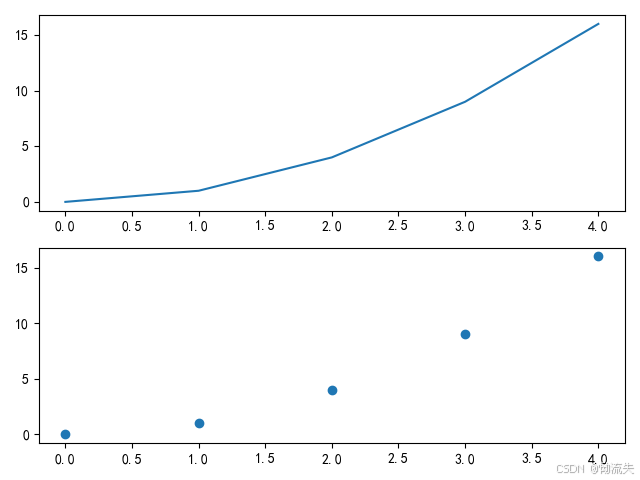
优化
使用plt.figure()可以生成不同的画布,从而实现一个程序跑出多个图片
通过使用subplots与flatten函数可以一次生成取出多个子图
python
import matplotlib.pyplot as plt
plt.rcParams['font.sans-serif'] = ['SimHei']
plt.rcParams['axes.unicode_minus'] = False
plt.figure(1)#画布1
plt.plot([1,2,3],[1,2,3])
"优化代码,使用subplots一次性生成多个子图"
fig, axes = plt.subplots(nrows=2, ncols=2, sharex=True, sharey=True, figsize=(10,8))
ax1,ax2,ax3,ax4=axes.flatten()
ax1.plot([1,2,3],[1,2,3])
#修改子图的名字和标签
ax1.set_title('子图1')
ax1.set_xlabel("紫日")
ax1.set_ylabel("假日")
#同理
ax2.bar([1,2,3],[1,2,3])
ax3.bar([1,2,3],[1,2,3])
ax4.bar([1,2,3],[1,2,3])
plt.show()

2.保存图形
语法格式:plt.savefig("名字")
保存的图片会存放在相同明命的文件路径下
python
import matplotlib.pyplot as plt
# 设置字体和负号显示
plt.rcParams['font.sans-serif'] = ['SimHei']
plt.rcParams['axes.unicode_minus'] = False
# 绘制一条简单的线
x = [0, 1, 2, 3, 4]
y = [0, 1, 4, 9, 16]
plt.plot(x, y)
plt.figure(figsize=(8, 6), dpi=100)
plt.savefig("my_plot.png")
plt.show()