#include "cwidget.h"
#include "qcustomplot.h"
#include <QtWidgets>
CWidget::CWidget(QWidget *parent)
: QWidget(parent)
{
initForm();
}
CWidget::~CWidget() {}
/*
* 1、每一条曲线都必须独占一个graph,新建graph可通过addGraph()来实现。
* 2、每一个QCustomPlot都有上下左右4个坐标轴,分别为customPlot->xAxis2、xAxis、yAxis、yAxis2。
* 每个轴可设置是否显示、是否显示刻度、几个刻度、刻度的值是否显示等。
*
* 功能:具备鼠标左键点击曲线,曲线高亮;
* 鼠标左键长按,可以拖拽图层;
* 鼠标滚轮滚动,可以缩放图层;
*/
void CWidget::initForm()
{
// 初始化窗口大小
this->resize(800, 600);
QVBoxLayout *m_mainLay = new QVBoxLayout(this);
customPlot = new QCustomPlot();
// 增加第一张图
customPlot->addGraph();
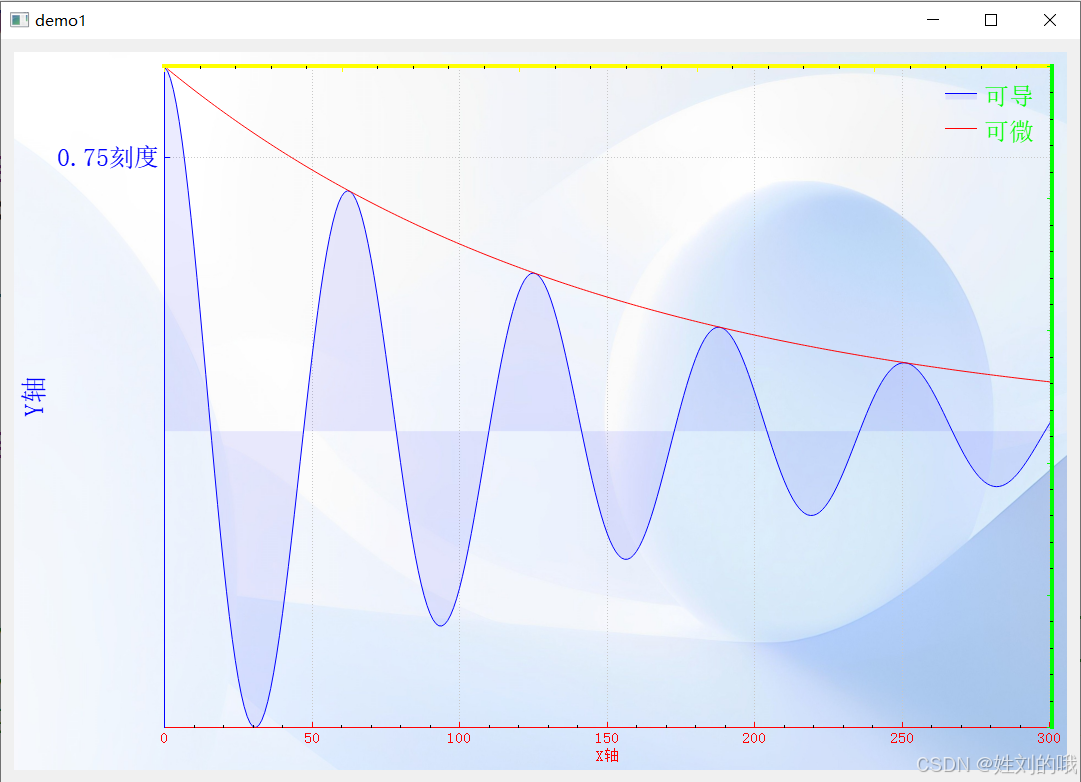
customPlot->graph(0)->setPen(QPen(Qt::blue)); // 曲线的颜色
customPlot->graph(0)->setBrush(QBrush(QColor(0, 0, 255, 20))); // 曲线与X轴包围区的颜色
// 增加第二张图
customPlot->addGraph();//添加graph等价于添加新曲线
customPlot->graph(1)->setPen(QPen(Qt::red)); // 曲线的颜色
// 生成模拟数据点 (x-y0 第一条曲线, x-y1为第2条曲线):
QVector<double> x(501), y0(501), y1(501);
for (int i=0; i<501; ++i)
{
x[i] = i;
y0[i] = qExp(-i/150.0)*qCos(i/10.0); // 第一条曲线:y0衰减cos
y1[i] = qExp(-i/150.0); // 第二条曲线:y1衰减指数
}
// 把已存在的数据填充进graph的数据区
customPlot->graph(0)->setData(x, y0);
customPlot->graph(1)->setData(x, y1);
// 自动调整XY轴的范围,以便显示出graph(0)中所有的点
customPlot->graph(0)->rescaleAxes();
// 自动调整XY轴的范围,以便显示出graph(1)中所有的点
customPlot->graph(1)->rescaleAxes(true);
// 在Y轴的0.75刻度位置添加标签 "0.75刻度"
selfDefTickLabel(customPlot, 0.75, "0.75刻度");
// 设置坐标轴
setCustomplotAxis(*customPlot);
// 设置背景颜色
setCustomplotBackground(customPlot);
// 设置背景图片
setCustomplotBackgroundImg(customPlot);
// 设置图例
setCustomplotLegend(customPlot);
// 支持鼠标拖拽轴的范围、滚动缩放轴的范围,左键点选图层(每条曲线独占一个图层)
// 设置基本坐标轴(左侧Y轴和下方X轴)可拖动、可缩放、曲线可选、legend可选、设置伸缩比例,使所有图例可见
customPlot->setInteractions(QCP::iRangeDrag|QCP::iRangeZoom| QCP::iSelectAxes | QCP::iSelectLegend | QCP::iSelectPlottables);
// 使上下两个X轴的范围总是相等,使左右两个Y轴的范围总是相等
connect(customPlot->xAxis, SIGNAL(rangeChanged(QCPRange)), customPlot->xAxis2, SLOT(setRange(QCPRange)));
connect(customPlot->yAxis, SIGNAL(rangeChanged(QCPRange)), customPlot->yAxis2, SLOT(setRange(QCPRange)));
// 立即刷新图像
customPlot->replot();
m_mainLay->addWidget(customPlot);
}
void CWidget::setCustomplotAxis(QCustomPlot &customplot)
{
customplot.xAxis2->setVisible(true); // 上轴需要显示
customplot.xAxis2->setTickLabels(false); // 上轴的刻度不要显示
customplot.yAxis2->setVisible(true); // 右轴需要显示
customplot.yAxis2->setTickLabels(false); // 右轴的刻度不要显示
customplot.xAxis->setLabel("X轴"); // 设置X轴标签
customplot.yAxis->setLabel("Y轴"); // 设置Y轴标签
// 设置X轴标签字体
QFont m_labelFont;
m_labelFont.setPointSize(16);
customplot.yAxis->setLabelFont(m_labelFont);
// 设置坐标轴范围
customplot.xAxis->setRange(0, 301);
// 设置下轴为红色,线宽为1
customplot.xAxis->setBasePen(QPen(Qt::red, 1));
// 设置左轴为蓝色,线宽为1
customplot.yAxis->setBasePen(QPen(Qt::blue, 1));
// 设置上轴为黄色,线宽为4
customplot.xAxis2->setBasePen(QPen(Qt::yellow, 4));
// 设置右轴为绿色,线宽为4
customplot.yAxis2->setBasePen(QPen(Qt::green, 4));
// 设置下轴刻度线的颜色(红色)
customplot.xAxis->setTickPen(QPen(Qt::red));
// 设置左轴刻度线的颜色(蓝色)
customplot.yAxis->setTickPen(QPen(Qt::blue));
// 设置上轴刻度线的颜色(黄色)
customplot.xAxis2->setTickPen(QPen(Qt::yellow));
// 设置右轴刻度线的颜色(绿色)
customplot.yAxis2->setTickPen(QPen(Qt::green));
// 设置下轴刻度标签的颜色(红色)
customplot.xAxis->setTickLabelColor(Qt::red);
// 设置左轴刻度标签的颜色(蓝色)
customplot.yAxis->setTickLabelColor(Qt::blue);
// 设置上轴刻度标签的颜色(黄色)
customplot.xAxis2->setTickLabelColor(Qt::yellow);
// 设置右轴刻度标签的颜色(绿色)
customplot.yAxis2->setTickLabelColor(Qt::green);
// 设置 Y 轴的刻度标签字体
QFont labelFont;
labelFont.setPointSize(15); // 设置字体大小为15
customplot.yAxis->setTickLabelFont(labelFont);
// 设置轴标签的颜色
customplot.xAxis->setLabelColor(Qt::red); // X轴标签的颜色(红色)
customplot.yAxis->setLabelColor(Qt::blue); // Y轴标签的颜色(蓝色)
customplot.xAxis2->setLabelColor(Qt::yellow); // X轴2标签颜色(黄色)
customplot.yAxis2->setLabelColor(Qt::green); // Y轴2标签颜色(绿色)
}
void CWidget::setCustomplotBackground(QCustomPlot *customplot)
{
// 设置坐标轴矩形区域背景为黑色
// customplot->axisRect()->setBackground(QBrush(Qt::black));
// 设置整个QCustomPlot背景为黑色
// customplot->setBackground(QBrush(Qt::black));
}
void CWidget::setCustomplotBackgroundImg(QCustomPlot *customplot)
{
// {
// // 坐标轴区域启用背景缩放
// customplot->axisRect()->setBackgroundScaled(true);
// // 坐标轴区域自由缩放
// customplot->axisRect()->setBackgroundScaledMode(Qt::AspectRatioMode::IgnoreAspectRatio);
// // 坐标轴区域背景图片
// customplot->axisRect()->setBackground(QPixmap("E:\\图片1.png"));
// }
// 整个QCustomPlot设置背景图片
customplot->setBackgroundScaled(true);
customplot->setBackgroundScaledMode(Qt::AspectRatioMode::IgnoreAspectRatio);
customplot->setBackground(QPixmap("E:\\图片1.png"));
}
void CWidget::setCustomplotLegend(QCustomPlot *customplot)
{
// 开启图例
customplot->legend->setVisible(true);
// 设置图例的位置(右上)
customplot->axisRect()->insetLayout()->setInsetAlignment(0,Qt::AlignTop|Qt::AlignRight);
// 设置图例的背景颜色(白色透明)
customplot->legend->setBrush(QColor(255, 255, 255, 0));
// 图例中的每条线设置颜色
customplot->graph(0)->setName("可导");
customplot->graph(1)->setName("可微");
// 隐藏图例的边框
customplot->legend->setBorderPen(Qt::NoPen);
// 设置图例的字体
customplot->legend->setFont(QFont("Helvetica", 15));
// 设置图例与图例之间的间隔
customplot->legend->setRowSpacing(10);
// 设置图例的字体颜色
customplot->legend->setTextColor(Qt::green);//设置图例文字颜色
}
void CWidget::selfDefTickLabel(QCustomPlot *customplot, const float tickValue, const QString &selfLabel)
{
// 为 Y 轴设置自定义刻度标签
QSharedPointer<QCPAxisTickerText> textTicker(new QCPAxisTickerText);
textTicker->addTick(tickValue, selfLabel);
customplot->yAxis->setTicker(textTicker);
}
/*
* 功能:左键按下拖动框选,框选区域放大;
*/
#if 0
void CWidget::initForm()
{
QVBoxLayout *m_mainLay = new QVBoxLayout(this);
QCustomPlot *customPlot = new QCustomPlot();
// 增加第一张图
customPlot->addGraph();
customPlot->graph(0)->setPen(QPen(Qt::blue)); // 曲线的颜色
customPlot->graph(0)->setBrush(QBrush(QColor(0, 0, 255, 20))); // 曲线与X轴包围区的颜色
// 增加第二张图
customPlot->addGraph();//添加graph等价于添加新曲线
customPlot->graph(1)->setPen(QPen(Qt::red)); // 曲线的颜色
// 生成模拟数据点 (x-y0 第一条曲线, x-y1为第2条曲线):
QVector<double> x(251), y0(251), y1(251);
for (int i=0; i<251; ++i)
{
x[i] = i;
y0[i] = qExp(-i/150.0)*qCos(i/10.0); // 第一条曲线:y0衰减cos
y1[i] = qExp(-i/150.0); // 第二条曲线:y1衰减指数
}
customPlot->xAxis2->setVisible(true);
customPlot->xAxis2->setTickLabels(false);
customPlot->yAxis2->setVisible(true);
customPlot->yAxis2->setTickLabels(false);
// 使上下两个X轴的范围总是相等,使左右两个Y轴的范围总是相等
connect(customPlot->xAxis, SIGNAL(rangeChanged(QCPRange)), customPlot->xAxis2, SLOT(setRange(QCPRange)));
connect(customPlot->yAxis, SIGNAL(rangeChanged(QCPRange)), customPlot->yAxis2, SLOT(setRange(QCPRange)));
// 把已存在的数据填充进graph的数据区
customPlot->graph(0)->setData(x, y0);
customPlot->graph(1)->setData(x, y1);
//自动调整XY轴的范围,以便显示出graph(0)中所有的点(下面会单独讲到这个函数)
customPlot->graph(0)->rescaleAxes();
//自动调整XY轴的范围,以便显示出graph(1)中所有的点
customPlot->graph(1)->rescaleAxes(true);
// 支持鼠标拖拽轴的范围、滚动缩放轴的范围,左键点选图层(每条曲线独占一个图层)
customPlot->setInteractions(QCP::iRangeDrag | QCP::iRangeZoom | QCP::iSelectPlottables);
// 框选放大功能(个人觉得不好用)
// customPlot->selectionRect()->setPen(QPen(Qt::black,1,Qt::DashLine));//设置选框的样式:虚线
// customPlot->selectionRect()->setBrush(QBrush(QColor(0,0,100,50)));//设置选框的样式:半透明浅蓝
// customPlot->setSelectionRectMode(QCP::SelectionRectMode::srmZoom);
// 立即刷新图像
customPlot->replot();
m_mainLay->addWidget(customPlot);
}
#endif