文章目录
1、功能描述
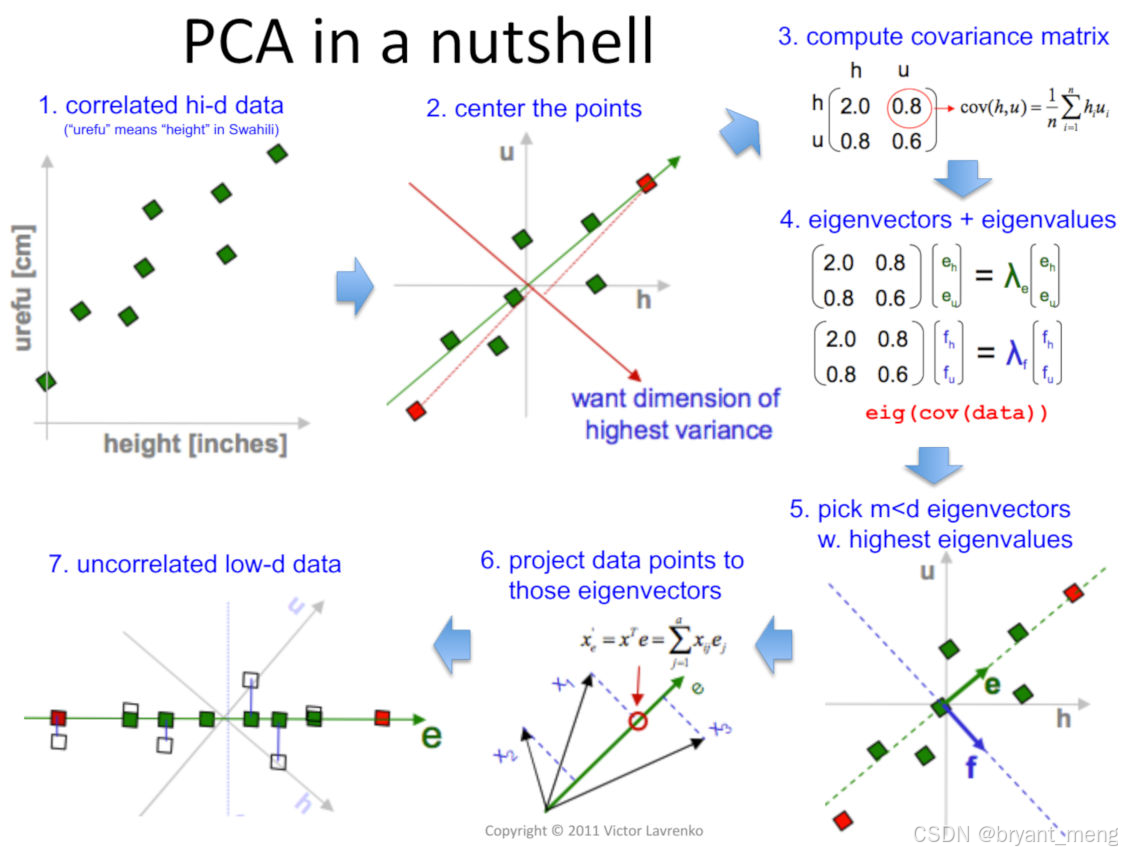
找出物体轮廓,根据 PCA 计算特征值和特征向量,绘制特征值和特征向量,来初步展示物体的方向
2、代码实现
导入库函数,读入图片,判定图片是否存在,显示图片
python
import cv2 as cv
from math import atan2, cos, sin, sqrt, pi
import numpy as np

# Load the image
img = cv.imread("1.jpeg")

# Was the image there?
if img is None:
    print("Error: File not found")
    exit(0)

cv.imshow('Input Image', img)
灰度化图片,二值化图片,为后续找轮廓做准备
python
# Convert image to grayscale
gray = cv.cvtColor(img, cv.COLOR_BGR2GRAY)
cv.imwrite("gray.jpg", gray)

# Convert image to binary
_, bw = cv.threshold(gray, 50, 255, cv.THRESH_BINARY | cv.THRESH_OTSU)
cv.imwrite("bw.jpg", bw)
找轮廓
python
# Find all the contours in the thresholded image
contours, _ = cv.findContours(bw, cv.RETR_LIST, cv.CHAIN_APPROX_NONE)
遍历轮廓,剔除面积过小或者过大的轮廓,绘制轮廓,调用 getOrientation 获取物体方向并绘制,并显示绘制结果
python
for i, c in enumerate(contours):

    # Calculate the area of each contour
    area = cv.contourArea(c)

    # Ignore contours that are too small or too large
    if area < 1000 or 100000 < area:
        continue

    # Draw each contour only for visualisation purposes with red color
    cv.drawContours(img, contours, i, (0, 0, 255), 2)

    # Find the orientation of each shape
    getOrientation(c, img)

cv.imshow('Output Image', img)
cv.waitKey(0)
cv.destroyAllWindows()

# Save the output image to the current directory
cv.imwrite("output_img.jpg", img)
下面看看 getOrientation(c, img) 的实现
python
def getOrientation(pts, img):
    ## [pca]
    # Construct a buffer used by the pca analysis
    sz = len(pts)  # 轮廓的关键点数, pts (446, 1, 2)
    data_pts = np.empty((sz, 2), dtype=np.float64)  # (446, 2)
    for i in range(data_pts.shape[0]):
        data_pts[i, 0] = pts[i, 0, 0]
        data_pts[i, 1] = pts[i, 0, 1]

    # Perform PCA analysis
    mean = np.empty((0))
    mean, eigenvectors, eigenvalues = cv.PCACompute2(data_pts, mean)

    # Store the center of the object
    cntr = (int(mean[0, 0]), int(mean[0, 1]))  # (177, 349)
    ## [pca]

    ## [visualization]
    # Draw the principal components
    cv.circle(img, cntr, 3, (255, 0, 255), 2)
    p1 = (cntr[0] + 0.025 * eigenvectors[0, 0] * eigenvalues[0, 0],
          cntr[1] + 0.025 * eigenvectors[0, 1] * eigenvalues[0, 0])
    p2 = (cntr[0] - 0.025 * eigenvectors[1, 0] * eigenvalues[1, 0],
          cntr[1] - 0.025 * eigenvectors[1, 1] * eigenvalues[1, 0])

   #  乘以0.25是为了放大这个距离,使其在图像上更加明显。

    drawAxis(img, cntr, p1, (255, 255, 0), 1)
    drawAxis(img, cntr, p2, (0, 0, 255), 5)

    angle = atan2(eigenvectors[0, 1], eigenvectors[0, 0])  # orientation in radians
    ## [visualization]

    # Label with the rotation angle
    # label = "  Rotation Angle: " + str(-int(np.rad2deg(angle)) - 90) + " degrees"
    label = str(-int(np.rad2deg(angle)) - 90) + " degrees"
    textbox = cv.rectangle(img, (cntr[0]+15, cntr[1] - 50), (cntr[0] + 130, cntr[1] - 15), (255, 255, 255), -1)
    cv.putText(img, label, (cntr[0]+15, cntr[1]-25), cv.FONT_HERSHEY_SIMPLEX, 0.5, (0, 0, 0), 1, cv.LINE_AA)

    return angle
其中 cv2.PCACompute2 获取特征值和特征向量
p1、p2 是计算特征向量乘以特征值,方便后续可视化物体方向,0.025 是系数,影响的是绘制时候的长度
drawAxis 绘制箭头,展示物体方向
python
def drawAxis(img, p_, q_, color, scale):
    p = list(p_)
    q = list(q_)

    ## [visualization1]
    angle = atan2(p[1] - q[1], p[0] - q[0])  # angle in radians
    hypotenuse = sqrt((p[1] - q[1]) **2 + (p[0] - q[0])**2)

    # Here we lengthen the arrow by a factor of scale
    q[0] = p[0] - scale * hypotenuse * cos(angle)
    q[1] = p[1] - scale * hypotenuse * sin(angle)
    cv.line(img, (int(p[0]), int(p[1])), (int(q[0]), int(q[1])), color, 3, cv.LINE_AA)

    # create the arrow hooks 绘制箭头的钩子
    p[0] = q[0] + 9 * cos(angle + pi / 4)
    p[1] = q[1] + 9 * sin(angle + pi / 4)
    cv.line(img, (int(p[0]), int(p[1])), (int(q[0]), int(q[1])), color, 3, cv.LINE_AA)

    p[0] = q[0] + 9 * cos(angle - pi / 4)
    p[1] = q[1] + 9 * sin(angle - pi / 4)
    cv.line(img, (int(p[0]), int(p[1])), (int(q[0]), int(q[1])), color, 3, cv.LINE_AA)
    ## [visualization1]
可以看到有三个 cv2.line,第一个是绘制方向的直线,第二个和第三个分别绘制箭头,偏离直线 ±45°
scale 控制箭头直线的长度
3、完整代码
python
import cv2 as cv
from math import atan2, cos, sin, sqrt, pi
import numpy as np


def drawAxis(img, p_, q_, color, scale):
    p = list(p_)
    q = list(q_)

    ## [visualization1]
    angle = atan2(p[1] - q[1], p[0] - q[0])  # angle in radians
    hypotenuse = sqrt((p[1] - q[1]) **2 + (p[0] - q[0])**2)

    # Here we lengthen the arrow by a factor of scale
    q[0] = p[0] - scale * hypotenuse * cos(angle)
    q[1] = p[1] - scale * hypotenuse * sin(angle)
    cv.line(img, (int(p[0]), int(p[1])), (int(q[0]), int(q[1])), color, 3, cv.LINE_AA)

    # create the arrow hooks 绘制箭头的钩子
    p[0] = q[0] + 9 * cos(angle + pi / 4)
    p[1] = q[1] + 9 * sin(angle + pi / 4)
    cv.line(img, (int(p[0]), int(p[1])), (int(q[0]), int(q[1])), color, 3, cv.LINE_AA)

    p[0] = q[0] + 9 * cos(angle - pi / 4)
    p[1] = q[1] + 9 * sin(angle - pi / 4)
    cv.line(img, (int(p[0]), int(p[1])), (int(q[0]), int(q[1])), color, 3, cv.LINE_AA)
    ## [visualization1]


def getOrientation(pts, img):
    ## [pca]
    # Construct a buffer used by the pca analysis
    sz = len(pts)  # 轮廓的关键点数, pts (446, 1, 2)
    data_pts = np.empty((sz, 2), dtype=np.float64)  # (446, 2)
    for i in range(data_pts.shape[0]):
        data_pts[i, 0] = pts[i, 0, 0]
        data_pts[i, 1] = pts[i, 0, 1]

    # Perform PCA analysis
    mean = np.empty((0))
    mean, eigenvectors, eigenvalues = cv.PCACompute2(data_pts, mean)

    # Store the center of the object
    cntr = (int(mean[0, 0]), int(mean[0, 1]))  # (177, 349)
    ## [pca]

    ## [visualization]
    # Draw the principal components
    cv.circle(img, cntr, 3, (255, 0, 255), 2)
    p1 = (cntr[0] + 0.025 * eigenvectors[0, 0] * eigenvalues[0, 0],
          cntr[1] + 0.025 * eigenvectors[0, 1] * eigenvalues[0, 0])
    p2 = (cntr[0] - 0.025 * eigenvectors[1, 0] * eigenvalues[1, 0],
          cntr[1] - 0.025 * eigenvectors[1, 1] * eigenvalues[1, 0])

   #  乘以0.25是为了放大这个距离,使其在图像上更加明显。

    drawAxis(img, cntr, p1, (255, 255, 0), 1)
    drawAxis(img, cntr, p2, (0, 0, 255), 5)

    angle = atan2(eigenvectors[0, 1], eigenvectors[0, 0])  # orientation in radians
    ## [visualization]

    # Label with the rotation angle
    # label = "  Rotation Angle: " + str(-int(np.rad2deg(angle)) - 90) + " degrees"
    label = str(-int(np.rad2deg(angle)) - 90) + " degrees"
    textbox = cv.rectangle(img, (cntr[0]+15, cntr[1] - 50), (cntr[0] + 130, cntr[1] - 15), (255, 255, 255), -1)
    cv.putText(img, label, (cntr[0]+15, cntr[1]-25), cv.FONT_HERSHEY_SIMPLEX, 0.5, (0, 0, 0), 1, cv.LINE_AA)

    return angle


# Load the image
img = cv.imread("1.jpeg")

# Was the image there?
if img is None:
    print("Error: File not found")
    exit(0)

cv.imshow('Input Image', img)

# Convert image to grayscale
gray = cv.cvtColor(img, cv.COLOR_BGR2GRAY)
cv.imwrite("gray.jpg", gray)

# Convert image to binary
_, bw = cv.threshold(gray, 50, 255, cv.THRESH_BINARY | cv.THRESH_OTSU)
cv.imwrite("bw.jpg", bw)

# Find all the contours in the thresholded image
contours, _ = cv.findContours(bw, cv.RETR_LIST, cv.CHAIN_APPROX_NONE)

for i, c in enumerate(contours):

    # Calculate the area of each contour
    area = cv.contourArea(c)

    # Ignore contours that are too small or too large
    if area < 1000 or 100000 < area:
        continue

    # Draw each contour only for visualisation purposes with red color
    cv.drawContours(img, contours, i, (0, 0, 255), 2)

    # Find the orientation of each shape
    getOrientation(c, img)

cv.imshow('Output Image', img)
cv.waitKey(0)
cv.destroyAllWindows()

# Save the output image to the current directory
cv.imwrite("output_img.jpg", img)
4、结果展示
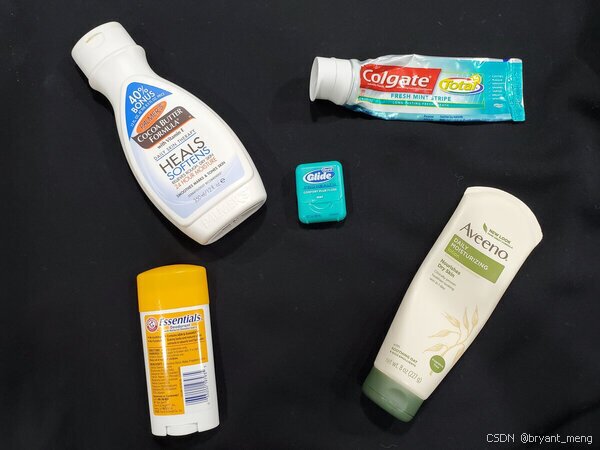
输入图片
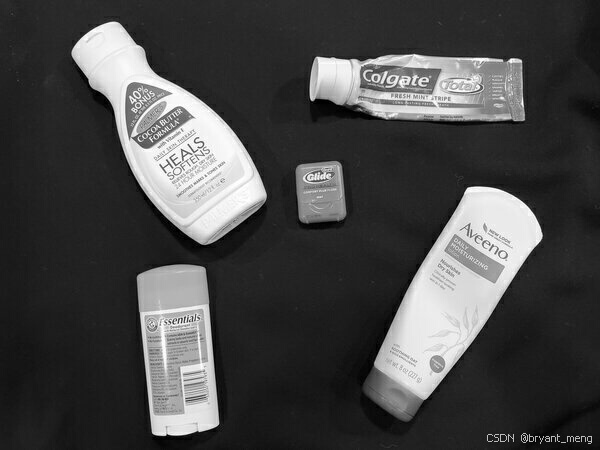
灰度图
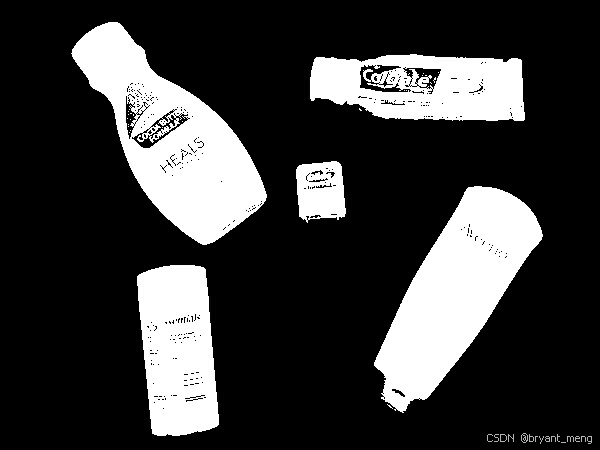
二值化后的结果
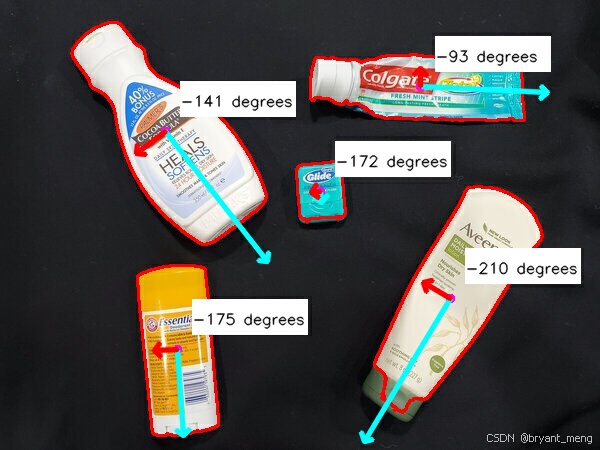
绘制的方向,drawAxis(img, cntr, p2, (0, 0, 255), 1) 时
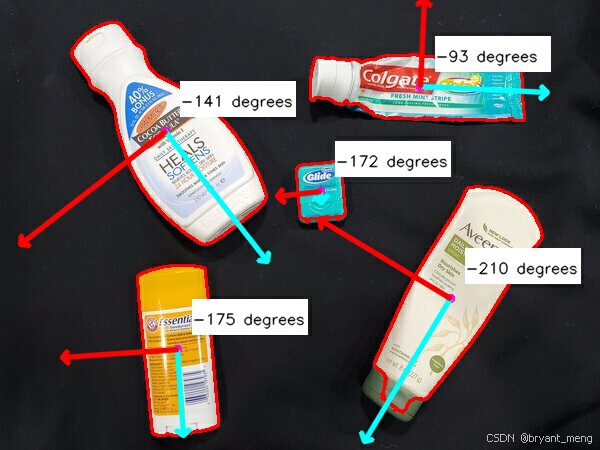
drawAxis(img, cntr, p2, (0, 0, 255), 5) 时
角度怎么分析呢?
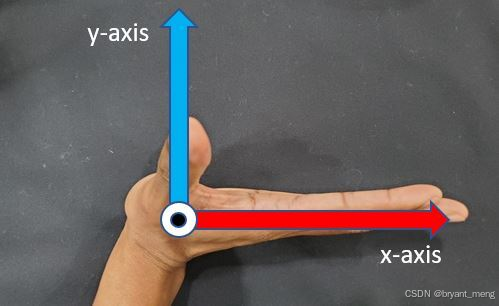
上图展示的是正方向
逆时针旋转能还原成上图情况就是负角度
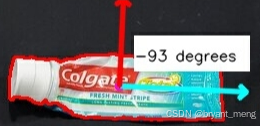
仔细核对发现这个不符合上述的规则,个人理解,因为这个和正方向是反的(还原不到上述的正方向)
逆时针旋转,还原到 x 朝左,正好是 93°
5、涉及到的库函数
一、函数简介
cv2.PCACompute2 是 OpenCV 库中用于执行主成分分析(PCA)的函数。 PCA是一种统计方法,用于减少数据集的维度,同时保留数据中的主要变化特征。通过PCA,可以找到数据中的"主成分",这些主成分定义了数据的主要变化方向。
二、函数参数
cv2.PCACompute2 函数接受多个参数,以下是其主要参数的解释:
- data_pts:一个二维NumPy数组,包含所有数据点的坐标。每个数据点由一个包含两个元素的元组(x, y)表示。
- mean:可选参数,用于指定数据点的平均值。如果未提供,OpenCV会自动计算数据点的平均值。
- eigenvectors:可选参数,用于指定特征向量。如果未提供,OpenCV会自动计算特征向量。
- eigenvalues:可选参数,用于指定特征值。如果未提供,OpenCV会自动计算特征值。
- noise_cov:可选参数,用于指定噪声的协方差矩阵。如果未提供,OpenCV会使用单位协方差矩阵。
- flags:可选参数,用于指定计算方式。默认值为0,表示使用OpenCV内置的计算方式。
- iterations:可选参数,用于指定迭代次数。默认值为0,表示使用OpenCV内置的迭代次数。
- eigenvalue_threshold:可选参数,用于指定特征值阈值。如果特征值小于这个阈值,它们将被忽略。默认值为0.0,表示不使用阈值。
- eigenvector_threshold:可选参数,用于指定特征向量阈值。如果特征向量的模小于这个阈值,它们将被忽略。默认值为0.0,表示不使用阈值。
三、函数返回值
cv2.PCACompute2 函数返回以下三个值:
- mean:数据点的平均值。
- eigenvectors:特征向量。这些特征向量指向PCA认为信息最丰富的方向。
- eigenvalues:特征值。特征值表示了对应特征向量方向上的方差大小。
四、使用示例
以下是一个使用 cv2.PCACompute2 函数的简单示例:
python
import numpy as np
import cv2

# 生成一组多元正态分布的数据
mean = [20, 20]
cov = [[5, 5], [5, 25]]
X = np.random.multivariate_normal(mean, cov, 500)

# 执行PCA计算
mean, eigenvectors, eigenvalues = cv2.PCACompute2(X.T)

# 输出结果
print("Mean:", mean)
print("Eigenvectors:\n", eigenvectors)
print("Eigenvalues:\n", eigenvalues)
在这个示例中,我们首先生成了一组多元正态分布的数据,然后使用 cv2.PCACompute2 函数执行PCA计算,并输出平均值、特征向量和特征值。
五、注意事项
在使用 cv2.PCACompute2 函数之前,需要确保已经安装了OpenCV库。
- 输入的 data_pts 参数应该是一个二维 NumPy 数组,且每个数据点应该由一个包含两个元素的元组(x, y)表示。
- 根据实际需求,可以选择性地提供 mean、eigenvectors、eigenvalues、noise_cov 等参数。如果未提供这些参数,OpenCV会自动计算它们。
- 返回值中的 eigenvectors 和 eigenvalues 分别表示了数据的主成分方向和对应的特征值大小。这些结果可以用于进一步的数据分析和处理。
通过合理使用该函数,可以有效地减少数据的维度并提取出数据中的主要变化特征。