Python中要实现百分比数据条的显示,可以使用pandas 库,pandas图表样式的设置与Excel中的条件格式设置比较类似,比如Excel里常用的数据条 的用法,在pandas中使用代码进行高亮显示,用来突出重点数据,下面一起来学习。
一、数据获取
首先,导入2021年12月全国城市住宅房价排行榜的数据,计算增长率等指标。
import https://zhida.zhihu.com/search?content_id=694695338&content_type=Answer&match_order=1&q=pandas+&zhida_source=entityas pd

data_city_price=pd.read_excel(r'C:/Users/尚天强/Desktop/大话数据分析系列原创/pandas/2021年12月全国城市住宅房价排行榜.xlsx')
data_city_price['增长率']=(data_city_price['12月']/data_city_price['7月']-1)#.apply(lambda x:format(x,'.2%'))
data_city_price['自增长率']=data_city_price['12月'].pct_change(fill_method='ffill')#.apply(lambda x:format(x,'.2%'))
df=data_city_price
df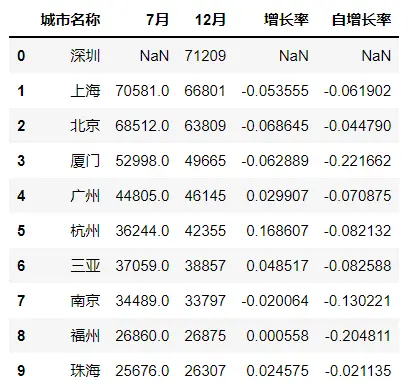
查看图表数据属性,其中"7月"、"增长率"、"自增长率"这三列数据类型都是字符型,而且都有缺失值。
df.info()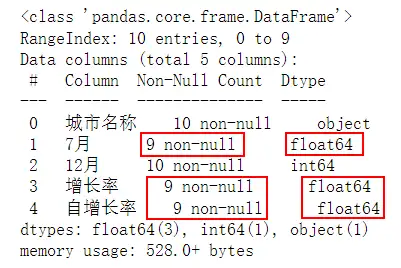
二、格式设置
pandas运算后得到的数据类型是小数,如果需要将其转化为百分数%,可以使用format函数自定义数据类型。
#自定义数据类型
df.style.format({'7月':'{:.0f}','增长率':'{:.2%}','自增长率':'{:.2%}'})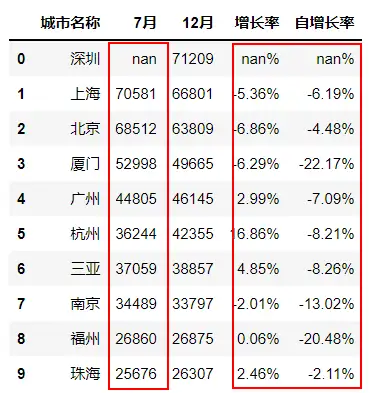
数据字段显示较多可以使用hide_columns函数隐藏列。
#隐藏列
df.style.hide_columns(['自增长率'])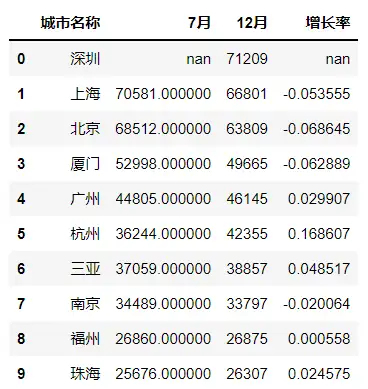
标记数据的最大值使用highlight_max函数。
#高亮显示最大值,默认是黄色
df.style.highlight_max()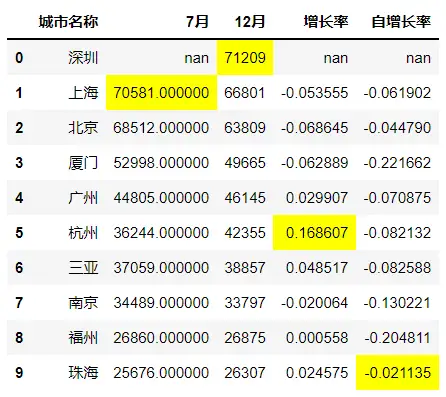
同理,标记数据的最小值使用highlight_min函数。
#高亮显示最小值,高亮颜色可更改
df.style.highlight_min(color='gray')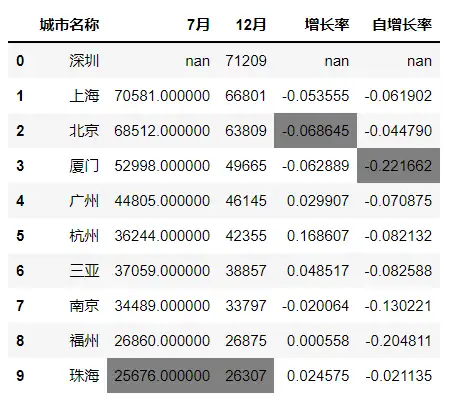
突出显示空单元格使用highlight_null函数。
#高亮显示空值
df.style.highlight_null(null_color='blue')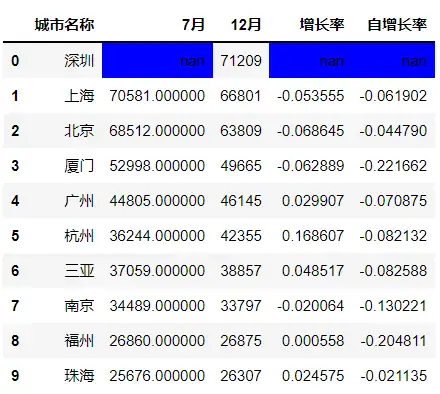
同时pandas还支持链式调用,也就是说pandas设置格式可以使用点的形式依次设置数据格式,突出显示最大值、最小值、空值。
#https://zhida.zhihu.com/search?content_id=694695338&content_type=Answer&match_order=2&q=%E9%93%BE%E5%BC%8F%E8%B0%83%E7%94%A8&zhida_source=entity
(df.style.format({'7月':'{:.0f}','增长率':'{:.2%}','自增长率':'{:.2%}'})
          .highlight_max()
          .highlight_min(color='gray')
          .highlight_null(null_color='blue')
          .hide_columns(['自增长率']))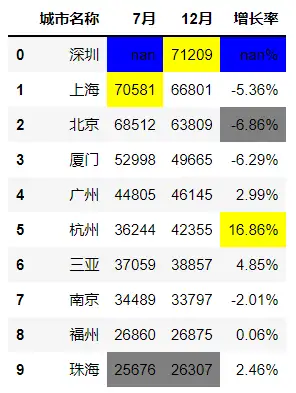
除了高亮显示空值,还可以将空的单元格替换为具体的文本,比如这里替换为空值。
#高亮显示空值,并标注
(df.style.highlight_null(null_color='red')
          .format({'7月':'{:.0f}','增长率':'{:.2%}','自增长率':'{:.2%}'},na_rep='空值'))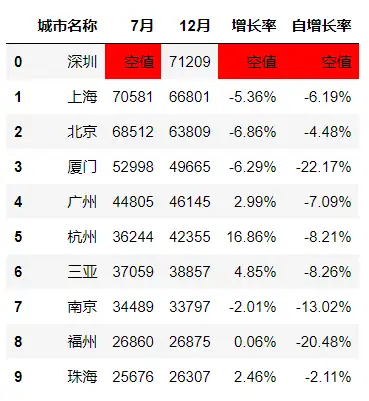
图表设置格式后即可导出。
#导出图层
(df.style.highlight_null(null_color='red')
          .format({'7月':'{:.0f}','增长率':'{:.2%}','自增长率':'{:.2%}'},na_rep='空值')
          .to_excel(r'C:\Users\尚天强\Desktop\styled.xlsx', engine='openpyxl',index=False))
三、色阶
使用pandas设置色阶,类似Excel条件格式中的色阶使用,数值越大,颜色越深,数值越小,颜色越浅。
#色阶
import seaborn as sns
cmp=sns.light_palette('blue',as_cmap=True)
therm=df.iloc[:,0:3].style.background_gradient(cmap=cmp)
therm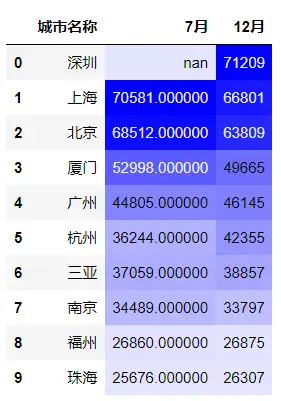
四、数据条
使用pandas设置数据条,当数值大于0时,标记为绿色,当数值小于0时,标记为红色。
#数据条
(df.iloc[0:10,:].style.bar(['7月','12月','增长率','自增长率'],align='mid',color=['#d65f5f','#5fba7d'])                       .format({'7月':'{:.0f}','增长率':'{:.2%}','自增长率':'{:.2%}'}))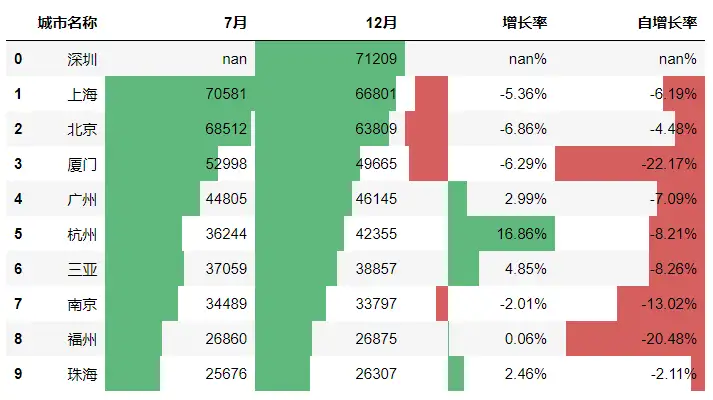
RGB颜色表
RGB颜色格式:#RRGGBB(两个R代表了红色光,两个G代表了绿色光,两个B代表了蓝色光,RGB均用16进制数字表示) ,如#0000ff代表了0份红色光,0份绿色光和255份蓝色光。
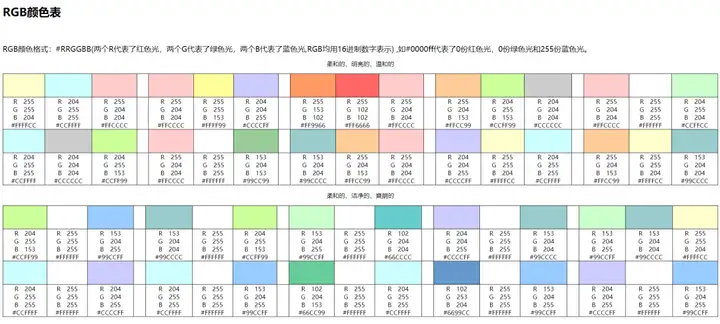
除了使用默认的数据条颜色,还可以使用上述的RGB颜色表,自定义数据条颜色。
#数据条
(df.iloc[0:10,:].style.bar(['7月','12月','增长率','自增长率'],align='mid',color=['#FF6666','#0099CC'])                       .format({'7月':'{:.0f}','增长率':'{:.2%}','自增长率':'{:.2%}'}))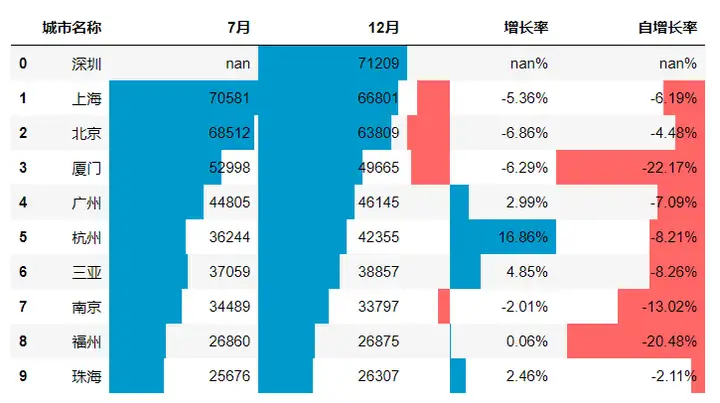
五年互联网数据分析经验,擅长Excel、SQL、Python、PowerBI数据处理工具,数据可视化、商业数据分析技能,统计学、机器学习知识,持续创作数据分析内容,点赞关注,不迷路。