离婚数据分析与预测
该数据集包含个人根据与婚姻生活相关的55个不同问题对其配偶的评分。
而且,问卷回答者必须从0到4打分,0是最低的,4是最高的
python
import pandas as pd
import matplotlib.pyplot as plt
import seaborn as sns
import warnings

warnings.filterwarnings("ignore")
0.数据预处理
python
df = pd.read_csv("./divorce.csv")
df
python
with open('./Divorce_README.txt',encoding='utf-8') as file:
    lines = file.readlines()
    # 使用 "rstrip ()" 方法去除行尾的空白字符
    lines = [line.rstrip() for line in lines]
python
# 按照'\t'进行分割,然后取分割后的第二个元素
que = [x.split('\t')[1] for x in lines[2:]]
que[:1]
python
# 简洁形式输出数据信息
df.info(verbose=False)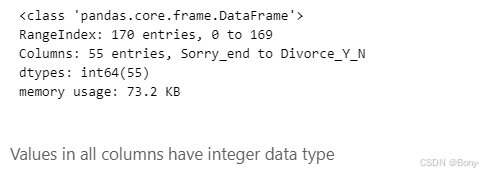
python
 可视化缺失值
import missingno as msno
msno.matrix(df,color=(0.10, 0.10, 0.44))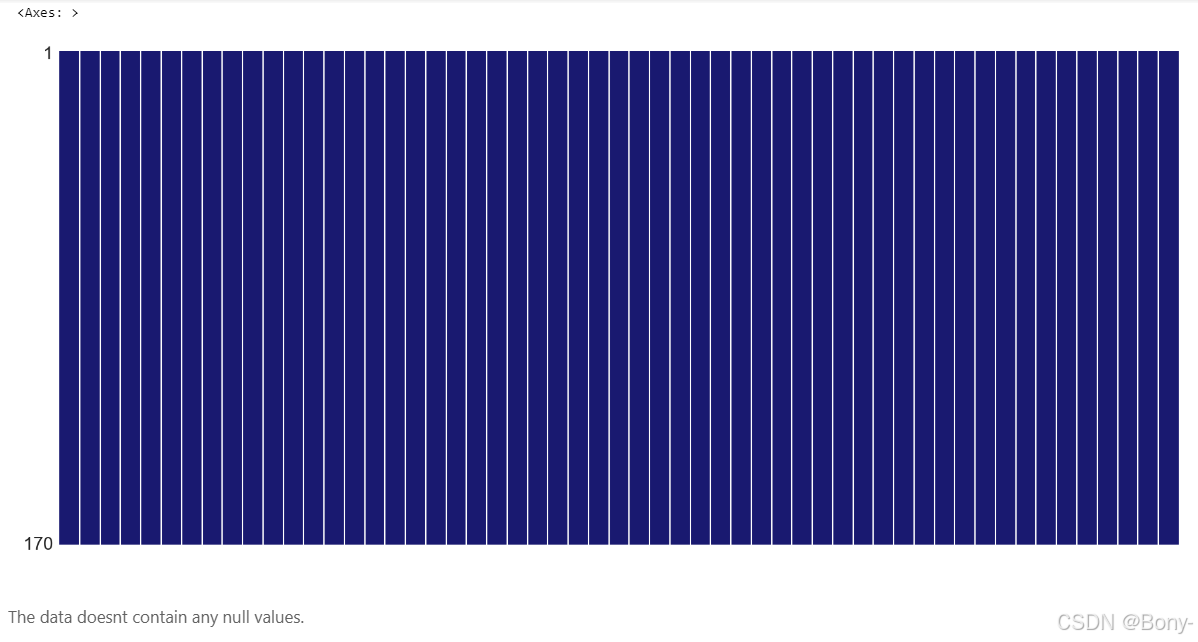
python
# 完整代码以及数据集以下链接
https://mbd.pub/o/bread/mbd-Z52WlJhy
可视化缺失值讲解
python
import numpy as np

# 设置随机种子以确保结果可重复
np.random.seed(42)
data_test = np.random.randint(0, 100, size=(20, 10)).astype(float)

# 随机在数据中插入一些空缺值(NaN)
mask = np.random.rand(20, 10) < 0.2  # 20% 的概率生成空缺值
data_test[mask] = np.nan
data_test = pd.DataFrame(data_test, columns=[f'Col_{i+1}' for i in range(10)])
msno.matrix(data_test, color=(0.10, 0.10, 0.44))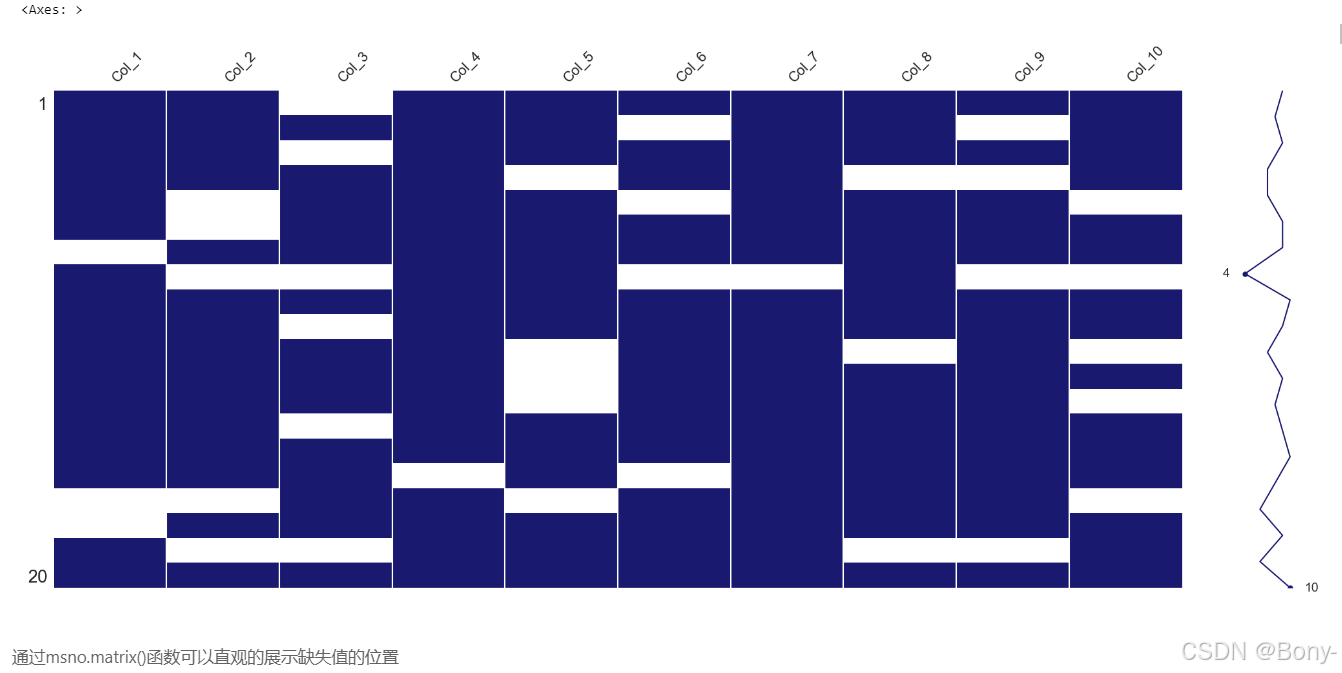
1.EDA(探索性数据分析)
数据分布
python
# 数据分布统计
values = dict()
que_cols = df.drop('Divorce_Y_N',axis=1).columns
for c in que_cols:
    values[c] = dict(round(df[c].value_counts(normalize=True)*100,2))

que_rate_df = pd.DataFrame(values).rename(columns=dict(zip(que_cols,que))).T
que_rate_df = que_rate_df[range(5)]
que_rate_df.style.format('{:.1f}%')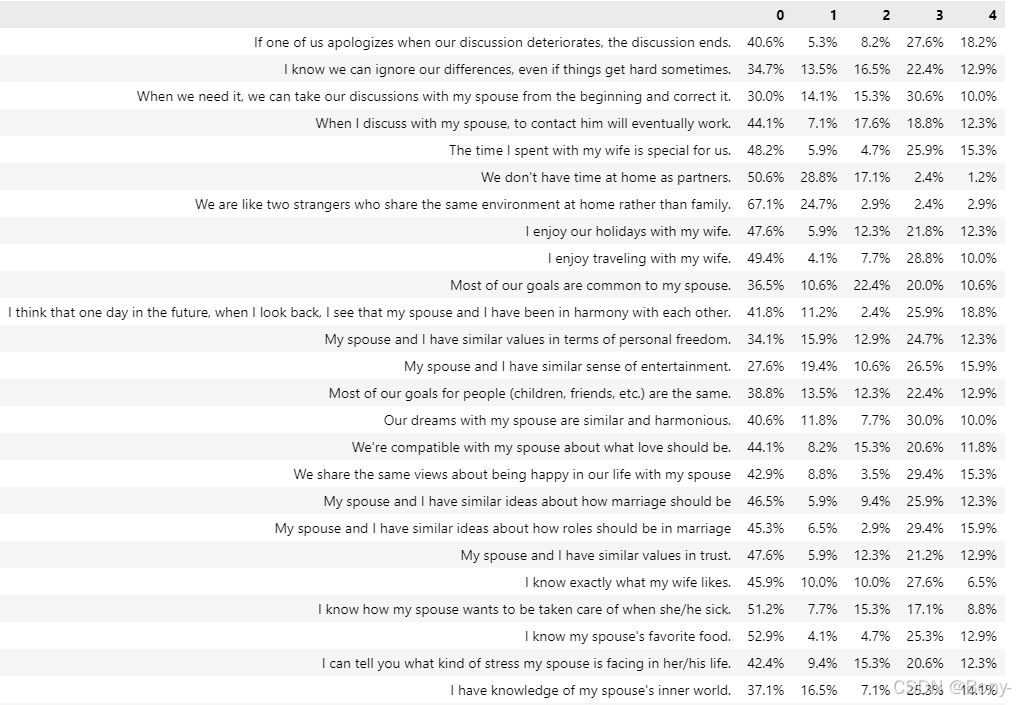
python
alues = dict()
que_cols = df.drop('Divorce_Y_N', axis=1).columns
for c in que_cols:
    values[c] = dict(round(df[c].value_counts(normalize=True) * 100, 2))

que_rate_df = pd.DataFrame(values).rename(columns=dict(zip(que_cols, que))).T
que_rate_df = que_rate_df[range(5)]

# 对每一行按数值从高到低排序
que_rate_df = que_rate_df.apply(lambda x: x.sort_values(ascending=False), axis=1)

# 绘制热力图
plt.figure(figsize=(16, 12))
sns.heatmap(que_rate_df, annot=True, cmap='YlGnBu', vmin=0, vmax=100)
plt.title('Heatmap of Response Percentages')
plt.show()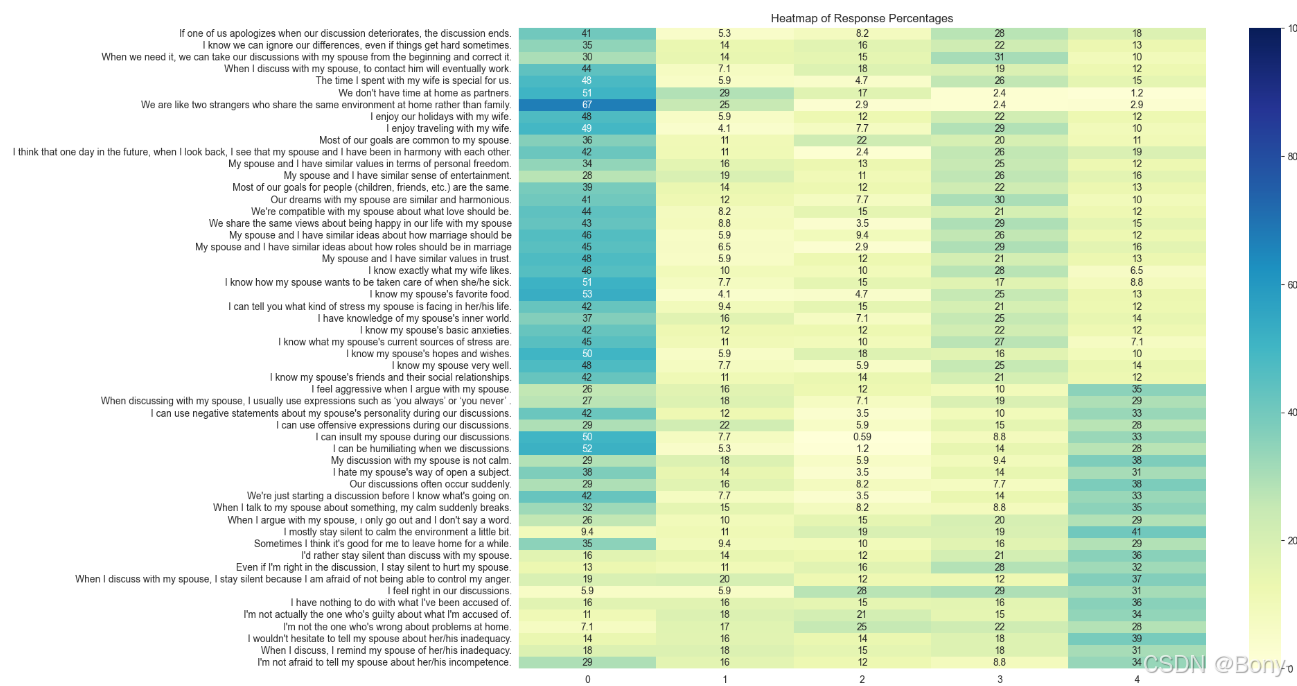
python
# 统计离婚与未离婚的比例
divorce_counts = df['Divorce_Y_N'].value_counts()

# 设置每一部分的偏移距离
explode = (0.1, 0)

# 绘制圆饼图
plt.figure(figsize=(6, 6))
plt.pie(divorce_counts, labels=['Not Divorced', 'Divorced'], autopct='%1.1f%%', startangle=90,
        colors=['#BDF2D5', '#A85CF9'], explode=explode, shadow=True)
plt.title('Divorce Distribution')
plt.show()
离婚与否数据分布均衡,可以直接用于后续的训练
各变量与离婚变量的相关性
点二列相关系数
python
from scipy.stats import pointbiserialr

# 计算点二列相关系数
correlations = {}
for col in df.columns[:-1]:  # 排除最后一列(离婚与否)
    corr, _ = pointbiserialr(df[col], df['Divorce_Y_N'])
    correlations[col] = corr

# 将结果转换为DataFrame
correlation_df = pd.DataFrame(list(correlations.items()), columns=['Question', 'Correlation'])
correlation_df = correlation_df.sort_values(by='Correlation', ascending=False)

# 打印结果
print(correlation_df)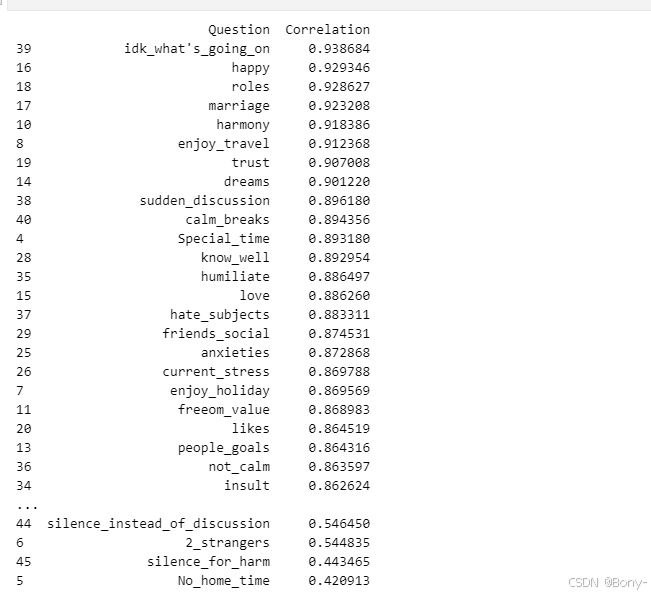
python
# 计算相关系数的平均值
mean_correlation = correlation_df['Correlation'].mean()

# 绘制折线图
plt.figure(figsize=(16, 6))
plt.plot(correlation_df['Question'], correlation_df['Correlation'], marker='o', linestyle='-', color='b', label='Correlation')
# 添加红色虚线表示相关系数0.5
plt.axhline(y=0.5, color='r', linestyle='--', label='Correlation = 0.5')
# 添加绿色虚线表示相关系数的平均值
plt.axhline(y=mean_correlation, color='g', linestyle='--', label=f'Mean Correlation = {mean_correlation:.2f}')

# 添加标题和标签
plt.title('Correlation Between Questions and Divorce', fontsize=16)
plt.xlabel('Questions', fontsize=12)
plt.ylabel('Correlation Coefficient', fontsize=12)

plt.xticks(rotation=90)
plt.legend()
plt.tight_layout()

plt.show()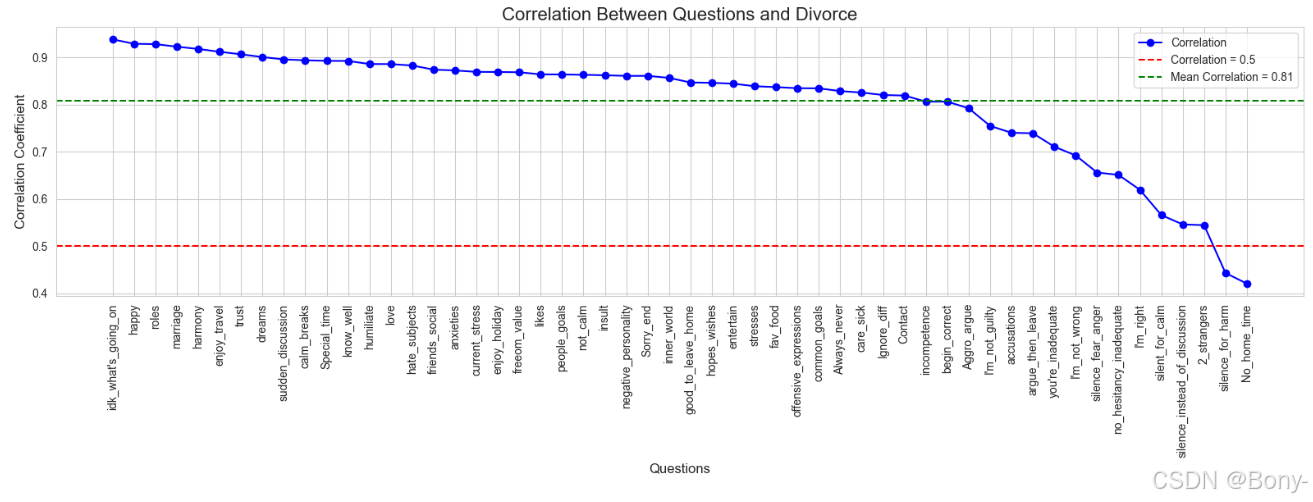
各变量间相关性分析
python
plt.figure(figsize=(15,12))
sns.heatmap(df.corr(),cmap='YlGnBu')
plt.title("Pearson Correlation value")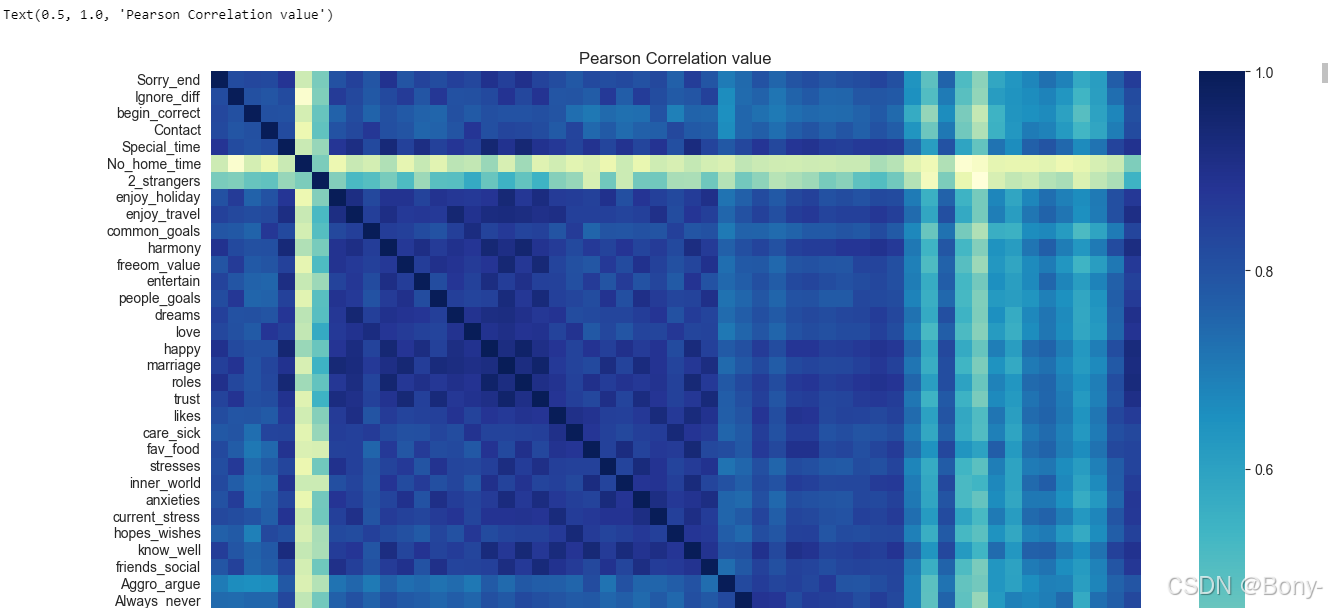
数据的关联性较强,需要先进行因子分析
2.因子分析(Factor Analysis)
因子分析(Factor Analysis)是一种多元统计分析方法,旨在通过少数几个不可观测的潜在因子来解释多个可观测变量之间的相关性结构 ,从而简化数据结构并揭示数据背后的潜在维度或公共因子。它在心理学、社会学、经济学、市场调研等众多领域都有广泛应用,有助于深入理解变量之间的内在关系以及数据的潜在模式。
通过巴雷特来球形检验与KMO检验,验证是否可以用于因子分析
巴特莱特(BARTLETT'S)球形检验
- 原假设 (H₀):相关矩阵是一个单位矩阵(即变量之间不存在相关性)。
- 备择假设 (H₁):相关矩阵不是一个单位矩阵(即变量之间存在相关性)。
python
data = df.drop('Divorce_Y_N',axis=1)
python
from factor_analyzer.factor_analyzer import calculate_bartlett_sphericity
chi2,p = calculate_bartlett_sphericity(data)
print("Chi squared value : ",chi2)
print("p value : ",p)

KMO 检验
KMO检验用于衡量变量之间共同方差的占比,取值范围始终在 0 到 1 之间。
KMO 值越大,表明变量之间的相关性越强,数据越适合进行降维技术(如因子分析)。通常认为超过 0.6 的值是可以接受的。
python
from factor_analyzer.factor_analyzer import calculate_kmo
kmo_vars,kmo_model = calculate_kmo(data)
print(kmo_model)

python
from factor_analyzer import FactorAnalyzer
import numpy as np
import matplotlib.pyplot as plt

# 假设 data 是你的数据集
n = data.shape[1]

# 初始化因子分析器
fa = FactorAnalyzer(rotation=None, impute="drop", n_factors=n)
fa.fit(data)

# 获取特征值
ev, _ = fa.get_eigenvalues()

# 计算贡献率和累积贡献率
gx = ev / np.sum(ev)  # 信息贡献度
lg = np.cumsum(gx)    # 累积贡献度

# 绘制累积贡献率的折线图
plt.plot(range(1, n+1), lg, marker='o')  # 使用 marker='o' 显示数据点
plt.xlabel('number of factors')
plt.ylabel('cumulative contribution rate')
plt.title('Number of factors and cumulative contribution rate')
plt.grid(True)
plt.show()

# 输出累积贡献率
print("Cumulative Contribution Rate:", lg)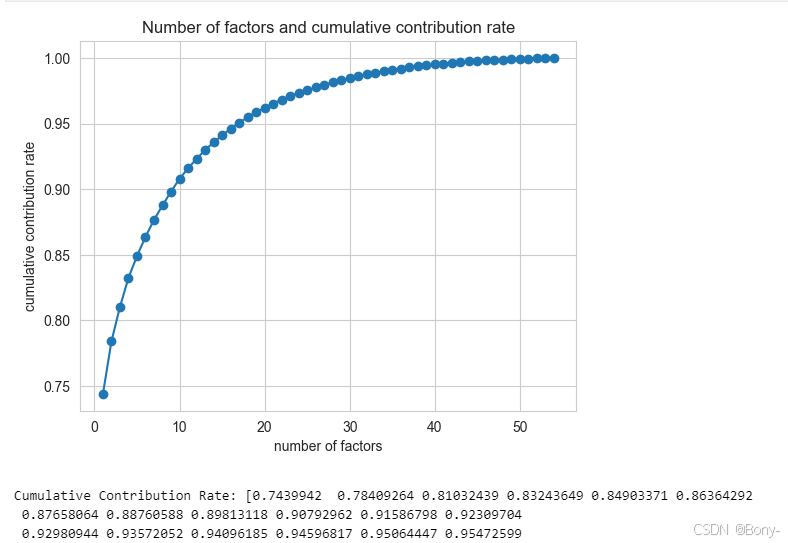
可以看出,在因字数为5的时候,累积贡献率达到了85%的水平
因子载荷
A = [ a 11 a 12 ⋯ a 1 m a 21 a 22 ⋯ a 2 m ⋮ ⋮ ⋱ ⋮ a p 1 a p 2 ⋯ a p m ] A=\begin{bmatrix}a_{11}&a_{12}&\cdots&a_{1m}\\a_{21}&a_{22}&\cdots&a_{2m}\\\vdots&\vdots&\ddots&\vdots\\a_{p1}&a_{p2}&\cdots&a_{pm}\end{bmatrix} A= a11a21⋮ap1a12a22⋮ap2⋯⋯⋱⋯a1ma2m⋮apm
因子载荷矩阵 A A A中, a p m a_{pm} apm表示第个p变量在第个因子上的载荷;因子载荷反映了第 a p m a_{pm} apm个因子之间的相关程度。它的值越大,说明该变量在对应因子上的重要性越高,即该变量在该因子上的"载荷"越大。
python
fa = FactorAnalyzer(n_factors=5,rotation='varimax')
fa.fit(data)
fa_load = pd.DataFrame(fa.loadings_,index=data.columns)
fa_load.to_csv('./fa_load.csv')
python
# 绘制热力图
plt.figure(figsize=(16, 12))  # 设置热力图的大小
sns.heatmap(fa_load, annot=True, cmap='YlGnBu', fmt='.2f', linewidths=0.5)
plt.title('Factor Loadings Heatmap')
plt.xlabel('Factors')
plt.ylabel('Variables')
plt.show()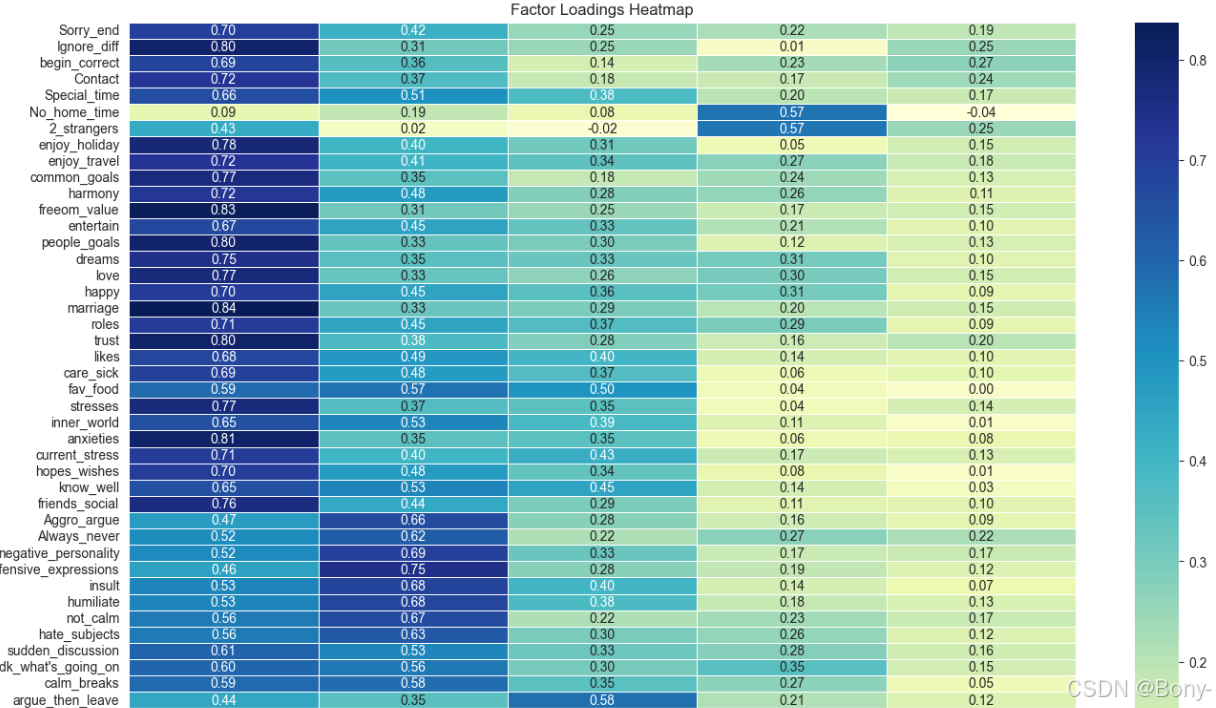
python
# 按照索引为 0 的列进行排序,排序方式为降序(ascending=False 表示降序)
fa_load.sort_values(by=0,ascending=False)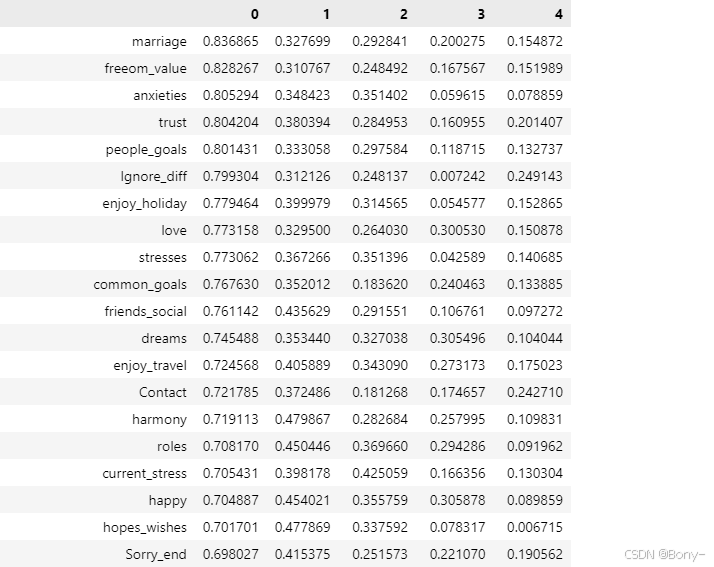
因子命名
根据因子载荷矩阵,归类因子(由于过多,只展示了各载荷问题中的前五个,详细见后因子解释章节):
因子 0: 婚姻和谐与共同目标
- 高载荷问题 :
marriage(0.837): My spouse and I have similar ideas about how marriage should be.freeom_value(0.828): My spouse and I have similar values in terms of personal freedom.anxieties(0.805): I know my spouse's basic anxieties.people_goals(0.801): Most of our goals for people (children, friends, etc.) are the same.Ignore_diff(0.799): I know we can ignore our differences, even if things get hard sometimes.
解释: 这些问题主要涉及婚姻中的和谐、共同目标、信任、情感支持以及对配偶的了解。因子0反映了婚姻中的积极因素和夫妻之间的默契。
因子 1: 冲突与负面情绪
- 高载荷问题 :
offensive_expressions(0.746): I can use offensive expressions during our discussions.negative_personality(0.694): I can use negative statements about my spouse's personality during our discussions.insult(0.684): I can insult my spouse during our discussions.Aggro_argue(0.664): I feel aggressive when I argue with my spouse.Always_never(0.620): When discussing with my spouse, I usually use expressions such as 'you always' or 'you never'.
解释: 这些问题主要涉及夫妻之间的冲突、负面情绪、争吵中的攻击性行为以及沟通中的不冷静。因子1反映了婚姻中的负面情绪和冲突。
因子 2: 沉默与逃避
- 高载荷问题 :
silent_for_calm(0.795): I mostly stay silent to calm the environment a little bit.silence_instead_of_discussion(0.773): I'd rather stay silent than discuss with my spouse.silence_fear_anger(0.688): When I discuss with my spouse, I stay silent because I am afraid of not being able to control my anger.silence_for_harm(0.663): Even if I'm right in the discussion, I stay silent to hurt my spouse.argue_then_leave(0.578): When I argue with my spouse, ı only go out and I don't say a word.
解释: 这些问题主要涉及夫妻在冲突中的沉默、逃避行为以及为了避免冲突而选择离开或保持沉默。因子2反映了婚姻中的逃避行为。
因子 3: 家庭时间与亲密感
- 高载荷问题 :
No_home_time(0.574): We don't have time at home as partners.2_strangers(0.567): We are like two strangers who share the same environment at home rather than family.
解释: 这些问题主要涉及夫妻在家庭中的时间分配以及亲密感。因子3反映了夫妻在家庭中的亲密程度和时间分配。
因子 4: 自我辩护与指责
- 高载荷问题 :
I'm_not_wrong(0.533): I'm not the one who's wrong about problems at home.I'm_not_guilty(0.443): I'm not actually the one who's guilty about what I'm accused of.I'm_right(0.424): I feel right in our discussions.accusations(0.350): I have nothing to do with what I've been accused of.no_hesitancy_inadequate(0.185): I wouldn't hesitate to tell my spouse about her/his inadequacy.
解释: 这些问题主要涉及夫妻在冲突中的自我辩护、指责以及对自己行为的合理化。因子4反映了婚姻中的自我辩护和指责行为。
总结:
- 因子 0: 婚姻和谐与共同目标
- 因子 1: 冲突与负面情绪
- 因子 2: 沉默与逃避
- 因子 3: 家庭时间与亲密感
- 因子 4: 自我辩护与指责
python
print(pd.DataFrame(fa.get_factor_variance(),index=['Variance','Proportional Var','Cumulative Var']))
因子得分
python
factor_scores = fa.transform(data)
# 将因子得分添加到原始数据框
factor_score_columns = [
    'Marital_Harmony_Common_Goals',  # 因子 0
    'Conflict_Negative_Emotions',    # 因子 1
    'Silence_Avoidance',             # 因子 2
    'Family_Time_Intimacy',          # 因子 3
    'Self_Defense_Blame'             # 因子 4
]

# 将因子得分转换为dataFrame类型
factor_scores_df = pd.DataFrame(factor_scores, columns=factor_score_columns)
factor_scores_df.to_csv('./factor_scores.csv')
3.预测模型
数据集划分
python
X = data.copy()
y = df['Divorce_Y_N'].copy()
X.shape, y.shape
python
from sklearn.decomposition import FactorAnalysis
from sklearn.model_selection import cross_val_score
from sklearn.linear_model import LogisticRegression
transformer = FactorAnalysis(n_components=5, random_state=0)
X_transformed = transformer.fit_transform(X)
X_transformed.shape
python
from sklearn.model_selection import train_test_split

X_train, X_test, y_train, y_test = train_test_split(X_transformed,y,test_size=0.5,stratify=y,random_state=100)
X_train.shape, X_test.shape, y_train.shape, y_test.shape
逻辑回归
训练
python
model = LogisticRegression(random_state=1)
model.fit(X_trai0n,y_train)
python
y_pred = model.predict(X_test)
model.coef_
因子0是预测离婚的最重要特征
模型评估
python
from sklearn.metrics import classification_report

print(classification_report(y_test, y_pred))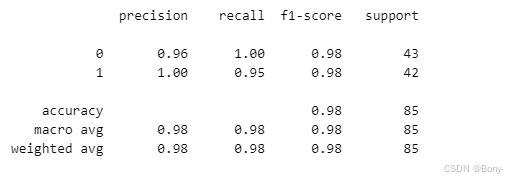
python
from sklearn.metrics import confusion_matrix

#  混淆矩阵可视化
plt.figure(figsize=(6, 4))
sns.heatmap(confusion_matrix(y_test, y_pred), annot=True, fmt='d', cmap='Blues')
plt.title("Confusion Matrix")
plt.xlabel("Predicted")
plt.ylabel("Actual")
plt.show()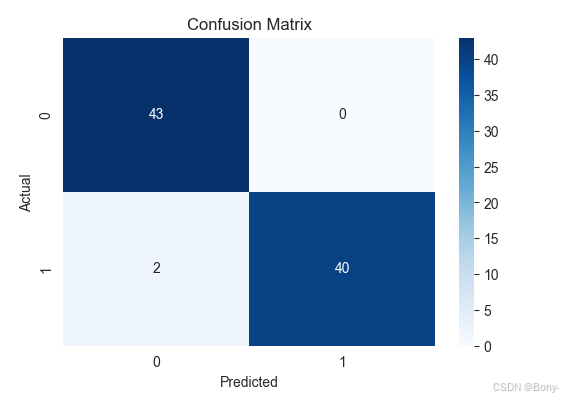
python
from sklearn.metrics import accuracy_score

train_acc = []
test_acc = []
cv_scores = []

for f in range(2,54):
    transformer = FactorAnalysis(n_components=f, random_state=0)
    X_transformed = transformer.fit_transform(X)

    model = LogisticRegression()
    scores = cross_val_score(model,X_transformed,y,cv=5)
    cv_score = scores.mean()
    X_train, X_test, y_train, y_test = train_test_split(X_transformed,y,test_size=0.5,stratify=y,random_state=100)

    model.fit(X_train,y_train)

    y_pred_tr = model.predict(X_train)
    y_pred_ts = model.predict(X_test)

    tr_acc = accuracy_score(y_train,y_pred_tr)
    ts_acc = accuracy_score(y_test,y_pred_ts)

    train_acc.append(tr_acc)
    test_acc.append(ts_acc)
    cv_scores.append(cv_score)
python
pd.DataFrame({'factors':range(2,54),
              'train_acc':train_acc,
              'test_acc':test_acc,
              'cv_score':cv_scores}).set_index('factors').plot(figsize=(12,8))
plt.title("Factor analysis - Train acc vs Test acc vs CV score")
通过查看图表,最佳因子数目应该在5-14之间
此外,随着因子数量的持续增加,因字数在接近20的时候,训练集精度很高,但是与测试集、交叉验证集的差距变大,过拟合十分严重
4.对应分析
选择前4个因子,做五级分箱操作
数据分箱
python
scores_df = pd.read_csv('./factor_scores.csv',index_col=0)
scores_df.head()
python
 # 只取前四个因子
selected_factors = scores_df.iloc[:, :5]

 # 分箱操作(5 个箱子)
n_bins = 5
bin_labels = [f'Bin_{i+1}' for i in range(n_bins)]  # 箱子标签

binned_data = selected_factors.apply(lambda x: pd.qcut(x, q=n_bins, labels=bin_labels))
binned_data.head()
生成列联表
其中,contingency_tableij,表示第i个因子与第j个因子的列联表在这里插入代码片
python
contingency_table01 = pd.crosstab(binned_data['Marital_Harmony_Common_Goals'], binned_data['Conflict_Negative_Emotions'])
contingency_table01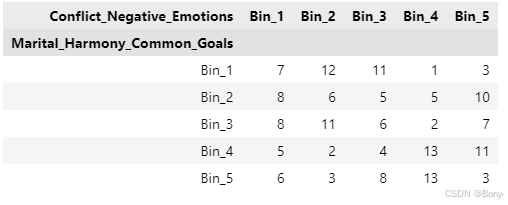
python
contingency_table02 = pd.crosstab(binned_data['Marital_Harmony_Common_Goals'], binned_data['Silence_Avoidance'])
contingency_table03 = pd.crosstab(binned_data['Marital_Harmony_Common_Goals'], binned_data['Family_Time_Intimacy'])
contingency_table04 = pd.crosstab(binned_data['Marital_Harmony_Common_Goals'], binned_data['Self_Defense_Blame'])
contingency_table12 = pd.crosstab(binned_data['Conflict_Negative_Emotions'], binned_data['Silence_Avoidance'])
contingency_table13 = pd.crosstab(binned_data['Conflict_Negative_Emotions'], binned_data['Family_Time_Intimacy'])
contingency_table14 = pd.crosstab(binned_data['Conflict_Negative_Emotions'], binned_data['Self_Defense_Blame'])
contingency_table23 = pd.crosstab(binned_data['Silence_Avoidance'], binned_data['Family_Time_Intimacy'])
contingency_table24 = pd.crosstab(binned_data['Silence_Avoidance'], binned_data['Self_Defense_Blame'])
contingency_table34 = pd.crosstab(binned_data['Family_Time_Intimacy'], binned_data['Self_Defense_Blame'])
进行卡方检验
python
import pandas as pd
from scipy.stats import chi2_contingency

contingency_tables = {
    '01': contingency_table01,
    '02': contingency_table02,
    '03': contingency_table03,
    '04': contingency_table04,
    '12': contingency_table12,
    '13': contingency_table13,
    '14': contingency_table14,
    '23': contingency_table23,
    '24': contingency_table24,
    '34': contingency_table34
}

# 初始化结果存储
results = []

# 遍历所有列联表,计算卡方值和 p 值
for key, table in contingency_tables.items():
    chi2, p, dof, expected = chi2_contingency(table)
    results.append({
        'Factor Pair': f'Factor {key[0]} & Factor {key[1]}',
        'Chi-squared': chi2,
        'P-value': p
    })

# 将结果转换为数据框
results_df = pd.DataFrame(results)
results_df.to_csv('chi2_results.csv', index=False)
# 查看结果
results_df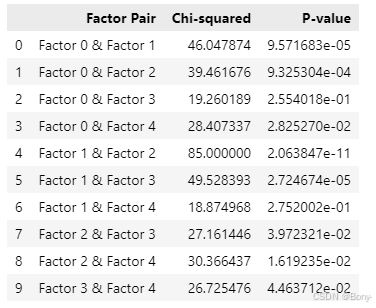
表格不够直观,绘制热力图展示
python
import seaborn as sns
import matplotlib.pyplot as plt

# 将 Factor Pair 拆分为两个单独的列
results_df[['Factor 1', 'Factor 2']] = results_df['Factor Pair'].str.extract(r'Factor (\d) & Factor (\d)')

# 创建一个矩阵,用于存储 p 值
factor_pairs = results_df.pivot(index='Factor 1', columns='Factor 2', values='P-value')

# 绘制热力图
plt.figure(figsize=(8, 6))
sns.heatmap(
    factor_pairs,
    annot=True,  # 在热力图中显示数值
    fmt=".2f",   # 数值格式
    cmap='YlGnBu',  # 颜色映射
    linewidths=0.5,  # 单元格之间的线条宽度
    cbar_kws={'label': 'P-value'}  # 颜色条标签
)

# 添加标题和标签
plt.title('P-value Heatmap of Factor Pairs', fontsize=14)
plt.xlabel('Factor A', fontsize=12)
plt.ylabel('Factor B', fontsize=12)

# 显示热力图
plt.show()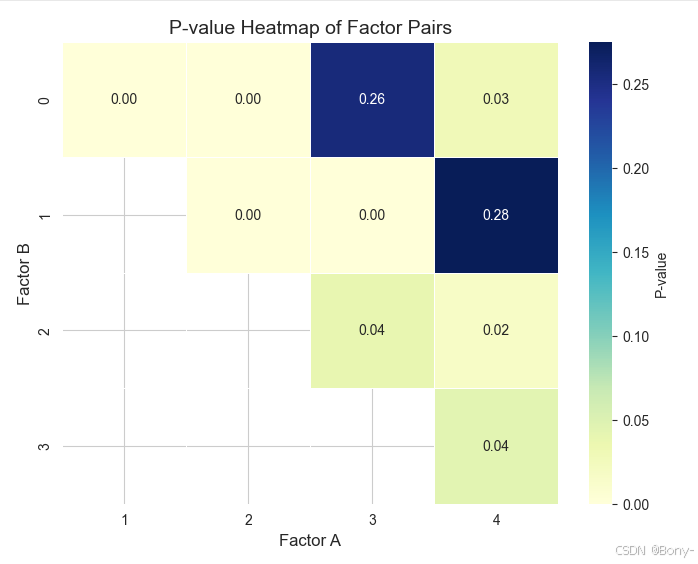
根据上图可以直观地看出,第0个与第3个因子、第1个与第4个因子之间的p值>0.05,拒绝原假设。没有足够的证据表明0-3、1-4因子之间存在关联,在统计上是独立的。
所以,对第0个与第3个因子、第1个与第4个因子分别做对应分析。
计算Z矩阵
python
p_matrix03 = contingency_table03.div(contingency_table03.sum(axis=1), axis=0)
p_matrix14 = contingency_table14.div(contingency_table14.sum(axis=1), axis=0)
python
p_matrix03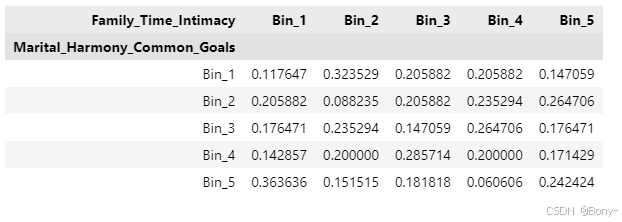
python
# 绘制堆叠柱状图
p_matrix03.plot(kind='bar', stacked=True, width=0.8, figsize=(12, 8), cmap='YlGnBu')

# 设置标题和轴标签
plt.title('Stacked Bar Plot of Marital Harmony vs Family Time Intimacy', fontsize=14)
plt.xlabel('Marital_Harmony_Common_Goals', fontsize=12)

# 显示图例
plt.legend(title='Family_Time_Intimacy', bbox_to_anchor=(1.05, 1), loc='upper left')

# 调整布局
plt.tight_layout()

# 显示图形
plt.show()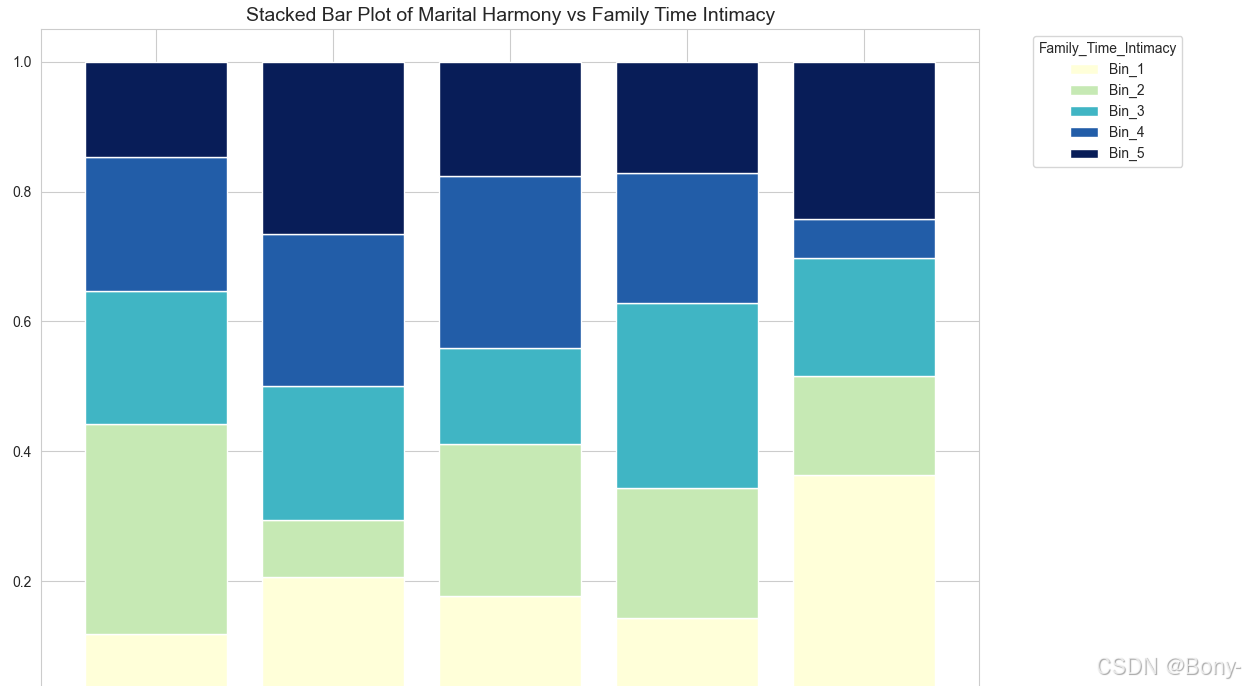
python
p_matrix14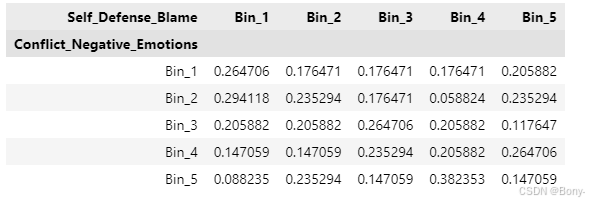
python
# 绘制堆叠柱状图
p_matrix14.plot(kind='bar', stacked=True, width=0.8, figsize=(12, 8), cmap='YlGnBu')

# 设置标题和轴标签
plt.title('Stacked Bar Plot of  Self_Defense_Blame vs Conflict_Negative_Emotions', fontsize=14)
plt.xlabel('Self_Defense_Blame', fontsize=12)

# 显示图例
plt.legend(title='Conflict_Negative_Emotions', bbox_to_anchor=(1.05, 1), loc='upper left')

# 调整布局
plt.tight_layout()

# 显示图形
plt.show()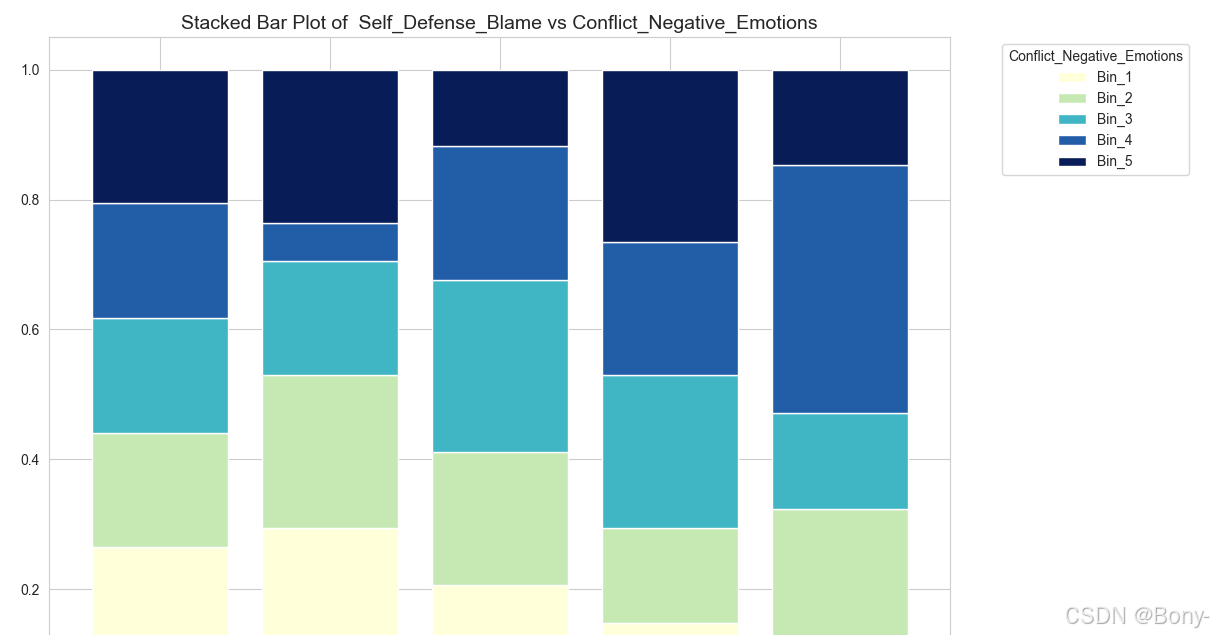
计算惯量占比
python
def create_summary_table(p_matrix):
    A=np.dot(p_matrix.T,p_matrix).astype(float)
    Lambda,u=np.linalg.eig(A)  # A的特征值和特征向量
    summary_table=pd.DataFrame(sorted([i for i in Lambda if i>0],reverse=True),columns=['主惯量'])
    summary_table['奇异值']=np.sqrt(summary_table['主惯量'])
    summary_table['占比']=summary_table['主惯量']/summary_table['主惯量'].sum()
    summary_table['累计']=summary_table['占比'].cumsum()
    return summary_table
python
summary_table03 = create_summary_table(p_matrix03)
summary_table03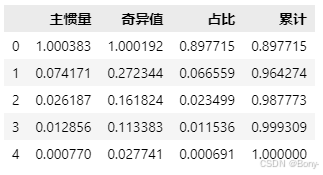
python
# 提取数据
x = summary_table03.index+1  # 横轴:维度
y = summary_table03['占比']    # 纵轴:贡献率

# 绘制碎石图
plt.figure(figsize=(8, 6))
plt.plot(x, y, marker='o', linestyle='-', color=(0.10, 0.10, 0.44))

# 设置标题和标签
plt.title('Scree Plot of Factor0 and Factor3', fontsize=16)
plt.xlabel('Dimension', fontsize=14)
plt.ylabel('Contribution Rate', fontsize=14)

# 设置横轴刻度为整数
plt.xticks(x)

plt.grid(True)

# 显示图表
plt.show()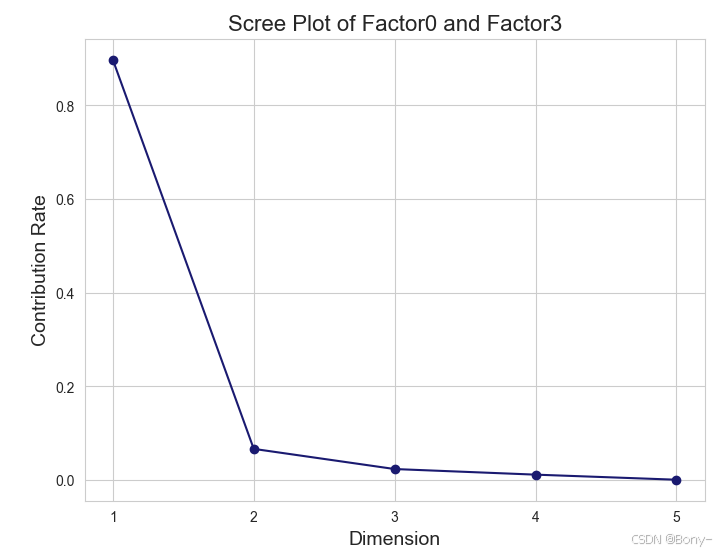
从碎石图可以看出,转折点在第二维。从汇总表可以看出,第一维和第二维的惯量占比占总惯量的96.4%,因此前两维解释了列联表数据96.4%的变异。所以使用可以仅使用前两维。
python
summary_table14 = create_summary_table(p_matrix14)
summary_table14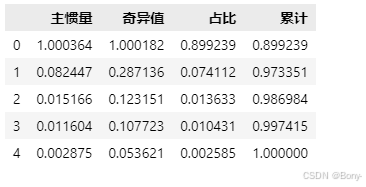
python
# 提取数据
x = summary_table14.index+1  # 横轴:维度
y = summary_table14['占比']    # 纵轴:贡献率

# 绘制碎石图
plt.figure(figsize=(8, 6))
plt.plot(x, y, marker='o', linestyle='-', color=(0.10, 0.10, 0.44))

# 设置标题和标签
plt.title('Scree Plot of Factor1 and Factor4', fontsize=16)
plt.xlabel('Dimension', fontsize=14)
plt.ylabel('Contribution Rate', fontsize=14)

# 设置横轴刻度为整数
plt.xticks(x)

plt.grid(True)

# 显示图表
plt.show()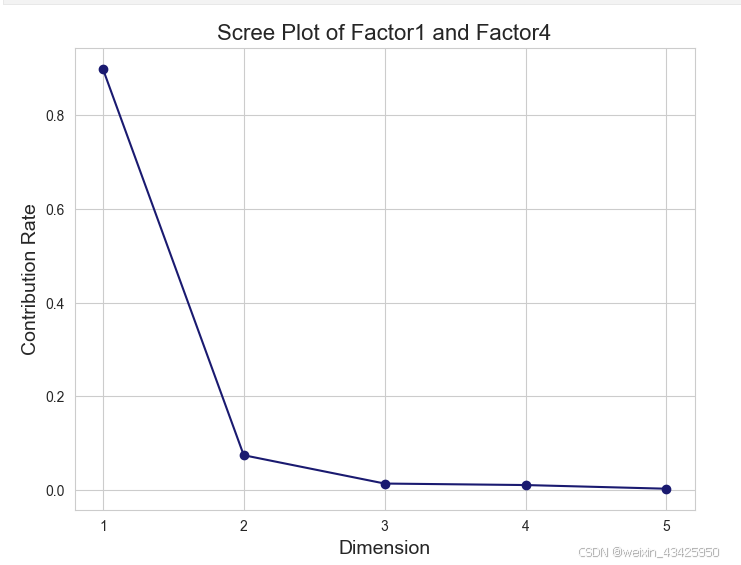
从碎石图可以看出,转折点在第二维。从汇总表中可以看出,第一维和第二维的惯量占比占总惯量的97.3%,因此前两维解释了列联表数据97.3%的变异
对Z矩阵奇异值分解,得载荷矩阵
python
import numpy as np
import pandas as pd

def calculate_factor_loadings(z_matrix):
    # 确保 z_matrix 是 NumPy 数组
    if isinstance(z_matrix, pd.DataFrame):
        z_matrix = z_matrix.values
    elif not isinstance(z_matrix, np.ndarray):
        raise ValueError("z_matrix 必须是 NumPy 数组或 Pandas 数据框。")

    # 进行奇异值分解 (SVD)
    U, S, Vt = np.linalg.svd(z_matrix, full_matrices=False)

    # 计算特征值(特征值是奇异值的平方)
    eigenvalues = S**2

    # 计算 Q 型因子载荷矩阵
    Q_loadings = pd.DataFrame(z_matrix.T @ U)

    # 计算 R 型因子载荷矩阵
    R_loadings = pd.DataFrame(z_matrix @ Vt)

    return Q_loadings, R_loadings, eigenvalues
python
Q_loadings_03, R_loadings_03,eigenvalues03 = calculate_factor_loadings(p_matrix03)
Q_loadings_14, R_loadings_14,eigenvalues14 = calculate_factor_loadings(p_matrix14)
python
Q_loadings_03.index = ['Marital_Harmony_Common_Goals0','Marital_Harmony_Common_Goals1','Marital_Harmony_Common_Goals2','Marital_Harmony_Common_Goals3','Marital_Harmony_Common_Goals4']
python
Q_loadings_03
python
Q_loadings_14.index = ['Conflict_Negative_Emotions0','Conflict_Negative_Emotions1','Conflict_Negative_Emotions2','Conflict_Negative_Emotions3','Conflict_Negative_Emotions4']
Q_loadings_14
python
R_loadings_03.index = ['Family_Time_Intimacy0','Family_Time_Intimacy1','Family_Time_Intimacy2','Family_Time_Intimacy3','Family_Time_Intimacy4']
python
R_loadings_14.index = ['Self_Defense_Blame0','Self_Defense_Blame1','Self_Defense_Blame2','Self_Defense_Blame3','Self_Defense_Blame4']绘制二维图像
python
def plot_correspondence_analysis(Q_loadings, R_loadings, title='Correspondence Analysis', xlabel='Dimension 1', ylabel='Dimension 2'):
    # 只选取前两维
    Q_loadings_2d = Q_loadings.iloc[:, :2]
    R_loadings_2d = R_loadings.iloc[:, :2]

    # 获取标签
    Q_labels = Q_loadings.index
    R_labels = R_loadings.index

    # 创建图形
    plt.figure(figsize=(10, 8))

    # 绘制Q型因子载荷
    plt.scatter(Q_loadings_2d[0], Q_loadings_2d[1], color=(0.10, 0.10, 0.44), marker='o', label='Q-type Loadings', alpha=0.6)
    for i, txt in enumerate(Q_labels):
        plt.annotate(txt, (Q_loadings_2d[0][i], Q_loadings_2d[1][i]), fontsize=9, color='blue')

    # 绘制R型因子载荷
    plt.scatter(R_loadings_2d[0], R_loadings_2d[1], c='red', marker='*', label='R-type Loadings', alpha=0.6)
    for i, txt in enumerate(R_labels):
        plt.annotate(txt, (R_loadings_2d[0][i], R_loadings_2d[1][i]), fontsize=9, color='red')
    # 添加横轴 (y=0) 和纵轴 (x=0) 的黑色实线
    plt.axhline(0, color='black', linewidth=1, linestyle='-')  # 横轴
    plt.axvline(0, color='black', linewidth=1, linestyle='-')  # 纵轴

    # 设置标题和坐标轴标签
    plt.title(title, fontsize=16)
    plt.xlabel(xlabel, fontsize=14)
    plt.ylabel(ylabel, fontsize=14)

    # 添加图例
    plt.legend()

    plt.show()
python
plot_correspondence_analysis(Q_loadings_03,R_loadings_03)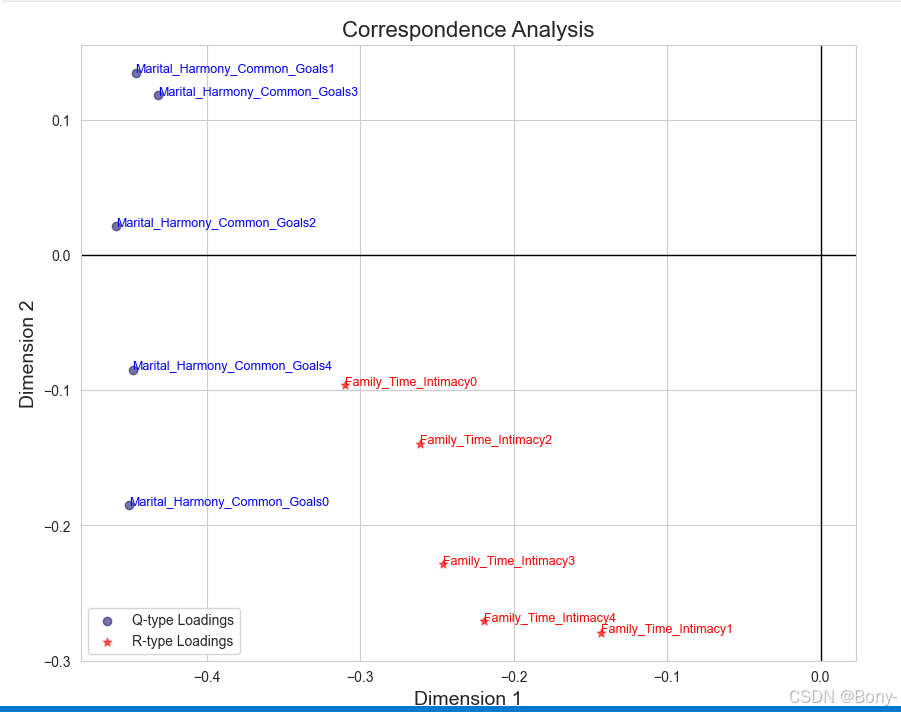
python
plot_correspondence_analysis(Q_loadings_14,R_loadings_14)写在后面,点二列相关系数的介绍与因子命名的依据
点二列相关系数(Point-Biserial Correlation)
1. 概述
点二列相关系数是一种用于衡量 连续变量 和 二分类变量 之间相关性的统计方法。它适用于以下场景:
- 一个变量是连续的(如问卷得分)。
- 另一个变量是二分类的(如是/否、成功/失败、离婚/未离婚等)。
点二列相关系数的取值范围为 [-1, 1]:
- 1:表示完全正相关。
- -1:表示完全负相关。
- 0:表示无相关性。
2. 公式
点二列相关系数的计算公式如下:
r p b = M 1 − M 0 s ⋅ p ⋅ ( 1 − p ) r_{pb} = \frac{M_1 - M_0}{s} \cdot \sqrt{p \cdot (1 - p)} rpb=sM1−M0⋅p⋅(1−p)
其中:
- M_1 :二分类变量中类别 1 对应的连续变量的均值。
- M_0 :二分类变量中类别 0 对应的连续变量的均值。
- s :连续变量的标准差。
- p :二分类变量中类别 1 的比例(即类别 1 的样本数占总样本数的比例)。
3. 公式解释
- M_1 - M_0 :表示二分类变量的两个类别在连续变量上的均值差异。差异越大,相关性越强。
- s :连续变量的标准差,用于标准化均值差异。
- \\sqrt{p \\cdot (1 - p)} :二分类变量的比例调整项,用于考虑类别分布对相关性的影响。
4. 应用场景
点二列相关系数常用于以下场景:
- 心理学研究:如衡量某种心理测试得分与是否患有某种心理疾病之间的相关性。
- 教育研究:如衡量学生考试成绩与是否通过考试之间的相关性。
- 社会学研究:如衡量收入水平与是否拥有某种社会地位之间的相关性。
5. 示例
假设我们有一个数据集,包含以下变量:
- 连续变量:问卷得分(0-4 分)。
- 二分类变量:是否离婚(0 = 未离婚,1 = 离婚)。
我们可以使用点二列相关系数来衡量问卷得分与是否离婚之间的相关性。
计算步骤:
- 计算离婚组(类别 1)和未离婚组(类别 0)的问卷得分均值 M_1 和 M_0 。
- 计算问卷得分的标准差 s 。
- 计算离婚组的比例 p 。
- 代入公式计算点二列相关系数 r_{pb} 。
结果解释:
- 如果 r_{pb} 接近 1,表示问卷得分越高,离婚的可能性越大。
- 如果 r_{pb} 接近 -1,表示问卷得分越高,离婚的可能性越小。
- 如果 r_{pb} 接近 0,表示问卷得分与是否离婚之间几乎没有相关性。
因子解释
根据因子载荷矩阵,归类因子:
因子 0: 婚姻和谐与共同目标
- 高载荷问题 :
Ignore_diff(0.799): I know we can ignore our differences, even if things get hard sometimes.
中文翻译: 我知道我们可以忽略我们的分歧,即使有时事情变得困难。freeom_value(0.828): My spouse and I have similar values in terms of personal freedom.
中文翻译: 我和配偶在个人自由方面有相似的价值观。marriage(0.837): My spouse and I have similar ideas about how marriage should be.
中文翻译: 我和配偶对婚姻应该如何有相似的看法。trust(0.804): My spouse and I have similar values in trust.
中文翻译: 我和配偶在信任方面有相似的价值观。people_goals(0.801): Most of our goals for people (children, friends, etc.) are the same.
中文翻译: 我们对人(孩子、朋友等)的目标大多相同。anxieties(0.805): I know my spouse's basic anxieties.
中文翻译: 我知道配偶的基本焦虑。common_goals(0.768): Most of our goals are common to my spouse.
中文翻译: 我们的大多数目标与配偶一致。love(0.773): We're compatible with my spouse about what love should be.
中文翻译: 我们在爱情应该如何方面与配偶相容。stresses(0.773): I can tell you what kind of stress my spouse is facing in her/his life.
中文翻译: 我可以告诉你配偶在生活中面临的压力。enjoy_holiday(0.779): I enjoy our holidays with my wife.
中文翻译: 我喜欢和妻子一起度假。harmony(0.719): I think that one day in the future, when I look back, I see that my spouse and I have been in harmony with each other.
中文翻译: 我认为有一天,当我回顾过去时,我会看到我和配偶一直和谐相处。begin_correct(0.685): When we need it, we can take our discussions with my spouse from the beginning and correct it.
中文翻译: 当我们需要时,我们可以从头开始与配偶讨论并纠正它。Contact(0.722): When I discuss with my spouse, to contact him will eventually work.
中文翻译: 当我与配偶讨论时,联系他最终会奏效。Special_time(0.660): The time I spent with my wife is special for us.
中文翻译: 我和妻子在一起的时间对我们来说是特别的。enjoy_travel(0.725): I enjoy traveling with my wife.
中文翻译: 我喜欢和妻子一起旅行。dreams(0.745): Our dreams with my spouse are similar and harmonious.
中文翻译: 我们和配偶的梦想相似且和谐。happy(0.705): We share the same views about being happy in our life with my spouse.
中文翻译: 我们对与配偶一起生活的幸福有相同的看法。roles(0.708): My spouse and I have similar ideas about how roles should be in marriage.
中文翻译: 我和配偶对婚姻中的角色有相似的看法。likes(0.678): I know exactly what my wife likes.
中文翻译: 我确切地知道妻子喜欢什么。care_sick(0.692): I know how my spouse wants to be taken care of when she/he sick.
中文翻译: 我知道配偶生病时希望如何被照顾。inner_world(0.649): I have knowledge of my spouse's inner world.
中文翻译: 我了解配偶的内心世界。current_stress(0.705): I know what my spouse's current sources of stress are.
中文翻译: 我知道配偶当前的压力来源。hopes_wishes(0.702): I know my spouse's hopes and wishes.
中文翻译: 我知道配偶的希望和愿望。know_well(0.654): I know my spouse very well.
中文翻译: 我非常了解我的配偶。friends_social(0.761): I know my spouse's friends and their social relationships.
中文翻译: 我知道配偶的朋友及其社交关系。
解释: 这些问题主要涉及婚姻中的和谐、共同目标、信任、情感支持以及对配偶的了解。因子0反映了婚姻中的积极因素和夫妻之间的默契。
因子 1: 冲突与负面情绪
- 高载荷问题 :
Aggro_argue(0.664): I feel aggressive when I argue with my spouse.
中文翻译: 当我和配偶争论时,我感到攻击性。Always_never(0.620): When discussing with my spouse, I usually use expressions such as 'you always' or 'you never'.
中文翻译: 当与配偶讨论时,我通常使用"你总是"或"你从不"这样的表达。negative_personality(0.694): I can use negative statements about my spouse's personality during our discussions.
中文翻译: 在讨论中,我可以使用关于配偶个性的负面陈述。offensive_expressions(0.746): I can use offensive expressions during our discussions.
中文翻译: 在讨论中,我可以使用冒犯性的表达。insult(0.684): I can insult my spouse during our discussions.
中文翻译: 在讨论中,我可以侮辱我的配偶。humiliate(0.677): I can be humiliating when we discussions.
中文翻译: 在讨论中,我可能会羞辱对方。not_calm(0.666): My discussion with my spouse is not calm.
中文翻译: 我和配偶的讨论不冷静。hate_subjects(0.633): I hate my spouse's way of open a subject.
中文翻译: 我讨厌配偶开启话题的方式。sudden_discussion(0.530): Our discussions often occur suddenly.
中文翻译: 我们的讨论经常突然发生。idk_what's_going_on(0.562): We're just starting a discussion before I know what's going on.
中文翻译: 在我知道发生了什么之前,我们就开始讨论了。calm_breaks(0.585): When I talk to my spouse about something, my calm suddenly breaks.
中文翻译: 当我和配偶谈论某事时,我的冷静突然被打破。you're_inadequate(0.663): When I discuss, I remind my spouse of her/his inadequacy.
中文翻译: 在讨论中,我会提醒配偶他/她的不足。incompetence(0.648): I'm not afraid to tell my spouse about her/his incompetence.
中文翻译: 我不怕告诉配偶他/她的无能。
解释: 这些问题主要涉及夫妻之间的冲突、负面情绪、争吵中的攻击性行为以及沟通中的不冷静。因子1反映了婚姻中的负面情绪和冲突。
因子 2: 沉默与逃避
- 高载荷问题 :
argue_then_leave(0.578): When I argue with my spouse, ı only go out and I don't say a word.
中文翻译: 当我和配偶争论时,我只出去,一句话也不说。silent_for_calm(0.795): I mostly stay silent to calm the environment a little bit.
中文翻译: 我大多保持沉默,以使环境稍微平静一些。good_to_leave_home(0.495): Sometimes I think it's good for me to leave home for a while.
中文翻译: 有时我认为离开家一段时间对我有好处。silence_instead_of_discussion(0.773): I'd rather stay silent than discuss with my spouse.
中文翻译: 我宁愿保持沉默,也不愿与配偶讨论。silence_for_harm(0.663): Even if I'm right in the discussion, I stay silent to hurt my spouse.
中文翻译: 即使我在讨论中是对的,我也会保持沉默以伤害配偶。silence_fear_anger(0.688): When I discuss with my spouse, I stay silent because I am afraid of not being able to control my anger.
中文翻译: 当我和配偶讨论时,我保持沉默,因为我害怕无法控制自己的愤怒。
解释: 这些问题主要涉及夫妻在冲突中的沉默、逃避行为以及为了避免冲突而选择离开或保持沉默。因子2反映了婚姻中的逃避行为。
因子 3: 家庭时间与亲密感
- 高载荷问题 :
No_home_time(0.574): We don't have time at home as partners.
中文翻译: 我们作为伴侣没有时间在家。2_strangers(0.567): We are like two strangers who share the same environment at home rather than family.
中文翻译: 我们就像两个陌生人,在家共享同一个环境,而不是家人。
解释: 这些问题主要涉及夫妻在家庭中的时间分配以及亲密感。因子3反映了夫妻在家庭中的亲密程度和时间分配。
因子 4: 自我辩护与指责
- 高载荷问题 :
I'm_right(0.424): I feel right in our discussions.
中文翻译: 在讨论中,我觉得自己是对的。accusations(0.350): I have nothing to do with what I've been accused of.
中文翻译: 我与被指控的事情无关。I'm_not_guilty(0.443): I'm not actually the one who's guilty about what I'm accused of.
中文翻译: 实际上,我并不是被指控的事情的罪魁祸首。I'm_not_wrong(0.533): I'm not the one who's wrong about problems at home.
中文翻译: 我不是家里问题的错误方。no_hesitancy_inadequate(0.185): I wouldn't hesitate to tell my spouse about her/his inadequacy.
中文翻译: 我会毫不犹豫地告诉配偶他/她的不足。you're_inadequate(0.192): When I discuss, I remind my spouse of her/his inadequacy.
中文翻译: 在讨论中,我会提醒配偶他/她的不足。
解释: 这些问题主要涉及夫妻在冲突中的自我辩护、指责以及对自己行为的合理化。因子4反映了婚姻中的自我辩护和指责行为。
python
# 完整代码以及数据集以下链接
https://mbd.pub/o/bread/mbd-Z52WlJhy