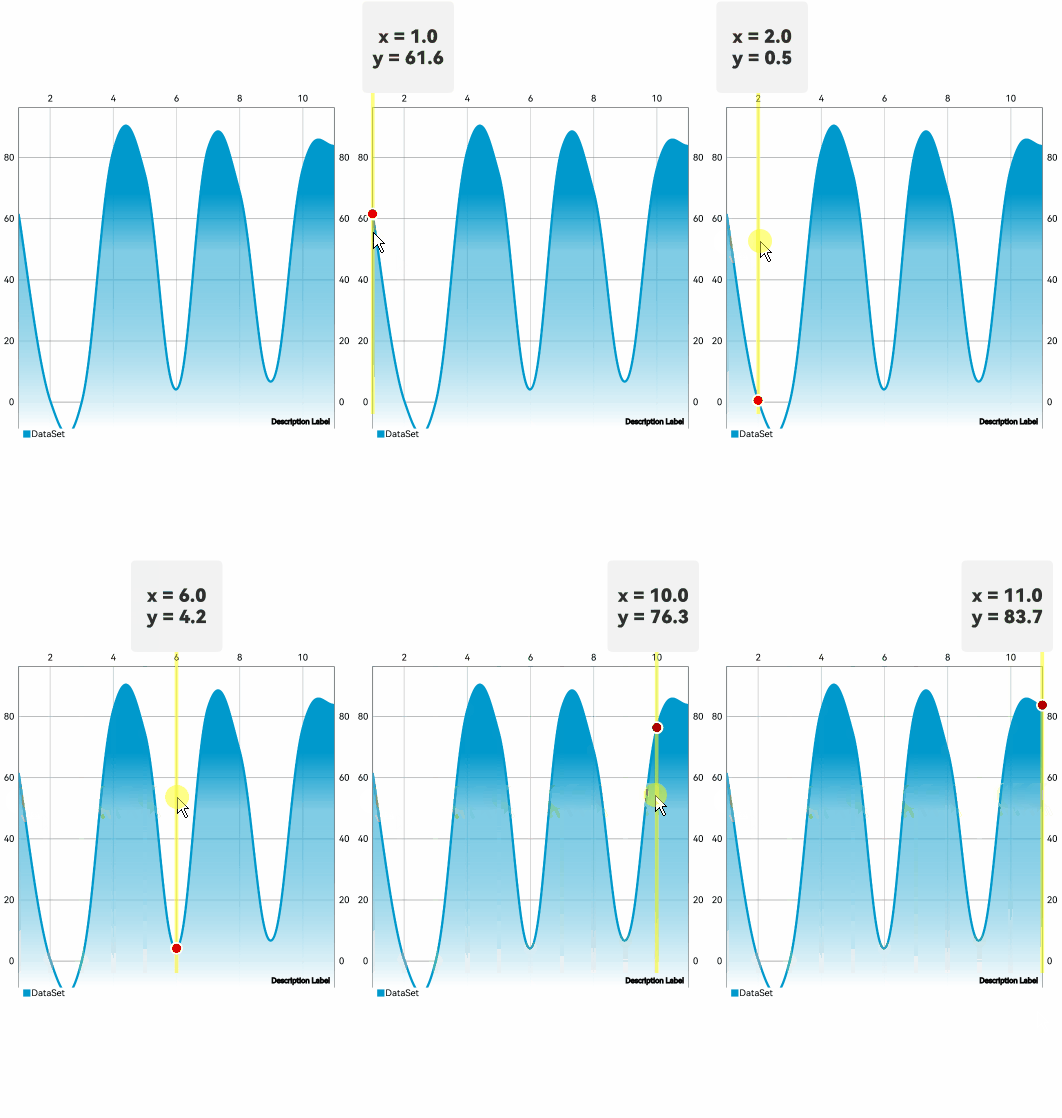
在鸿蒙开发中,MPChart 是一个非常强大的图表库,它可以帮助我们创建各种精美的图表。今天,我们将继续探索鸿蒙MPChart的自定义功能,重点介绍如何在图表中绘制游标。
一、效果演示
以下是效果演示图,从动图可以看出,这是一个渐变蓝色的曲线图表,通过手指在图表上点击或者长按住滑动,可以在图表顶部展示出数据点的基本信息。这个效果也比较简单,只需要通过自定义UI就可以轻松实现。

二、绘制游标的步骤
在鸿蒙MPChart中,绘制游标可以通过以下步骤实现:
1. 页面组件定义
TypeScript
@Entry
@Component
struct LongPressSlideCursorPage {
这里定义了一个名为 LongPressSlideCursorPage 的页面组件,使用了 @Entry 和 @Component 装饰器,表示这是一个可以独立运行的页面组件。
2. 状态变量定义
TypeScript
@State private lineChartModel: LineChartModel = new LineChartModel();
@State positionX: number = 0;
@State positionY: number = 0;
@State cursorPositionX: number = 0;
@State cursorPositionY: number = 0;
@State dataX: number = 0;
@State dataY: number = 0;
@State showUI: boolean = false;
@State uiWidth: number = 0;
cursorSize: number = 100;
这些是页面的状态变量,用于存储图表模型、选中点的位置信息、游标位置信息、选中点的数据信息、是否显示UI、UI的宽度和游标的大小。
3. 数据选择监听器
TypeScript
@State private valueSelectedListener: OnChartValueSelectedListener = {
  onValueSelected: (e: EntryOhos, h: Highlight) => {
    this.showUI = true;
    this.dataX = Number(e.getX().toFixed(1));
    this.dataY = Number(e.getY().toFixed(1));

    let x = this.lineChartModel.getTransformer(AxisDependency.LEFT)?.getPixelForValues(e.getX(), e.getY()).x ?? 0;
    let y = this.lineChartModel.getTransformer(AxisDependency.LEFT)?.getPixelForValues(e.getX(), e.getY()).y ?? 0;

    this.positionX = x;
    this.positionY = y;

    if (x > this.uiWidth - this.cursorSize / 2 - 10) {
      x = this.uiWidth - this.cursorSize / 2 - 10;
    } else if (x < this.cursorSize / 2 + 10) {
      x = this.cursorSize / 2 + 10;
    }
    this.cursorPositionX = x;
  },
  onNothingSelected: () => {
    this.showUI = false;
  }
}
这是一个数据选择监听器,用于处理图表上的数据选中事件。当用户选中一个数据点时,会显示一个UI来显示选中点的详细信息。同时,会计算并设置游标的位置。
4. 数据初始化
TypeScript
aboutToAppear() {
  this.uiWidth = px2vp(display.getDefaultDisplaySync().width);
  let values: JArrayList<EntryOhos> = new JArrayList<EntryOhos>();
  for (let i = 1; i <= 30; i++) {
    values.add(new EntryOhos(i, Math.random() * 100));
  }
  let lineDataSet = new LineDataSet(values, 'DataSet');
  lineDataSet.setMode(Mode.CUBIC_BEZIER);
  lineDataSet.setDrawCircles(false);
  let lineDataSetList: JArrayList<ILineDataSet> = new JArrayList<ILineDataSet>();

  //渐变色填充
  let gradientFillColor = new JArrayList<ChartColorStop>();
  gradientFillColor.add(["#0099CC", 0.2]);
  gradientFillColor.add(["#7F0099CC", 0.4]);
  gradientFillColor.add(["#ffffff", 1.0]);
  lineDataSet.setGradientFillColor(gradientFillColor);
  lineDataSet.setDrawFilled(true);

  //不显示数值
  lineDataSet.setDrawValues(false);
  //设置线条颜色
  lineDataSet.setColorByColor(0x0099cc);
  //设置不显示指示线
  lineDataSet.setDrawHighlightIndicators(false);
  lineDataSetList.add(lineDataSet);
  let lineData: LineData = new LineData(lineDataSetList);
  this.lineChartModel?.setData(lineData);
  this.lineChartModel.setOnChartValueSelectedListener(this.valueSelectedListener);
  this.lineChartModel.setHighlightPerLongPressEnabled(false);

  this.lineChartModel.setVisibleXRangeMaximum(10);
  this.lineChartModel.setSwipeEnabled(true);
  //设置长按出游标 和 触发长按的时长
  this.lineChartModel.setLongPressCursorEnabled(true);
  this.lineChartModel.setLongPressDuration(160);

}
在页面即将显示时,这段代码会初始化图表的数据。它创建了一个包含随机数据的 LineDataSet,设置了数据集的样式,如渐变填充颜色、不显示数据点等。然后将数据集添加到 LineData 对象中,并将其设置到图表模型中。同时,设置了图表的一些属性,如最大显示X轴范围、是否允许滑动、长按持续时间等。
5. 页面构建
TypeScript
build() {
  Stack() {
    LineChart({ model: this.lineChartModel })
      .width('100%')
      .height('50%')
      .backgroundColor(Color.White)
      .margin({ top: 100 })
    if (this.showUI) {
      Line().startPoint([0, 0]).endPoint([0, this.lineChartModel.getContentRect().height()+ 100]).stroke(Color.Yellow).strokeWidth(4).position({ x: this.positionX }).opacity(0.5)
      Column() {
        Text(`x = ${this.dataX.toFixed(1).toString()}`)
          .fontSize(20)
          .fontWeight(FontWeight.Bolder)
        Text(`y = ${this.dataY.toString()}`)
          .fontSize(20)
          .fontWeight(FontWeight.Bolder)
      }
      .alignItems(HorizontalAlign.Center)
      .justifyContent(FlexAlign.Center)
      .backgroundColor('#F2F2F2')
      .position({ x: this.cursorPositionX - this.cursorSize / 2 })
      .width(this.cursorSize)
      .aspectRatio(1)
      .borderRadius(5)
      Circle({ width: 14, height: 14 }).position({ x: this.positionX - 7, y: this.positionY + 100 - 7}).fill(Color.White)
      Circle({ width: 10, height: 10 }).position({ x: this.positionX - 5, y: this.positionY + 100 - 5}).fill(Color.Red)
    }
  }
}
这段代码构建了页面的布局。首先是一个 LineChart 组件,用于显示图表。当 showUI 为 true 时,会显示一个垂直线、一个包含选中点数据的文本列、一个圆形游标和一个红色的点,以突出显示选中的数据点。
页面完整代码如下:
TypeScript
import {
  JArrayList,
  EntryOhos,
  ILineDataSet,
  LineData,
  LineChart,
  LineChartModel,
  Mode,
  LineDataSet,
  XAxisPosition,
  OnChartValueSelectedListener,
  Highlight,
  AxisDependency,
  ChartColorStop,
} from '@ohos/mpchart';
import display from '@ohos.display';

/** CursorPage组件 */
@Entry
@Component
struct LongPressSlideCursorPage {
  /** LineChart 图表配置构建类 */
  @State private lineChartModel: LineChartModel = new LineChartModel();
  /** 选中点位置信息 */
  @State positionX: number = 0;
  @State positionY: number = 0;

  /**游标位置信息*/
  @State cursorPositionX: number = 0;
  @State cursorPositionY: number = 0;

  /** 选中点X轴数据信息*/
  @State dataX: number = 0;
  /** 选中点Y轴数据信息 */
  @State dataY: number = 0;
  /** 是否展示UI */
  @State showUI: boolean = false;
  /** UI宽度 */
  @State uiWidth: number = 0;
  /** UI高度 */
  @State uiHeight: number = 0;
  /**游标宽高**/
  cursorSize: number = 100;
  /** 数据选择监听 */
  private valueSelectedListener: OnChartValueSelectedListener = {
    onValueSelected: (e: EntryOhos, h: Highlight) => {
      /** 数据选中时显示气泡UI */
      this.showUI = true;
      /** 设置选中点的位置信息和数据信息 */
      this.dataX = Number(e.getX().toFixed(1));
      this.dataY = Number(e.getY().toFixed(1));

      let x = this.lineChartModel.getTransformer(AxisDependency.LEFT)?.getPixelForValues(e.getX(), e.getY()).x ?? 0;
      let y = this.lineChartModel.getTransformer(AxisDependency.LEFT)?.getPixelForValues(e.getX(), e.getY()).y ?? 0;

      this.positionX = x;
      this.positionY = y;
      if (x > this.uiWidth - this.cursorSize / 2 - 10) {
        x = this.uiWidth - this.cursorSize / 2 - 10;
      } else if (x < this.cursorSize / 2 + 10) {
        x = this.cursorSize / 2 + 10
      }
      this.cursorPositionX = x;
    },
    onNothingSelected: () => {
      /** 去除气泡UI */
      this.showUI = false;
    }
  }

  /** 数据初始化 */
  aboutToAppear() {
    this.uiWidth = px2vp(display.getDefaultDisplaySync().width);
    /** 创建一个 JArrayList 对象,用于存储 EntryOhos 类型的数据 */
    let values: JArrayList<EntryOhos> = new JArrayList<EntryOhos>();
    /** 循环生成 1 到 20 的随机数据,并添加到 values 中 */
    for (let i = 1; i <= 30; i++) {
      values.add(new EntryOhos(i, Math.random() * 100));
    }
    /** 创建 LineDataSet 对象,使用 values 数据,并设置数据集的名称为 'DataSet' */
    let lineDataSet = new LineDataSet(values, 'DataSet');
    lineDataSet.setMode(Mode.CUBIC_BEZIER);
    lineDataSet.setDrawCircles(false);
    let lineDataSetList: JArrayList<ILineDataSet> = new JArrayList<ILineDataSet>();
    //渐变色填充
    let gradientFillColor = new JArrayList<ChartColorStop>();
    gradientFillColor.add(["#0099CC", 0.2]);
    gradientFillColor.add(["#7F0099CC", 0.4]);
    gradientFillColor.add(["#ffffff", 1.0]);
    lineDataSet.setGradientFillColor(gradientFillColor);
    lineDataSet.setDrawFilled(true);
    lineDataSet.setDrawValues(false);
    lineDataSet.setColorByColor(0x0099cc);
    lineDataSet.setDrawHighlightIndicators(false);
    lineDataSetList.add(lineDataSet);
    /** 创建 LineData 对象,使用 lineDataSetList 数据,并将其传递给 lineChartModel */
    let lineData: LineData = new LineData(lineDataSetList);
    this.lineChartModel?.setData(lineData);
    this.lineChartModel.setOnChartValueSelectedListener(this.valueSelectedListener);
    this.lineChartModel.setHighlightPerLongPressEnabled(false);

    this.lineChartModel.setVisibleXRangeMaximum(10);
    this.lineChartModel.setSwipeEnabled(true);
    this.lineChartModel.setLongPressDuration(160);
    this.lineChartModel.setLongPressCursorEnabled(true);
  }

  build() {
    Stack() {
      LineChart({ model: this.lineChartModel })
        .width('100%')
        .height('50%')
        .backgroundColor(Color.White)
        .margin({ top: 100 })
      if (this.showUI) {
        Line().startPoint([0, 0]).endPoint([0, this.lineChartModel.getContentRect().height()+ 100]).stroke(Color.Yellow).strokeWidth(4).position({ x: this.positionX }).opacity(0.5)
        Column() {
          Text(`x = ${this.dataX.toFixed(1).toString()}`)
            .fontSize(20)
            .fontWeight(FontWeight.Bolder)
          Text(`y = ${this.dataY.toString()}`)
            .fontSize(20)
            .fontWeight(FontWeight.Bolder)
        }
        .alignItems(HorizontalAlign.Center)
        .justifyContent(FlexAlign.Center)
        .backgroundColor('#F2F2F2')
        .position({ x: this.cursorPositionX - this.cursorSize / 2 })
        .width(this.cursorSize)
        .aspectRatio(1)
        .borderRadius(5)
        Circle({ width: 14, height: 14 }).position({ x: this.positionX - 7, y: this.positionY + 100 - 7}).fill(Color.White)
        Circle({ width: 10, height: 10 }).position({ x: this.positionX - 5, y: this.positionY + 100 - 5}).fill(Color.Red)
      }
    }
  }
}
三、总结
这段代码通过定义状态变量、数据选择监听器、数据初始化和页面构建,实现了在鸿蒙应用中绘制带有游标的折线图。用户可以通过长按图表来选中数据点,并显示相关的详细信息。这种交互方式提高了图表的可用性和用户体验。希望这篇文章能帮助你在鸿蒙开发中更好地使用MPChart图表库。