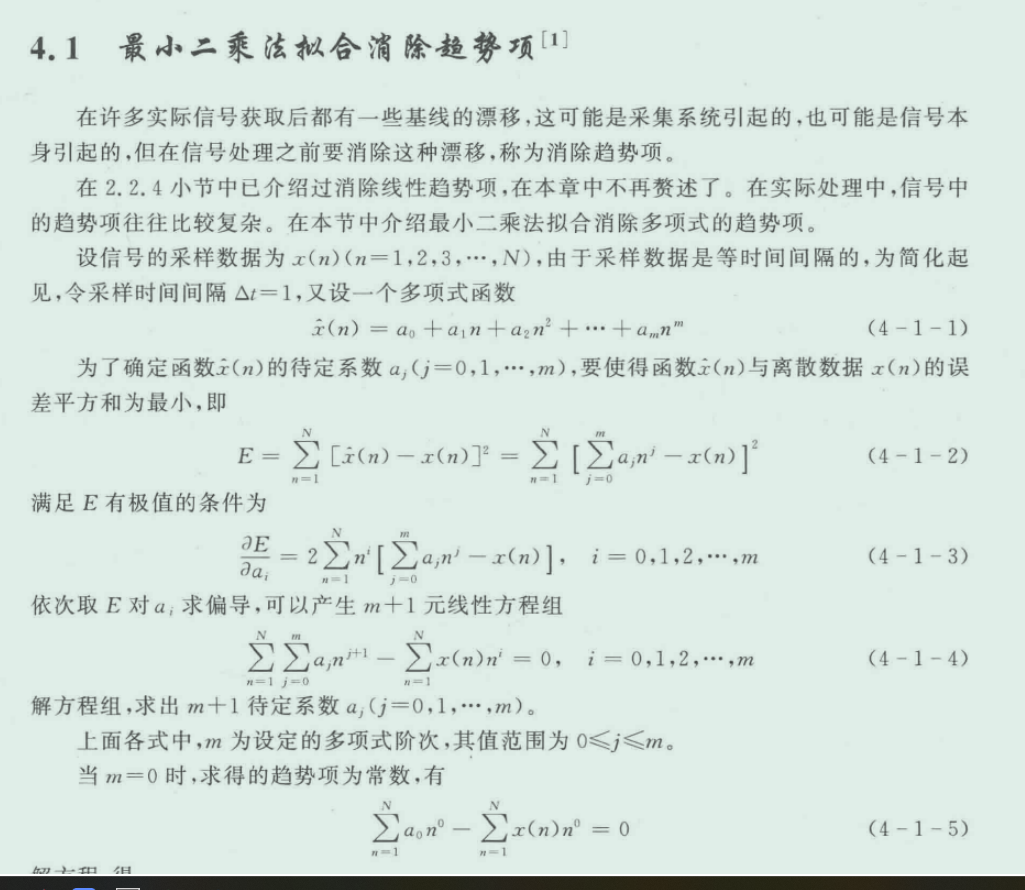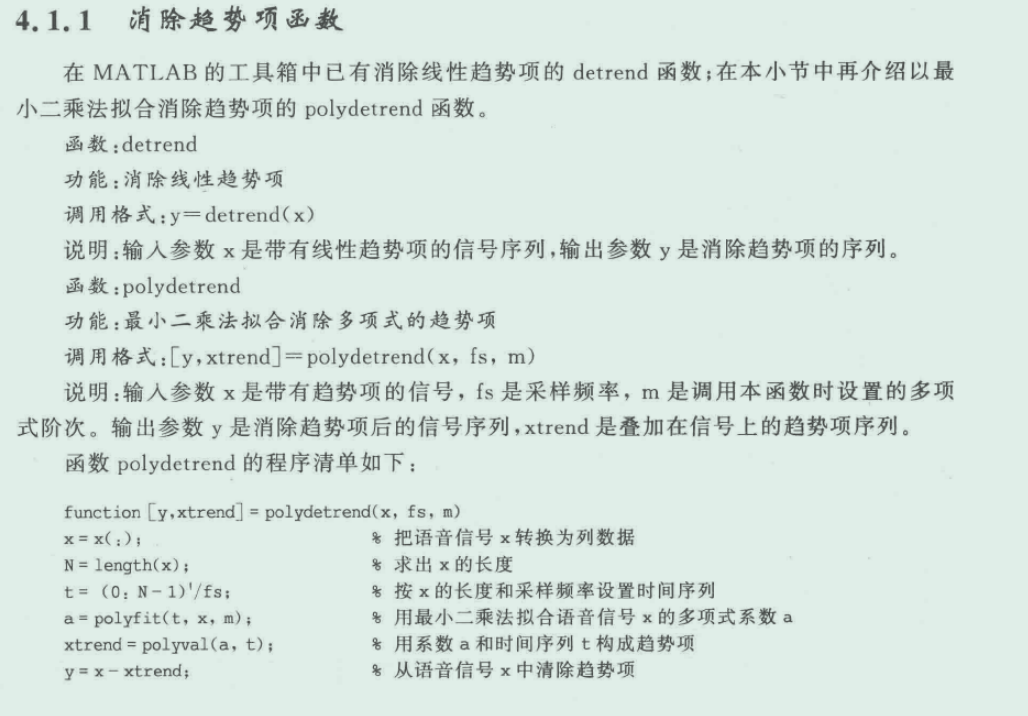
matlab 版本

python 版本
python
import numpy as np
import matplotlib.pyplot as plt
from matplotlib import rcParams

# 设置中文字体
rcParams['font.sans-serif'] = ['SimHei']  # 设置默认字体为黑体
rcParams['axes.unicode_minus'] = False  # 解决负号显示问题

def compute_time(n, fs):
    """生成时间序列"""
    return np.arange(n) / fs

def trend_remove(s, fs, m=2):
    """去除信号中的趋势项"""
    x = compute_time(len(s), fs)
    param = np.polyfit(x, s, m)  # 用m次多项式拟合
    s_poly_func = np.poly1d(param)  # 生成多项式函数
    s_poly = s_poly_func(x)  # 计算多项式值
    return s - s_poly  # 去除趋势项

# 创建一个带二次趋势的信号
fs = 100  # 采样频率
t = compute_time(1000, fs)  # 时间序列
quadratic_trend = 0.01 * t**2 + 0.5 * t  # 二次趋势
signal = np.sin(2 * np.pi * 5 * t) + quadratic_trend  # 信号 = 正弦波 + 二次趋势

# 去除趋势项
signal_detrended = trend_remove(signal, fs, m=2)  # 使用二次多项式去除趋势

# 可视化结果
plt.figure(figsize=(10, 6))
plt.plot(t, signal, label="原始信号 (带趋势)")
plt.plot(t, signal_detrended, label="去除趋势后的信号", linestyle="--")
plt.legend()
plt.xlabel("时间 (s)")
plt.ylabel("幅值")
plt.title("信号去趋势验证 (m=2)")
plt.grid()
plt.show()