html代码
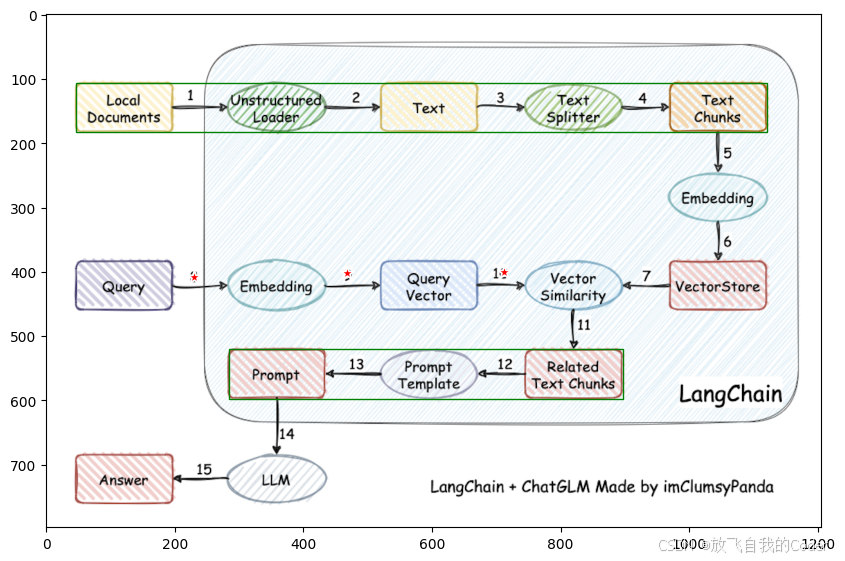
注意修改图片地址,坐标会保存为`coordinates.json`
html
<!DOCTYPE html>
<html lang="en">
  <head>
    <meta charset="UTF-8" />
    <meta name="viewport" content="width=device-width, initial-scale=1.0" />
    <title>Image Click and Drag Selection</title>
    <style>
      body {
        font-family: Arial, sans-serif;
        display: flex;
        flex-direction: column;
        align-items: center;
        justify-content: center;
        height: 100vh;
        margin: 0;
        background-color: rgba(197, 197, 197, 0.984);
        /* 20%透明度的红色填充 */
      }

      #image-container {
        position: relative;
        display: flex;
        justify-content: center;
        align-items: center;
        max-width: 90%;
        max-height: 90vh;
      }

      #image-container img {
        max-width: 100%;
        max-height: 100%;
        display: block;
      }

      #image-container .marker {
        position: absolute;
        width: 5px;
        height: 5px;
        background-color: rgba(255, 0, 0, 0.2);
        /* 20%透明度的红色填充 */
        border: 1px solid red;
        /* 红色轮廓 */
        border-radius: 50%;
        transform: translate(-50%, -50%);
      }

      #image-container .rectangle {
        position: absolute;
        border: 1.5px solid green;
        /* 绿色轮廓 */
        background-color: rgba(0, 255, 0, 0.2);
        /* 20%透明度的绿色填充 */
      }

      #coordinates {
        margin-top: 20px;
        font-size: 18px;
      }

      .button {
        padding: 10px 20px;
        font-size: 16px;
        cursor: pointer;
        background-color: #4caf50;
        color: white;
        border: none;
        border-radius: 5px;
        margin: 0 10px;
      }
      .button:hover {
        background-color: #45a049;
      }
      #button-container {
        display: flex;
        justify-content: center;
        margin-top: 20px;
      }
    </style>
  </head>

  <body>
    <div id="image-container">
      <img id="image" src="langchain+chatglm.png" alt="Sample Image" />
    </div>
    <div id="coordinates">Click or drag on the image to see coordinates.</div>
    <div id="button-container">
      <button id="save-button" class="button">Save Coordinates</button>
      <button id="clear-button" class="button">Clear All</button>
    </div>

    <script>
      const imageContainer = document.getElementById("image-container");
      const image = document.getElementById("image");
      const coordinatesDiv = document.getElementById("coordinates");
      const saveButton = document.getElementById("save-button");
      const clearButton = document.getElementById("clear-button");

      let isDragging = false;
      let startX, startY;
      let rectangle;
      let clickStartTime;
      let lastCoordinates = null;
      let coordinates = [];

      imageContainer.addEventListener("mousedown", (e) => {
        if (e.button === 0) {
          // Left mouse button
          const rect = image.getBoundingClientRect();
          startX = e.clientX - rect.left;
          startY = e.clientY - rect.top;

          // Record the start time of the click
          clickStartTime = Date.now();

          // Create a rectangle
          rectangle = document.createElement("div");
          rectangle.classList.add("rectangle");
          rectangle.style.left = `${startX}px`;
          rectangle.style.top = `${startY}px`;
          rectangle.style.width = "0";
          rectangle.style.height = "0";
          imageContainer.appendChild(rectangle);

          isDragging = true;
        }
      });

      imageContainer.addEventListener("mousemove", (e) => {
        if (isDragging) {
          const rect = image.getBoundingClientRect();
          const x = e.clientX - rect.left;
          const y = e.clientY - rect.top;

          // Get image dimensions
          const imageWidth = image.width;
          const imageHeight = image.height;

          // Limit coordinates to image boundaries
          const boundedX = Math.max(0, Math.min(x, imageWidth));
          const boundedY = Math.max(0, Math.min(y, imageHeight));

          // Update rectangle dimensions
          const width = Math.abs(boundedX - startX);
          const height = Math.abs(boundedY - startY);
          rectangle.style.left = `${Math.min(boundedX, startX)}px`;
          rectangle.style.top = `${Math.min(boundedY, startY)}px`;
          rectangle.style.width = `${width}px`;
          rectangle.style.height = `${height}px`;
        }
      });

      imageContainer.addEventListener("mouseup", (e) => {
        if (isDragging && e.button === 0) {
          const rect = image.getBoundingClientRect();
          const endX = e.clientX - rect.left;
          const endY = e.clientY - rect.top;

          const clickDuration = Date.now() - clickStartTime;

          // Get image dimensions
          const imageWidth = image.width;
          const imageHeight = image.height;

          // Limit coordinates to image boundaries
          const boundedEndX = Math.max(0, Math.min(endX, imageWidth));
          const boundedEndY = Math.max(0, Math.min(endY, imageHeight));

          if (clickDuration < 200) {
            // Short click (click)
            // Remove the rectangle
            imageContainer.removeChild(rectangle);

            // Place a marker
            const marker = document.createElement("div");
            marker.classList.add("marker");
            marker.style.left = `${startX}px`;
            marker.style.top = `${startY}px`;
            imageContainer.appendChild(marker);

            // Calculate percentage coordinates
            const percentX = ((startX / imageWidth) * 100).toFixed(2);
            const percentY = ((startY / imageHeight) * 100).toFixed(2);

            coordinatesDiv.textContent = `Clicked at: (${percentX}%, ${percentY}%)`;
            lastCoordinates = { type: "click", x: percentX, y: percentY };
            coordinates.push({ type: "click", x: percentX, y: percentY });
          } else {
            // Long click (drag)
            const x1 = Math.min(startX, boundedEndX);
            const y1 = Math.min(startY, boundedEndY);
            const x2 = Math.max(startX, boundedEndX);
            const y2 = Math.max(startY, boundedEndY);

            // Calculate percentage coordinates
            const percentX1 = ((x1 / imageWidth) * 100).toFixed(2);
            const percentY1 = ((y1 / imageHeight) * 100).toFixed(2);
            const percentX2 = ((x2 / imageWidth) * 100).toFixed(2);
            const percentY2 = ((y2 / imageHeight) * 100).toFixed(2);

            coordinatesDiv.textContent = `Rectangle: (${percentX1}%, ${percentY1}%) to (${percentX2}%, ${percentY2}%)`;
            lastCoordinates = {
              type: "rectangle",
              x1: percentX1,
              y1: percentY1,
              x2: percentX2,
              y2: percentY2,
            };
            coordinates.push({
              type: "rectangle",
              x1: percentX1,
              y1: percentY1,
              x2: percentX2,
              y2: percentY2,
            });
          }

          isDragging = false;
        }
      });

      imageContainer.addEventListener("mouseleave", () => {
        if (isDragging) {
          isDragging = false;
          imageContainer.removeChild(rectangle);
        }
      });

      saveButton.addEventListener("click", () => {
        if (lastCoordinates) {
          const json = JSON.stringify(coordinates, null, 2);
          const blob = new Blob([json], { type: "application/json" });
          const url = URL.createObjectURL(blob);
          const a = document.createElement("a");
          a.href = url;
          a.download = "coordinates.json";
          a.click();
          URL.revokeObjectURL(url);
        } else {
          alert("No coordinates to save.");
        }
      });
      clearButton.addEventListener("click", () => {
        coordinates = [];
        const markers = imageContainer.querySelectorAll(".marker, .rectangle");
        markers.forEach((marker) => marker.remove());
      });
    </script>
  </body>
</html>
页面
页面
coordinates.json 示例
python
[
  {
    "type": "rectangle",
    "x1": "3.81",
    "y1": "13.35",
    "x2": "92.95",
    "y2": "22.87"
  },
  {
    "type": "click",
    "x": "19.07",
    "y": "51.07"
  },
  {
    "type": "click",
    "x": "38.81",
    "y": "50.31"
  },
  {
    "type": "click",
    "x": "59.04",
    "y": "50.19"
  },
  {
    "type": "rectangle",
    "x1": "23.55",
    "y1": "65.10",
    "x2": "74.38",
    "y2": "74.87"
  }
]
处理代码
python
import json
import matplotlib.pyplot as plt
import numpy as np
import torch
import matplotlib.pyplot as plt
from PIL import Image

np.random.seed(3)
显示代码
python
def show_mask(mask, ax, random_color=False, borders=True):
    if random_color:
        color = np.concatenate([np.random.random(3), np.array([0.6])], axis=0)
    else:
        color = np.array([30 / 255, 144 / 255, 255 / 255, 0.6])
    h, w = mask.shape[-2:]
    mask = mask.astype(np.uint8)
    mask_image = mask.reshape(h, w, 1) * color.reshape(1, 1, -1)
    if borders:
        import cv2

        contours, _ = cv2.findContours(mask, cv2.RETR_EXTERNAL, cv2.CHAIN_APPROX_NONE)
        # Try to smooth contours
        contours = [
            cv2.approxPolyDP(contour, epsilon=0.01, closed=True) for contour in contours
        ]
        mask_image = cv2.drawContours(
            mask_image, contours, -1, (1, 1, 1, 0.5), thickness=2
        )
    ax.imshow(mask_image)


def show_points(coords, labels, ax, marker_size=375):
    pos_points = coords[labels == 1]
    neg_points = coords[labels == 0]
    ax.scatter(
        pos_points[:, 0],
        pos_points[:, 1],
        color="green",
        marker="*",
        s=marker_size,
        edgecolor="white",
        linewidth=1.25,
    )
    ax.scatter(
        neg_points[:, 0],
        neg_points[:, 1],
        color="red",
        marker="*",
        s=marker_size,
        edgecolor="white",
        linewidth=1.25,
    )


def show_box(box, ax, lw=2):
    x0, y0 = box[0], box[1]
    w, h = box[2] - box[0], box[3] - box[1]
    ax.add_patch(
        plt.Rectangle((x0, y0), w, h, edgecolor="green", facecolor=(0, 0, 0, 0), lw=lw)
    )

def show_boxs(boxs, ax, lw=2):
    for box in boxs:
        show_box(box, ax, lw=lw)


def show_masks(
    image,
    masks,
    scores,
    point_coords=None,
    box_coords=None,
    input_labels=None,
    borders=True,
):
    for i, (mask, score) in enumerate(zip(masks, scores)):
        plt.figure(figsize=(10, 10))
        plt.imshow(image)
        show_mask(mask, plt.gca(), borders=borders)
        if point_coords is not None:
            assert input_labels is not None
            show_points(point_coords, input_labels, plt.gca())
        if box_coords is not None:
            # boxes
            show_box(box_coords, plt.gca())
        if len(scores) > 1:
            plt.title(f"Mask {i+1}, Score: {score:.3f}", fontsize=18)
        plt.axis("off")
        plt.show()
python
image = Image.open("langchain+chatglm.png")
image = np.array(image.convert("RGB"))
H, W, C = image.shape
处理坐标数据
python
with open("coordinates.json", "r") as f:
    cors = json.load(f)
print(cors)
mmh = lambda x: max(min(x, H), 0)
mmw = lambda x: max(min(x, W), 0)
cors = [
    (
        {**c, "x": mmw(float(c["x"]) / 100 * W), "y": mmh(float(c["y"]) / 100 * H)}
        if c["type"] == "click"
        else {
            **c,
            "x1": mmw(float(c["x1"]) / 100 * W),
            "y1": mmh(float(c["y1"]) / 100 * H),
            "x2": mmw(float(c["x2"]) / 100 * W),
            "y2": mmh(float(c["y2"]) / 100 * H),
        }
    )
    for c in cors
]
cors
{'type': 'rectangle', 'x1': 45.9486, 'y1': 106.533, 'x2': 1120.977, 'y2': 182.5026}, {'type': 'click', 'x': 229.98420000000002, 'y': 407.53860000000003}, {'type': 'click', 'x': 468.0486, 'y': 401.4738}, {'type': 'click', 'x': 712.0224000000001, 'y': 400.5162}, {'type': 'rectangle', 'x1': 284.01300000000003, 'y1': 519.4979999999999, 'x2': 897.0227999999998, 'y2': 597.4626000000001}
python
input_point = np.array([[c['x'], c['y']] for c in cors if c['type']=='click'])
input_label = np.array([0] * len(input_point))
input_point, input_label(array(\[229.9842, 407.5386, 468.0486, 401.4738, 712.0224, 400.5162]), array(0, 0, 0))
matplotlib显示图片
python
plt.figure(figsize=(10, 10))
plt.imshow(image)
show_points(input_point, input_label, plt.gca(), marker_size=100)
show_boxs([[c['x1'], c['y1'],c['x2'], c['y2']] for c in cors if c['type']=='rectangle'], plt.gca(), lw=1)
plt.axis("on")
plt.show()