一、简单版本
- LineChart.tsx
javascript
// src/component/LineChart/LineChart.tsx
import React, {
  useEffect,
  useRef,
  useImperativeHandle,
  forwardRef,
  useMemo,
  useCallback,
} from 'react';
import * as echarts from 'echarts/core';
import type { ComposeOption } from 'echarts/core';
import type { LineSeriesOption } from 'echarts/charts';
import type {
  GridComponentOption,
  TooltipComponentOption,
  LegendComponentOption,
} from 'echarts/components';
import { SVGRenderer } from 'echarts/renderers';
import ResizeObserver from 'resize-observer-polyfill';
import classNames from 'classnames';
import { numberWithCommas } from '@/utils/numberWithCommas';
import './LineChart.css';

// 注册必要组件
const { LineChart: ELineChart } = require('echarts/charts');
const {
  GridComponent,
  TooltipComponent,
  LegendComponent,
} = require('echarts/components');

echarts.use([
  ELineChart,
  GridComponent,
  TooltipComponent,
  LegendComponent,
  SVGRenderer,
]);

type ECOption = ComposeOption<
    | LineSeriesOption
    | GridComponentOption
    | TooltipComponentOption
    | LegendComponentOption
>;

export interface IChartData {
  date: string;
  value: number | string;
}

interface ExtraDataItem {
  data: IChartData[];
  rgbColor: number[];
  colorPrefix?: string;
  labelPrefix?: string;
}

interface LineChartProps {
  data: IChartData[];
  extraData?: ExtraDataItem[];
  rgbColor?: number[];
  xAxisName?: string;
  yAxisName?: string;
  valueUnit?: string;
  isEmptyTipsVisible?: boolean;
  labelPrefix?: string;
  colorPrefix?: string;
  labelProcessor?: (data: IChartData) => string;
  renderTooltip?: (params: any) => string;
  name?: string;
  isOriginX?: boolean;
  height?: string;
  yAxisTextAlign?: 'left' | 'center' | 'right';
}

export interface LineChartHandle {
  showLoading: () => void;
  hideLoading: () => void;
  getInstance: () => echarts.ECharts | null;
}

const LineChart = forwardRef<LineChartHandle, LineChartProps>(({
  data,
  extraData = [],
  rgbColor = [255, 150, 0],
  xAxisName = '日期',
  yAxisName = '流水金额(元)',
  valueUnit = '元',
  isEmptyTipsVisible = false,
  labelPrefix,
  colorPrefix,
  labelProcessor,
  renderTooltip,
  name = 'tmp',
  isOriginX = false,
  height = '200px',
  yAxisTextAlign = 'center',
}, ref) => {
  const chartRef = useRef<HTMLDivElement>(null);
  const chartInstance = useRef<echarts.ECharts | null>(null);
  const observerRef = useRef<ResizeObserver | null>(null);

  // 修改后的x轴数据处理逻辑
  const xAxisData = useMemo(() => {
    const dataSources = [data, ...extraData.map(item => item.data)];
    const validData = dataSources.find(d => d?.length) || [];
    return validData.map((item: IChartData) =>
      (isOriginX
        ? item.date
        : item.date.split('-')[2]), // 直接取日期部分(第三个分割项)
    );
  }, [data, extraData, isOriginX]);

  // 修改系列配置保留完整数据对象
  const createSeries = useCallback((
    color: number[],
    seriesData: IChartData[],
    seriesName?: string,
  ): LineSeriesOption => ({
    name: seriesName || 'tmp',
    data: seriesData, // 保留完整数据对象
    type: 'line',
    encode: {
      x: 'date',  // 指定x轴字段
      y: 'value',  // 指定y轴字段
    },
    // 其他保持不变的配置...
    smooth: true,
    symbol: 'circle',
    symbolSize: 8,
    areaStyle: {
      color: {
        type: 'linear',
        x: 0,
        y: 0,
        x2: 0,
        y2: 1,
        colorStops: [
          { offset: 0, color: `rgba(${color.join(',')},0.7)` },
          { offset: 1, color: `rgba(${color.join(',')},0)` },
        ],
      },
    },
    itemStyle: {
      color: `rgb(${color.join(',')})`,
      borderColor: 'white',
      borderWidth: 2,
    },
  }), []);

  // 获取图表配置
  const getOptions = useCallback((): ECOption => {
    const yAxisCache: Record<string, boolean> = {};

    return {
      grid: {
        // left: 40,
        left: 60, // 增加左侧间距
        right: 30,
        bottom: 60, // 足够空间防止裁剪
        top: 40,
      },
      xAxis: {
        name: `{offset|${xAxisName}}`,
        nameLocation: 'end',
        nameGap: 5,
        nameTextStyle: {
          rich: {
            offset: {
              lineHeight: 24, // 增加行高实现下移
              padding: [8, 0, 0, 0], // 调整上边距
              align: 'center',
              color: '#999',
              fontSize: 12,
            },
          },
        },
        data: xAxisData,
        axisLine: {
          lineStyle: { width: 1, color: '#D5D9E0' },
        },
        axisLabel: { color: '#999' },
        axisTick: { alignWithLabel: true },
        axisPointer: {
          show: true,
          type: 'line',
          lineStyle: {
            type: 'dashed',
            color: `rgb(${rgbColor.join(',')})`,
          },
        },
      },
      yAxis: {
        name: yAxisName,
        nameTextStyle: {
          color: '#999',
          fontSize: 12,
          padding: [0, 0, 0, 0],
          align: yAxisTextAlign,
        },
        type: 'value',
        splitLine: {
          lineStyle: {
            color: '#E6E9F0',
            type: 'dashed',
          },
        },
        axisLine: { show: false },
        axisLabel: {
          color: '#999',
          margin: 0,
          interval: 1, // ✅ 正确间隔控制
          formatter: (value: number) => { // ✅ 移除index参数
            let result = String(value);
            if (value >= 1e8) result = `${(value / 1e8).toFixed(1)}亿`;
            else if (value >= 1e7) result = `${(value / 1e7).toFixed(1)}kw`;
            else if (value >= 1e4) result = `${(value / 1e4).toFixed(1)}w`;

            return `${result}${valueUnit}`; // ✅ 直接返回结果
          }
        },
        axisTick: { show: false },
      },
      // 在图表配置中修改tooltip配置项
      tooltip: {
        trigger: 'axis',
        backgroundColor: 'rgba(17,18,18,0.7)', // 加深背景色
        textStyle: {
          color: '#fff', // 明确设置字体颜色
          fontSize: 12,
          lineHeight: 17, // 增加行高
        },
        // 修改tooltip formatter部分
        formatter: (params: any) => {
          if (renderTooltip) return renderTooltip(params);
          const firstParam = params?.[0];
          if (!firstParam) return '';

          // 安全访问数据
          const dataIndex = firstParam.dataIndex;
          const dateValue = firstParam.data?.date || '';

          // 正确解析日期格式
          const [year, month, day] = dateValue.split('-');

          const partial = isOriginX
            ? [dateValue]
            : [`${month}月${day}日`]; // 直接使用分割后的月日
          // 处理主数据
          if (data?.length && data[dataIndex]) {
            const currentData = data[dataIndex];
            // 带2位小数(银行金额常用格式)
            const moneyFormat = new Intl.NumberFormat('zh-CN', {
              style: 'decimal',
            });
            const value = labelProcessor?.(currentData) || moneyFormat.format(Number(currentData.value));
            partial.push(
              `${colorPrefix ? `<div class="color-dot" style="background:${colorPrefix}"></div>` : ''}
      ${labelPrefix || ''} ${value} ${valueUnit}`,
            );
          }

          // 处理额外数据
          extraData?.forEach(item => {
            if (item.data[dataIndex]) {
              const currentValue = item.data[dataIndex].value;
              const value = numberWithCommas(Number(currentValue));
              partial.push(
                `${item.colorPrefix ? `<div class="color-dot" style="background:${item.colorPrefix}"></div>` : ''}
        ${item.labelPrefix || ''} ${value} ${valueUnit}`,
              );
            }
          });

          return partial.join('</br>');
        },
        padding: [8, 18, 8, 18],
      },
      series: [
        ...(extraData?.map(item =>
          createSeries(item.rgbColor, item.data, item.labelPrefix),
        ) || []),
        createSeries(rgbColor, data, name),
      ],
    };
  }, [xAxisData, rgbColor, extraData, data, name, isOriginX, xAxisName, yAxisName, yAxisTextAlign, valueUnit, renderTooltip, labelProcessor, colorPrefix, labelPrefix, createSeries]);

  // 初始化图表
  useEffect(() => {
    if (!chartRef.current) return;

    chartInstance.current = echarts.init(chartRef.current, null, {
      renderer: 'svg',
    });
    chartInstance.current.setOption(getOptions());

    // 响应式处理
    const resizeHandler = () => chartInstance.current?.resize();
    observerRef.current = new ResizeObserver(() => resizeHandler());
    observerRef.current.observe(chartRef.current);

    return () => {
      observerRef.current?.disconnect();
      chartInstance.current?.dispose();
    };
  }, [getOptions]);

  // 更新图表
  useEffect(() => {
    chartInstance.current?.setOption(getOptions());
  }, [getOptions]);

  // 暴露组件方法
  useImperativeHandle(ref, () => ({
    showLoading: () => {
      chartInstance.current?.showLoading({
        text: '',
        color: '#FF9600',
      });
    },
    hideLoading: () => chartInstance.current?.hideLoading(),
    getInstance: () => chartInstance.current,
  }));

  return (
    <div className="line-chart" style={{ height }}>
      <div ref={chartRef} className="chart" />
      <div className={classNames('empty-tips', { 'empty-tips--visible': isEmptyTipsVisible })}>
          暂无数据, 本月活跃大神的数据将在当月2号6时以后更新.
      </div>
    </div>
  );
});

export default LineChart;- LineChart.css
javascript
/* src/components/LineChart/LineChart.css */
.line-chart {
  width: 100%;
  position: relative;
  /* 添加最小高度防止内容塌陷 */
  min-height: 120px;
}

.chart {
  width: 100%;
  height: 100%;
  /* 修复图表可能出现的模糊问题 */
  transform: translateZ(0);
}

.empty-tips {
  /* 优化空状态样式 */
  position: absolute;
  width: 80%;
  max-width: 280px;
  padding: 16px;
  left: 50%;
  top: 50%;
  transform: translate(-50%, -50%);
  background: rgba(0, 0, 0, 0.65);
  border-radius: 8px;
  color: #fff;
  font-size: 14px;
  text-align: center;
  line-height: 1.5;
  opacity: 0;
  transition: opacity 0.3s;
  pointer-events: none;
}

.empty-tips--visible {
  opacity: 1;
  /* 添加轻微动画 */
  animation: fade-in 0.3s ease;
}

/* 新增tooltip容器样式 */
.echarts-tooltip {
  box-shadow: 0 4px 12px rgba(0, 0, 0, 0.15) !important;
  border-radius: 8px !important;
  backdrop-filter: blur(4px);
}

.color-dot {
  /* 优化颜色点显示 */
  width: 10px;
  height: 10px;
  border-radius: 50%;
  margin-right: 6px;
  box-shadow: 0 2px 4px rgba(0, 0, 0, 0.1);
  /* 修复对齐问题 */
  display: inline-flex;
  vertical-align: baseline;
}

@keyframes fade-in {
  from { opacity: 0; transform: translate(-50%, -45%); }
  to { opacity: 1; transform: translate(-50%, -50%); }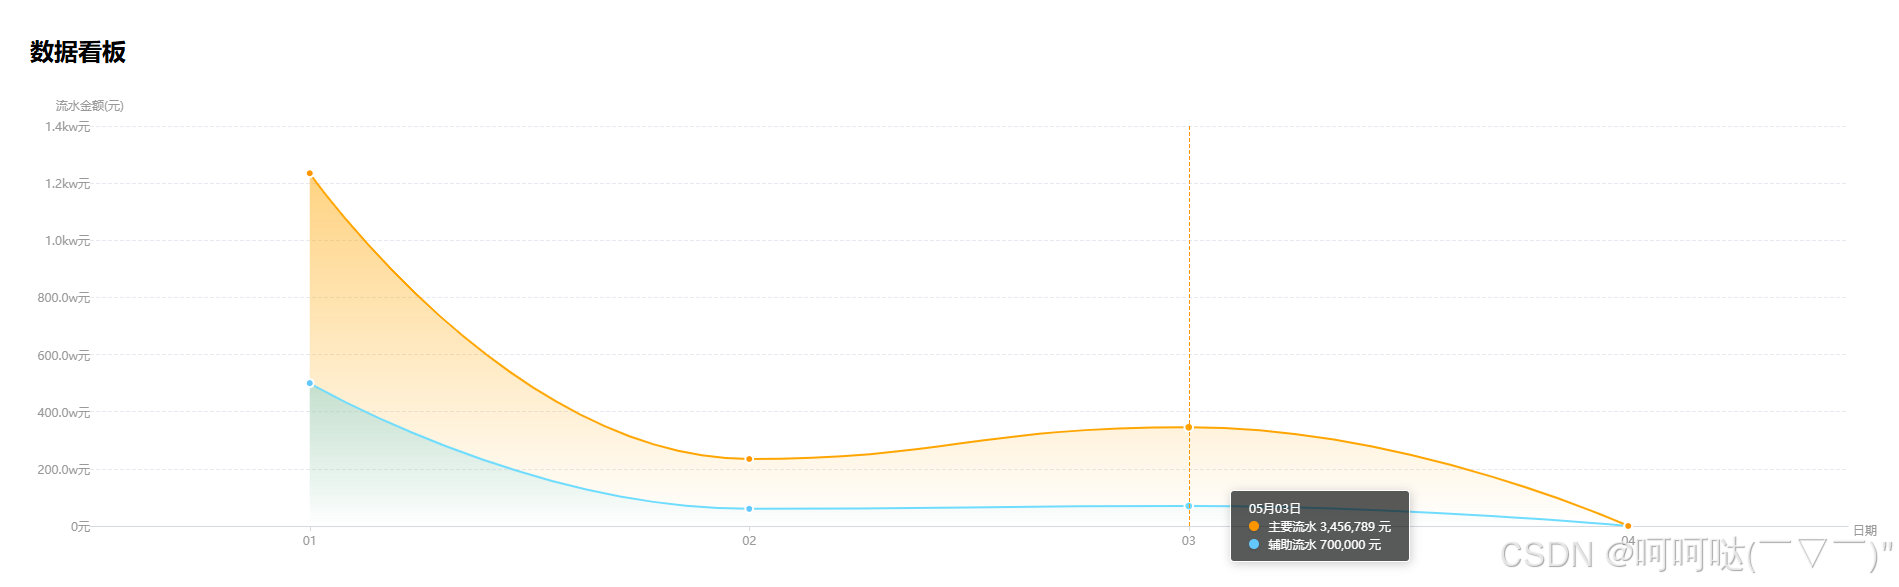
}DashboardPage.tsx
javascript
// src/pages/Dashboard/index.tsx
import React, { useRef } from 'react';
import LineChart, {IChartData, LineChartHandle} from '@/component/LineChart';
const DashboardPage = () => {
const chartRef = useRef<LineChartHandle>(null);
// 示例数据
const data: IChartData[] = [
{ date: '2024-05-01', value: 12345670 },
{ date: '2024-05-02', value: 2345678 },
{ date: '2024-05-03', value: 3456789 },
{ date: '2024-05-04', value: 0 },
];
const extraData = [
{
data: [
{ date: '2024-05-01', value: 5000000 },
{ date: '2024-05-02', value: 600000 },
{ date: '2024-05-03', value: 700000 },
{ date: '2024-05-04', value: 0 },
],
rgbColor: [100, 200, 255],
colorPrefix: '#64c8ff',
labelPrefix: '辅助流水',
},
];
return (
<div style={{ padding: 24 }}>
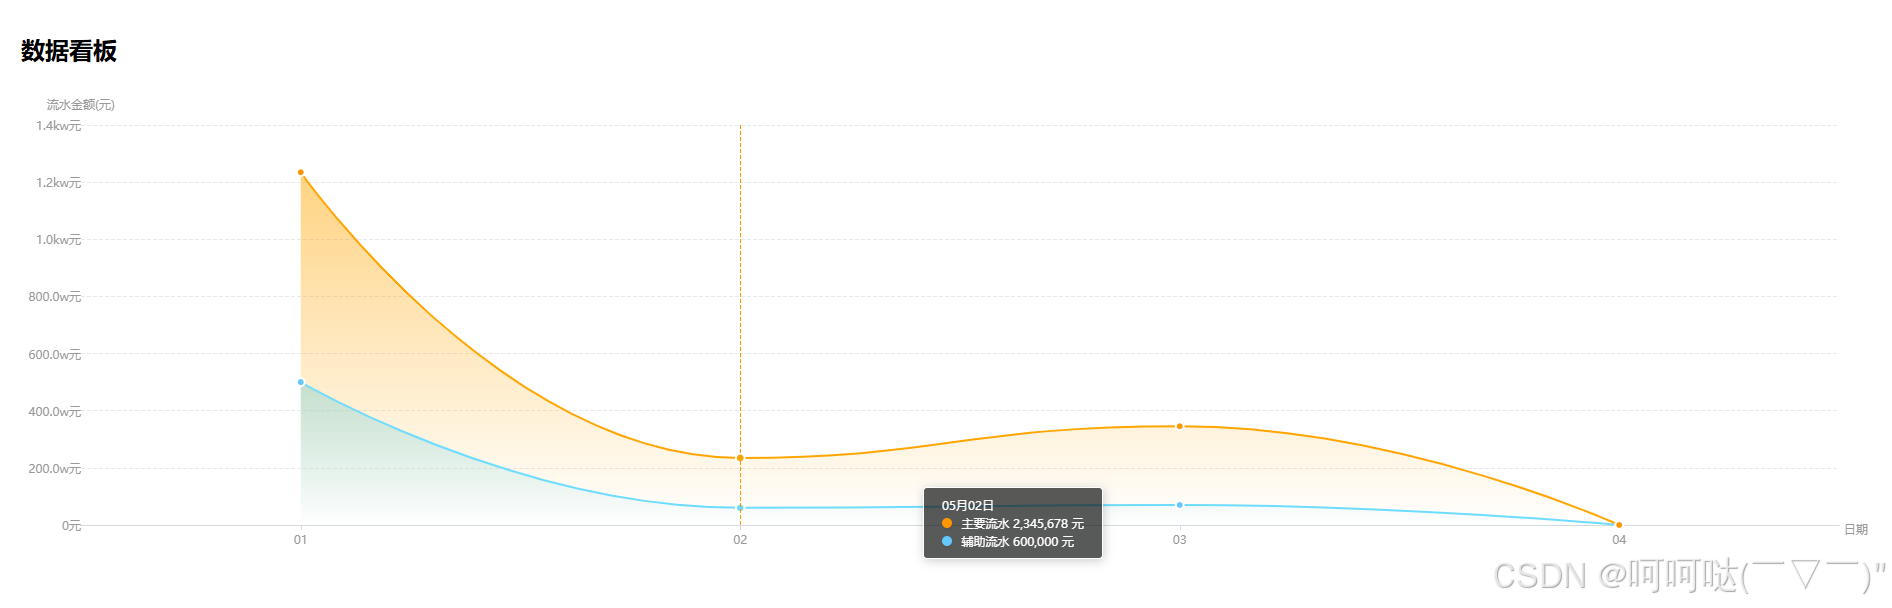
<h2>数据看板</h2>
<div style={{ marginTop: 20, height: '500px' }}>
<LineChart
ref={chartRef}
data={data}
extraData={extraData}
rgbColor={[255, 150, 0]}
height="100%"
xAxisName="日期"
yAxisName="流水金额(元)"
valueUnit="元"
colorPrefix="#FF9600"
labelPrefix="主要流水"
/>
</div>
</div>
);
};
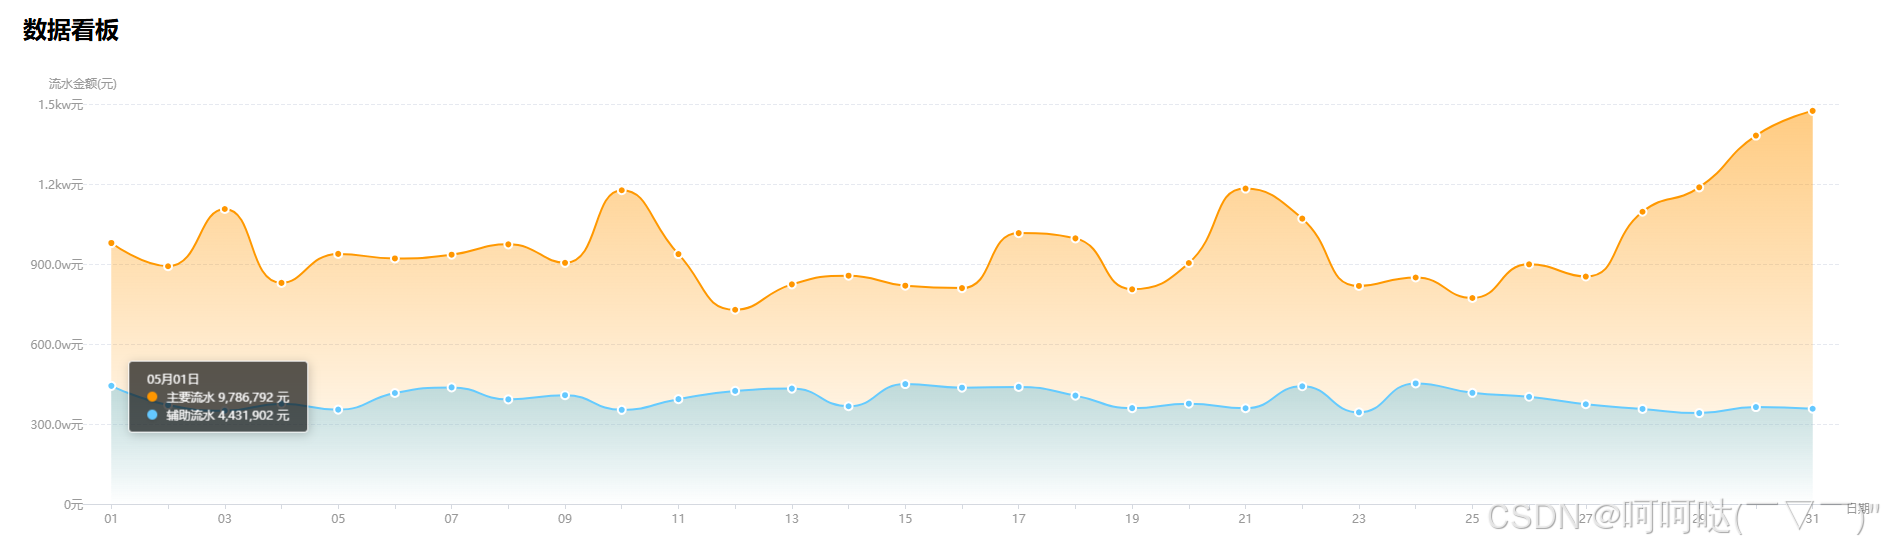
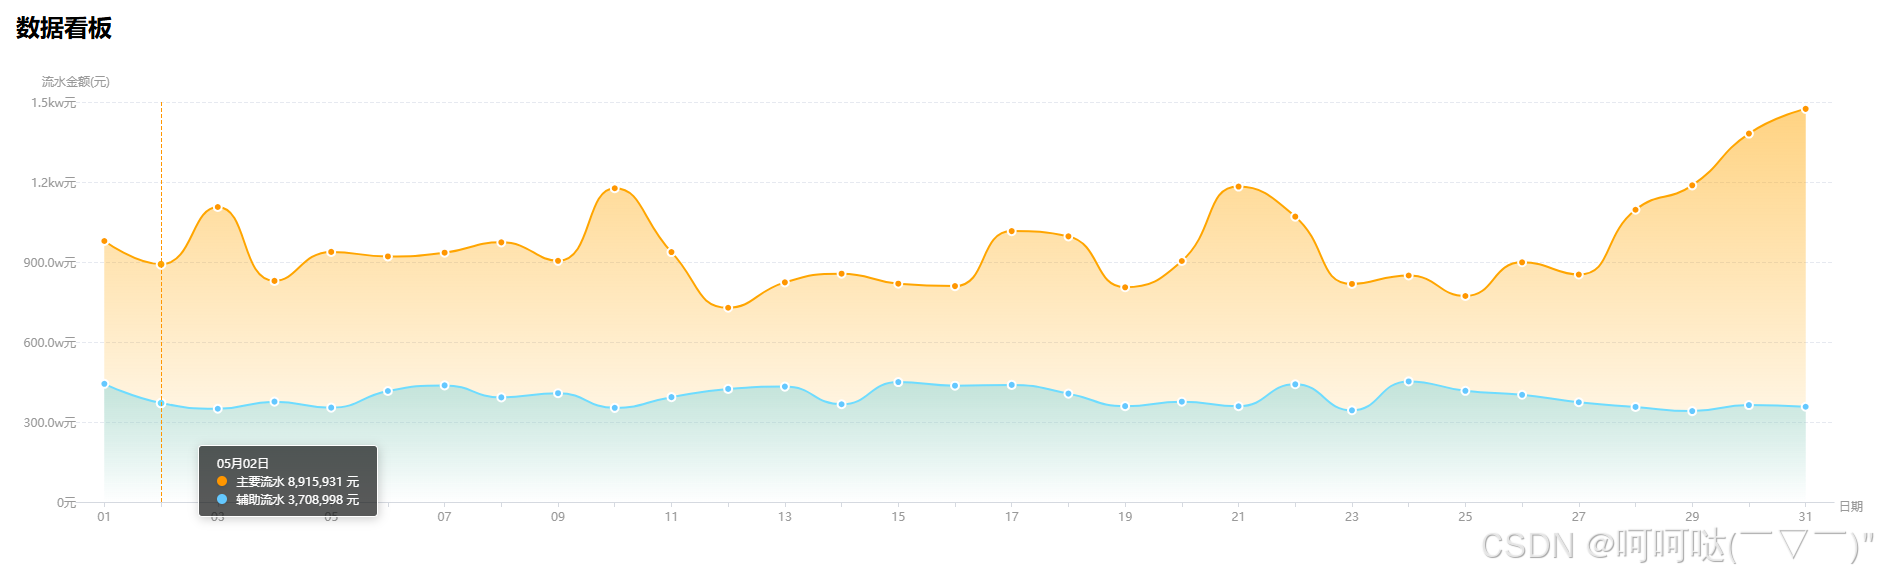
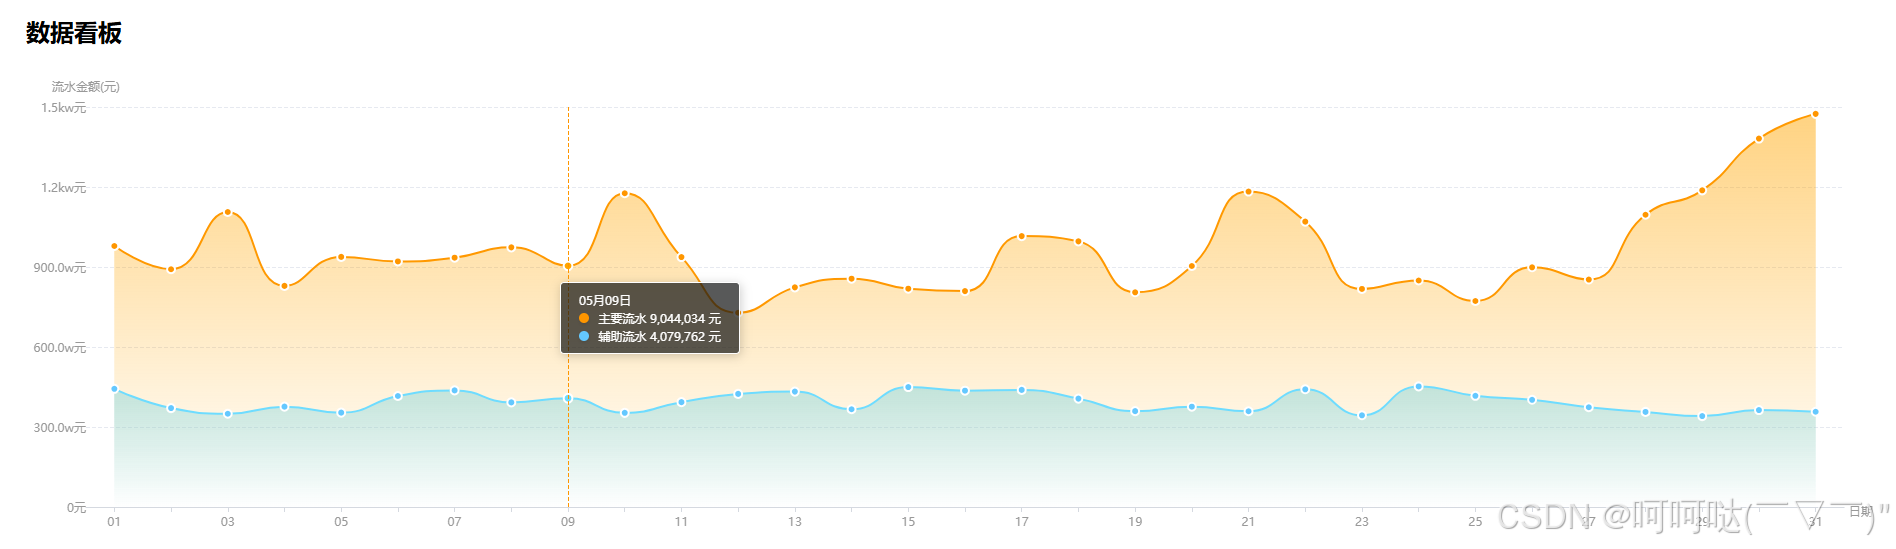
export default DashboardPage;二、优化版本,价格interval
- LineChart.tsx
javascript
// src/components/LineChart/LineChart.tsx
import React, {
  useEffect,
  useRef,
  useImperativeHandle,
  forwardRef,
  useMemo,
  useCallback,
} from 'react';
import * as echarts from 'echarts/core';
import type { ComposeOption } from 'echarts/core';
import type { LineSeriesOption } from 'echarts/charts';
import type {
  GridComponentOption,
  TooltipComponentOption,
  LegendComponentOption,
} from 'echarts/components';
import { SVGRenderer } from 'echarts/renderers';
import ResizeObserver from 'resize-observer-polyfill';
import classNames from 'classnames';
import { numberWithCommas } from '@/utils/numberWithCommas';
import './LineChart.css';

// 注册必要组件
const { LineChart: ELineChart } = require('echarts/charts');
const {
  GridComponent,
  TooltipComponent,
  LegendComponent,
} = require('echarts/components');

echarts.use([
  ELineChart,
  GridComponent,
  TooltipComponent,
  LegendComponent,
  SVGRenderer,
]);

type ECOption = ComposeOption<
    | LineSeriesOption
    | GridComponentOption
    | TooltipComponentOption
    | LegendComponentOption
>;

export interface IChartData {
  date: string;
  value: number | string;
}

interface ExtraDataItem {
  data: IChartData[];
  rgbColor: number[];
  colorPrefix?: string;
  labelPrefix?: string;
}

interface LineChartProps {
  data: IChartData[];
  extraData?: ExtraDataItem[];
  rgbColor?: number[];
  xAxisName?: string;
  yAxisName?: string;
  valueUnit?: string;
  isEmptyTipsVisible?: boolean;
  labelPrefix?: string;
  colorPrefix?: string;
  labelProcessor?: (data: IChartData) => string;
  renderTooltip?: (params: any) => string;
  name?: string;
  isOriginX?: boolean;
  height?: string;
  yAxisTextAlign?: 'left' | 'center' | 'right';
  interval?: number; // 日期间隔步长,例如:2就代表每隔一天 (01,03,05,...)
}

export interface LineChartHandle {
  showLoading: () => void;
  hideLoading: () => void;
  getInstance: () => echarts.ECharts | null;
}

const LineChart = forwardRef<LineChartHandle, LineChartProps>(({
  data,
  extraData = [],
  rgbColor = [255, 150, 0],
  xAxisName = '日期',
  yAxisName = '流水金额(元)',
  valueUnit = '元',
  isEmptyTipsVisible = false,
  labelPrefix,
  colorPrefix,
  labelProcessor,
  renderTooltip,
  name = 'tmp',
  isOriginX = false,
  height = '200px',
  yAxisTextAlign = 'center',
  interval = 1,
}, ref) => {
  const chartRef = useRef<HTMLDivElement>(null);
  const chartInstance = useRef<echarts.ECharts | null>(null);
  const observerRef = useRef<ResizeObserver | null>(null);

  // 修改后的x轴数据处理逻辑
  const xAxisData = useMemo(() => {
    const dataSources = [data, ...extraData.map(item => item.data)];
    const validData = dataSources.find(d => d?.length) || [];
    return validData.map((item: IChartData) =>
      (isOriginX
        ? item.date
        : item.date.split('-')[2]), // 直接取日期部分(第三个分割项)
    );
  }, [data, extraData, isOriginX]);

  // 修改系列配置保留完整数据对象
  const createSeries = useCallback((
    color: number[],
    seriesData: IChartData[],
    seriesName?: string,
  ): LineSeriesOption => ({
    name: seriesName || 'tmp',
    data: seriesData, // 保留完整数据对象
    type: 'line',
    encode: {
      x: 'date',  // 指定x轴字段
      y: 'value',  // 指定y轴字段
    },
    // 其他保持不变的配置...
    smooth: true,
    symbol: 'circle',
    symbolSize: 8,
    areaStyle: {
      color: {
        type: 'linear',
        x: 0,
        y: 0,
        x2: 0,
        y2: 1,
        colorStops: [
          { offset: 0, color: `rgba(${color.join(',')},0.7)` },
          { offset: 1, color: `rgba(${color.join(',')},0)` },
        ],
      },
    },
    itemStyle: {
      color: `rgb(${color.join(',')})`,
      borderColor: 'white',
      borderWidth: 2,
    },
  }), []);

  // 获取图表配置
  const getOptions = useCallback((): ECOption => {
    const yAxisCache: Record<string, boolean> = {};

    return {
      grid: {
        // left: 40,
        left: 60, // 增加左侧间距
        right: 30,
        bottom: 60, // 足够空间防止裁剪
        top: 40,
      },
      xAxis: {
        name: `{offset|${xAxisName}}`,
        nameLocation: 'end',
        nameGap: 5,
        nameTextStyle: {
          rich: {
            offset: {
              lineHeight: 24, // 增加行高实现下移
              padding: [8, 0, 0, 0], // 调整上边距
              align: 'center',
              color: '#999',
              fontSize: 12,
            },
          },
        },
        data: xAxisData,
        axisLine: {
          lineStyle: { width: 1, color: '#D5D9E0' },
        },
        axisLabel: {
          interval: 0, // 显示所有标签
          color: '#999',
          formatter: (value: string, index: number) => {
            return index % interval === 0 ? value : ''; // 不满足间隔时返回空
          },
        },
        axisTick: { alignWithLabel: true },
        axisPointer: {
          show: true,
          type: 'line',
          lineStyle: {
            type: 'dashed',
            color: `rgb(${rgbColor.join(',')})`,
          },
        },
      },
      yAxis: {
        name: yAxisName,
        nameTextStyle: {
          color: '#999',
          fontSize: 12,
          padding: [0, 0, 0, 0],
          align: yAxisTextAlign,
        },
        type: 'value',
        splitLine: {
          lineStyle: {
            color: '#E6E9F0',
            type: 'dashed',
          },
        },
        axisLine: { show: false },
        axisLabel: {
          color: '#999',
          margin: 0,
          interval: 1, // ✅ 正确间隔控制
          formatter: (value: number) => { // ✅ 移除index参数
            let result = String(value);
            if (value >= 1e8) result = `${(value / 1e8).toFixed(1)}亿`;
            else if (value >= 1e7) result = `${(value / 1e7).toFixed(1)}kw`;
            else if (value >= 1e4) result = `${(value / 1e4).toFixed(1)}w`;

            return `${result}${valueUnit}`; // ✅ 直接返回结果
          },
        },
        axisTick: { show: false },
      },
      // 在图表配置中修改tooltip配置项
      tooltip: {
        trigger: 'axis',
        backgroundColor: 'rgba(17,18,18,0.7)', // 加深背景色
        textStyle: {
          color: '#fff', // 明确设置字体颜色
          fontSize: 12,
          lineHeight: 17, // 增加行高
        },
        // 修改tooltip formatter部分
        formatter: (params: any) => {
          if (renderTooltip) return renderTooltip(params);
          const firstParam = params?.[0];
          if (!firstParam) return '';

          // 安全访问数据
          const dataIndex = firstParam.dataIndex;
          const dateValue = firstParam.data?.date || '';

          // 正确解析日期格式
          const [year, month, day] = dateValue.split('-');

          const partial = isOriginX
            ? [dateValue]
            : [`${month}月${day}日`]; // 直接使用分割后的月日
          // 处理主数据
          if (data?.length && data[dataIndex]) {
            const currentData = data[dataIndex];
            // 带2位小数(银行金额常用格式)
            const moneyFormat = new Intl.NumberFormat('zh-CN', {
              style: 'decimal',
            });
            const value = labelProcessor?.(currentData) || moneyFormat.format(Number(currentData.value));
            partial.push(
              `${colorPrefix ? `<div class="color-dot" style="background:${colorPrefix}"></div>` : ''}
      ${labelPrefix || ''} ${value} ${valueUnit}`,
            );
          }

          // 处理额外数据
          extraData?.forEach(item => {
            if (item.data[dataIndex]) {
              const currentValue = item.data[dataIndex].value;
              const value = numberWithCommas(Number(currentValue));
              partial.push(
                `${item.colorPrefix ? `<div class="color-dot" style="background:${item.colorPrefix}"></div>` : ''}
        ${item.labelPrefix || ''} ${value} ${valueUnit}`,
              );
            }
          });

          return partial.join('</br>');
        },
        padding: [8, 18, 8, 18],
      },
      series: [
        ...(extraData?.map(item =>
          createSeries(item.rgbColor, item.data, item.labelPrefix),
        ) || []),
        createSeries(rgbColor, data, name),
      ],
    };
  }, [xAxisData, rgbColor, extraData, data, name, isOriginX, xAxisName, yAxisName, yAxisTextAlign, valueUnit, renderTooltip, labelProcessor, colorPrefix, labelPrefix, createSeries]);

  // 初始化图表
  useEffect(() => {
    if (!chartRef.current) return;

    chartInstance.current = echarts.init(chartRef.current, null, {
      renderer: 'svg',
    });
    chartInstance.current.setOption(getOptions());

    // 响应式处理
    const resizeHandler = () => chartInstance.current?.resize();
    observerRef.current = new ResizeObserver(() => resizeHandler());
    observerRef.current.observe(chartRef.current);

    return () => {
      observerRef.current?.disconnect();
      chartInstance.current?.dispose();
    };
  }, [getOptions]);

  // 更新图表
  useEffect(() => {
    chartInstance.current?.setOption(getOptions());
  }, [getOptions]);

  // 暴露组件方法
  useImperativeHandle(ref, () => ({
    showLoading: () => {
      chartInstance.current?.showLoading({
        text: '',
        color: '#FF9600',
      });
    },
    hideLoading: () => chartInstance.current?.hideLoading(),
    getInstance: () => chartInstance.current,
  }));

  return (
    <div className="line-chart" style={{ height }}>
      <div ref={chartRef} className="chart" />
      <div className={classNames('empty-tips', { 'empty-tips--visible': isEmptyTipsVisible })}>
          暂无数据, 本月活跃大神的数据将在当月2号6时以后更新.
      </div>
    </div>
  );
});

export default LineChart;- LineChart.css
javascript
/* src/components/LineChart/LineChart.css */
.line-chart {
  width: 100%;
  position: relative;
  /* 添加最小高度防止内容塌陷 */
  min-height: 120px;
}

.chart {
  width: 100%;
  height: 100%;
  /* 修复图表可能出现的模糊问题 */
  transform: translateZ(0);
}

.empty-tips {
  /* 优化空状态样式 */
  position: absolute;
  width: 80%;
  max-width: 280px;
  padding: 16px;
  left: 50%;
  top: 50%;
  transform: translate(-50%, -50%);
  background: rgba(0, 0, 0, 0.65);
  border-radius: 8px;
  color: #fff;
  font-size: 14px;
  text-align: center;
  line-height: 1.5;
  opacity: 0;
  transition: opacity 0.3s;
  pointer-events: none;
}

.empty-tips--visible {
  opacity: 1;
  /* 添加轻微动画 */
  animation: fade-in 0.3s ease;
}

/* 新增tooltip容器样式 */
.echarts-tooltip {
  box-shadow: 0 4px 12px rgba(0, 0, 0, 0.15) !important;
  border-radius: 8px !important;
  backdrop-filter: blur(4px);
}

.color-dot {
  /* 优化颜色点显示 */
  width: 10px;
  height: 10px;
  border-radius: 50%;
  margin-right: 6px;
  box-shadow: 0 2px 4px rgba(0, 0, 0, 0.1);
  /* 修复对齐问题 */
  display: inline-flex;
  vertical-align: baseline;
}

@keyframes fade-in {
  from { opacity: 0; transform: translate(-50%, -45%); }
  to { opacity: 1; transform: translate(-50%, -50%); }
}- DashboardPage.tsx
javascript
import React, { useRef } from 'react';
import LineChart, {IChartData, LineChartHandle} from '@/component/LineChart';

const DashboardPage = () => {
  const chartRef = useRef<LineChartHandle>(null);

  // 生成完整5月份数据(31天)
  const generateMonthlyData = () => {
    const daysInMonth = 31;
    const baseValue = 10000000; // 基础值1千万
    const data: IChartData[] = [];
    const extra: IChartData[] = [];

    // 带波动的数据生成函数
    const generateDataPoint = (day: number, isExtra = false) => {
      // 基础波动(-20% ~ +20%)
      let fluctuation = 1 + (Math.random() * 0.4 - 0.2);

      // 周末效应(周六周日减少15%)
      const date = new Date(2024, 4, day);
      if ([0, 6].includes(date.getDay())) {
        fluctuation *= 0.85;
      }

      // 月末促销(最后三天增加40%)
      if (day > 28) fluctuation *= 1.4;

      // 额外数据波动较小(-15% ~ +15%)
      if (isExtra) {
        fluctuation = 1 + (Math.random() * 0.3 - 0.15);
        return baseValue * 0.4 * fluctuation; // 主数据的40%左右
      }

      return baseValue * fluctuation;
    };

    for (let day = 1; day <= daysInMonth; day++) {
      const dateString = new Date(2024, 4, day).toLocaleDateString('zh-CN', {
        year: 'numeric',
        month: '2-digit',
        day: '2-digit',
      })
        .replace(/\//g, '-');

      data.push({
        date: dateString,
        value: Math.round(generateDataPoint(day)),
      });

      extra.push({
        date: dateString,
        value: Math.round(generateDataPoint(day, true)),
      });
    }

    return { data, extra };
  };

  const { data, extra } = generateMonthlyData();

  const extraData = [
    {
      data: extra,
      rgbColor: [100, 200, 255],
      colorPrefix: '#64c8ff',
      labelPrefix: '辅助流水',
    },
  ];

  return (
    <div style={{ padding: 24 }}>
      <h2>数据看板</h2>
      <div style={{ marginTop: 20, height: '500px' }}>
        <LineChart
          ref={chartRef}
          data={data}
          extraData={extraData}
          rgbColor={[255, 150, 0]}
          height="100%"
          xAxisName="日期"
          yAxisName="流水金额(元)"
          valueUnit="元"
          colorPrefix="#FF9600"
          labelPrefix="主要流水"
          interval={2}
        />
      </div>
    </div>
  );
};

export default DashboardPage;