pip install pyautogui
python
"""
图像对比分析工具
功能:实现像素级差异、结构相似性(SSIM)、直方图相似度和特征匹配率四种对比方法
作者:智能助手
版本:1.2
日期:2025-02-27
"""
import os
import cv2
import pyautogui
import numpy as np
from skimage.metrics import structural_similarity as ssim
from matplotlib import pyplot as plt
from datetime import datetime
class ImageComparator:
def __init__(self, img1_path, img2_path):
"""
初始化图像比较器
参数:
img1_path: 第一张图片路径
img2_path: 第二张图片路径
"""
# 读取并预处理图像
self.img1 = self._preprocess_image(cv2.imread(img1_path))
self.img2 = self._preprocess_image(cv2.imread(img2_path))
self._validate_images() # 验证图像有效性
def _validate_images(self):
"""验证图像有效性并统一尺寸"""
if self.img1 is None or self.img2 is None:
raise ValueError("无法加载图像文件")
if self.img1.shape != self.img2.shape:
self._resize_images() # 自动调整图像尺寸
def _resize_images(self, method=cv2.INTER_AREA):
"""
统一图像尺寸
参数:
method: 插值方法,默认使用区域插值(速度快)
"""
h, w = self.img1.shape[:2]
self.img2 = cv2.resize(self.img2, (w, h), interpolation=method)
def _preprocess_image(self, img):
"""
图像预处理流程:
1. 高斯模糊降噪
2. CLAHE对比度受限直方图均衡化
"""
# 高斯模糊(核大小5x5,标准差自动计算)
img = cv2.GaussianBlur(img, (5, 5), 0)
# 转换到LAB颜色空间处理明度通道
lab = cv2.cvtColor(img, cv2.COLOR_BGR2LAB)
l, a, b = cv2.split(lab)
# 创建CLAHE对象(对比度限制2.0,网格大小8x8)
clahe = cv2.createCLAHE(clipLimit=3.0, tileGridSize=(8, 8))
l_clahe = clahe.apply(l) # 应用对比度均衡
# 合并通道并转回BGR空间
lab = cv2.merge((l_clahe, a, b))
return cv2.cvtColor(lab, cv2.COLOR_LAB2BGR)
def pixel_diff(self, threshold=5, visualize=False):
"""
像素级差异分析
参数:
threshold: 差异百分比阈值(默认5%)
visualize: 是否可视化差异
返回:
差异百分比和是否超过阈值
"""
# 计算绝对差异矩阵
diff = cv2.absdiff(self.img1, self.img2)
# 计算总差异量(三通道总和)
diff_sum = np.sum(diff)
# 计算差异百分比(相对于最大可能差异)
diff_percent = diff_sum / (self.img1.size * 255) * 100
if visualize:
self._plot_images(diff, "Pixel Difference")
return {
"difference_percent": round(diff_percent, 2),
"is_different": diff_percent > threshold
}
def ssim_compare(self, visualize=False):
"""
结构相似性指数(SSIM)计算
参数:
visualize: 是否可视化差异图
返回:
SSIM分数和相似性判断
"""
# 转换为灰度图像
gray1 = cv2.cvtColor(self.img1, cv2.COLOR_BGR2GRAY)
gray2 = cv2.cvtColor(self.img2, cv2.COLOR_BGR2GRAY)
# 计算SSIM(使用11x11高斯窗口)
score, diff = ssim(gray1, gray2, full=True)
# 将差异矩阵转换为0-255范围
diff = (diff * 255).astype("uint8")
if visualize:
self._plot_images(diff, f"SSIM {score:.2f}")
return {
"ssim_score": round(score, 3),
"is_similar": score > 0.95 # 经验阈值
}
def histogram_compare(self, method=cv2.HISTCMP_CORREL):
"""
直方图相似度计算
参数:
method: 比较方法(默认相关性)
可选方法:
HISTCMP_CORREL: 相关性(0-1)
HISTCMP_CHISQR: 卡方检验(越小越相似)
HISTCMP_BHATTACHARYYA: 巴氏距离(0-1,0最相似)
"""
# 计算三维直方图(每个通道256级)
hist1 = cv2.calcHist([self.img1], [0, 1, 2], None, [256, 256, 256], [0, 256, 0, 256, 0, 256])
hist2 = cv2.calcHist([self.img2], [0, 1, 2], None, [256, 256, 256], [0, 256, 0, 256, 0, 256])
# 归一化直方图
cv2.normalize(hist1, hist1, alpha=0, beta=1, norm_type=cv2.NORM_MINMAX)
cv2.normalize(hist2, hist2, alpha=0, beta=1, norm_type=cv2.NORM_MINMAX)
# 计算直方图相似度
similarity = cv2.compareHist(hist1, hist2, method)
return round(similarity, 3)
def feature_match(self):
"""
特征匹配率计算
使用ORB特征检测器+暴力匹配
返回:
优质匹配率(匹配距离<50的比例)
"""
# 初始化ORB检测器
orb = cv2.ORB_create()
# 检测关键点和计算描述子
kp1, des1 = orb.detectAndCompute(self.img1, None)
kp2, des2 = orb.detectAndCompute(self.img2, None)
# 当没有检测到特征点时返回0
if des1 is None or des2 is None:
return 0.0
# 创建暴力匹配器(汉明距离)
bf = cv2.BFMatcher(cv2.NORM_HAMMING, crossCheck=True)
matches = bf.match(des1, des2)
# 按距离排序
matches = sorted(matches, key=lambda x: x.distance)
# 筛选优质匹配(距离<50)
good_matches = [m for m in matches if m.distance < 50]
# 计算优质匹配率
match_rate = len(good_matches) / len(matches) if matches else 0
return round(match_rate, 3)
def _plot_images(self, diff, title):
"""
可视化对比结果
参数:
diff: 差异矩阵
title: 图表标题
"""
# 获取屏幕分辨率用于调整显示大小
screen_width, screen_height = pyautogui.size()
plt.figure(figsize=(screen_width / 100, screen_height / 100))
# 子图布局说明:
# 221 -> 2行2列的第1个位置
# 223 -> 2行2列的第3个位置
# 122 -> 1行2列的第2个位置
# 原始图像对比
plt.subplot(221), plt.imshow(cv2.cvtColor(self.img1, cv2.COLOR_BGR2RGB))
plt.title('Image 1'), plt.axis('off')
plt.subplot(223), plt.imshow(cv2.cvtColor(self.img2, cv2.COLOR_BGR2RGB))
plt.title('Image 2'), plt.axis('off')
# 差异图显示
plt.subplot(122), plt.imshow(diff, cmap='gray')
plt.title(title), plt.axis('off')
# 保存并关闭图表(避免内存泄漏)
plt.tight_layout()
plt.savefig(f"res_{title.split(' ')[0]}.png")
plt.close()
def generate_report(self, results, filename="report.html"):
"""
生成HTML格式的测试报告
参数:
results: 包含各指标的字典
filename: 输出文件名
"""
html_template = f"""
<html>
<head>
<title>图像对比报告 {datetime.now().strftime("%Y-%m-%d %H:%M")}</title>
<style>
/* 表格样式 */
table {{
border-collapse: collapse;
width: 80%;
margin: 20px auto;
box-shadow: 0 1px 3px rgba(0,0,0,0.2);
}}
th, td {{
border: 1px solid #ddd;
padding: 12px;
text-align: left;
}}
th {{
background-color: #4CAF50;
color: white;
}}
tr:nth-child(even) {{ background-color: #f8f9fa; }}
/* 图片容器样式 */
.image-container {{
text-align: center;
margin: 20px;
}}
img {{
max-width: 45%;
margin: 10px;
box-shadow: 0 2px 4px rgba(0,0,0,0.1);
}}
</style>
</head>
<body>
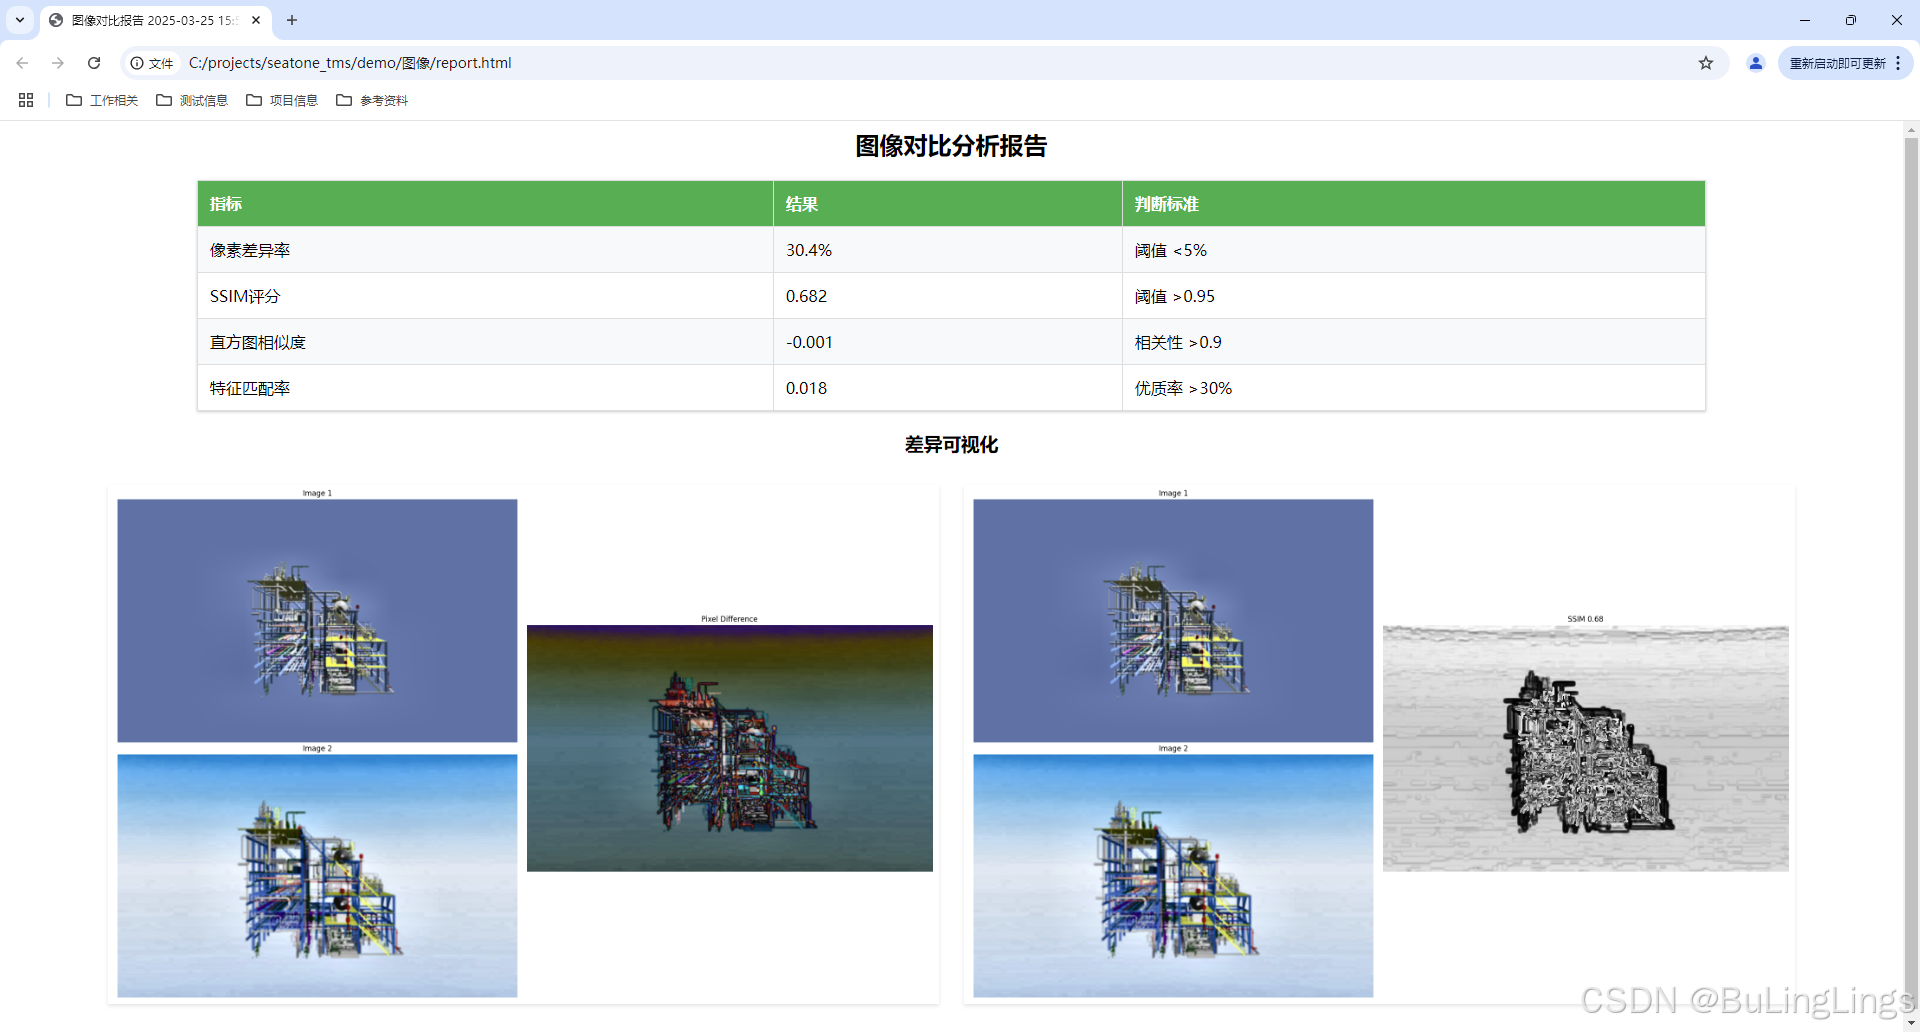
<h2 style="text-align: center;">图像对比分析报告</h2>
<!-- 结果汇总表格 -->
<table>
<tr><th>指标</th><th>结果</th><th>判断标准</th></tr>
<tr>
<td>像素差异率</td>
<td>{results['pixel_diff']}%</td>
<td>阈值 <5%</td>
</tr>
<tr>
<td>SSIM评分</td>
<td>{results['ssim']}</td>
<td>阈值 >0.95</td>
</tr>
<tr>
<td>直方图相似度</td>
<td>{results['histogram']}</td>
<td>相关性 >0.9</td>
</tr>
<tr>
<td>特征匹配率</td>
<td>{results['feature_match']}</td>
<td>优质率 >30%</td>
</tr>
</table>
<!-- 差异图展示 -->
<div class="image-container">
<h3>差异可视化</h3>
<img src="res_Pixel.png" alt="像素差异图">
<img src="res_SSIM.png" alt="SSIM差异图">
</div>
</body>
</html>
"""
# 写入HTML文件
with open(filename, 'w', encoding='utf-8') as f:
f.write(html_template)
print(f"报告已生成: {filename}")
if __name__ == "__main__":
# 文件路径
img1_path = "qian-c.png"
img2_path = "qian-w.png"
# 检查文件是否存在
if not os.path.exists(img1_path):
print(f"文件不存在: {img1_path}")
if not os.path.exists(img2_path):
print(f"文件不存在: {img2_path}")
# 使用示例
comparator = ImageComparator(img1_path, img2_path)
# 执行各对比方法
pixel_results = comparator.pixel_diff(visualize=True)
ssim_results = comparator.ssim_compare(visualize=True)
histogram_results = comparator.histogram_compare()
feature_results = comparator.feature_match()
# 汇总结果
results = {
"pixel_diff": pixel_results["difference_percent"],
"ssim": ssim_results["ssim_score"],
"histogram": histogram_results,
"feature_match": feature_results
}
# 生成报告
comparator.generate_report(results)对比结果