最近用到leaflet,研究了它的源码,被它用image元素绘制底图(开启preferCanvas也是image元素底图),然后通过transform的形式将HTML元素或SVG偏移到对应位置的方式给鸡肋到了,底图加载慢死,并且一旦绘制的形状很多卡死!本来打算在leaflet上叠加一层Canvas来性能优化的,结果Canvas清空重绘有问题,会出现部分清空不了,重绘的时候叠加的情况,啊啊啊!烦死!最终决定自己动手丰衣足食,自己用Canvas写一个简单的2D地图!
1. 经纬度投影坐标
虽然leaflet有鸡肋的地方,但是也有很多值得借鉴的地方。比如他的投影是可以自定义的,WGS84标准经纬度,GCJ02火星坐标,BD09百度坐标都可以通过leaflet的projection进行配置,那么绘制形状和底图也会跟着自动切换坐标系,当然瓦片底图也是跟着该坐标系走才能显示到正确的位置。
我们要将球体表面转换成2D的平面,则需要用到墨卡托投影,我们可以直接用Leaflet的SphericalMercator>>源码地址。
ts
const EARTH_R = 6378137;
export const SphericalMercator = {
  //地球半径
  R: EARTH_R,
  //地球周长
  EARTH_LEN: Math.PI * 2 * EARTH_R,
  // 最大纬度
  MAX_LATITUDE: 85.0511287798,
 //投影坐标
  project(lnglat: LngLatXY): LngLatXY {
    const d = Math.PI / 180,
      max = this.MAX_LATITUDE,
      lat = Math.max(Math.min(max, lnglat[1]), -max),
      sin = Math.sin(lat * d);

    return [this.R * lnglat[0] * d, (this.R * Math.log((1 + sin) / (1 - sin))) / 2];
  },
  //逆投影坐标
  unproject(xy: LngLatXY): LngLatXY {
    const d = 180 / Math.PI;
    const lat = (2 * Math.atan(Math.exp(xy[1] / this.R)) - Math.PI / 2) * d;
    const lng = (xy[0] * d) / this.R;

    return [lng, lat];
  },
}GCJ02火星坐标系需要对经纬度坐标做一定的偏移。
ts
class Transformation {
  private _a: number;
  private _b: number;
  private _c: number;
  private _d: number;
  constructor(a: number, b: number, c: number, d: number) {
    this._a = a;
    this._b = b;
    this._c = c;
    this._d = d;
  }
  untransform(xy: LngLatXY, scale: number) {
    scale = scale || 1;
    const x = (xy[0] / scale - this._b) / this._a;
    const y = (xy[1] / scale - this._d) / this._c;
    return [x, y];
  }
  transform(xy: LngLatXY, scale: number) {
    scale = scale || 1;
    const x = scale * (this._a * xy[0] + this._b);
    const y = scale * (this._c * xy[1] + this._d);
    return [x, y];
  }
}
//坐标偏移
  transformation: (function () {
    const scale = 0.5 / (Math.PI * EARTH_R);
    return new Transformation(scale, 0.5, -scale, 0.5);
  })(),
我们需要根据缩放等级,将经纬度坐标转换成像素坐标和将像素坐标逆转成经纬度坐标来确定绘制的位置,那么就需要下面的工具函数了。
ts
//该缩放等级的像素大小
scale(zoom: number) {
return 256 * Math.pow(2, zoom);
},
//该像素大小的缩放等级
zoom(scale: number) {
return Math.log(scale / 256) / Math.LN2;
},
//经纬度转像素坐标
lnglat2px(lnglat: LngLatXY, zoom: number): LngLatXY {
const p = this.project(lnglat);
const scale = this.scale(zoom);
return this.transformation.transform(p, scale);
},
//像素坐标转经纬度
px2lnglat(xy: LngLatXY, zoom: number): LngLatXY {
const scale = this.scale(zoom);
const p = this.transformation.untransform(xy, scale);
return this.unproject(p);
},
//米转像素
meter2px(meter: number, zoom: number) {
const scale = this.scale(zoom);
const s = scale / this.EARTH_LEN;
return meter * s;
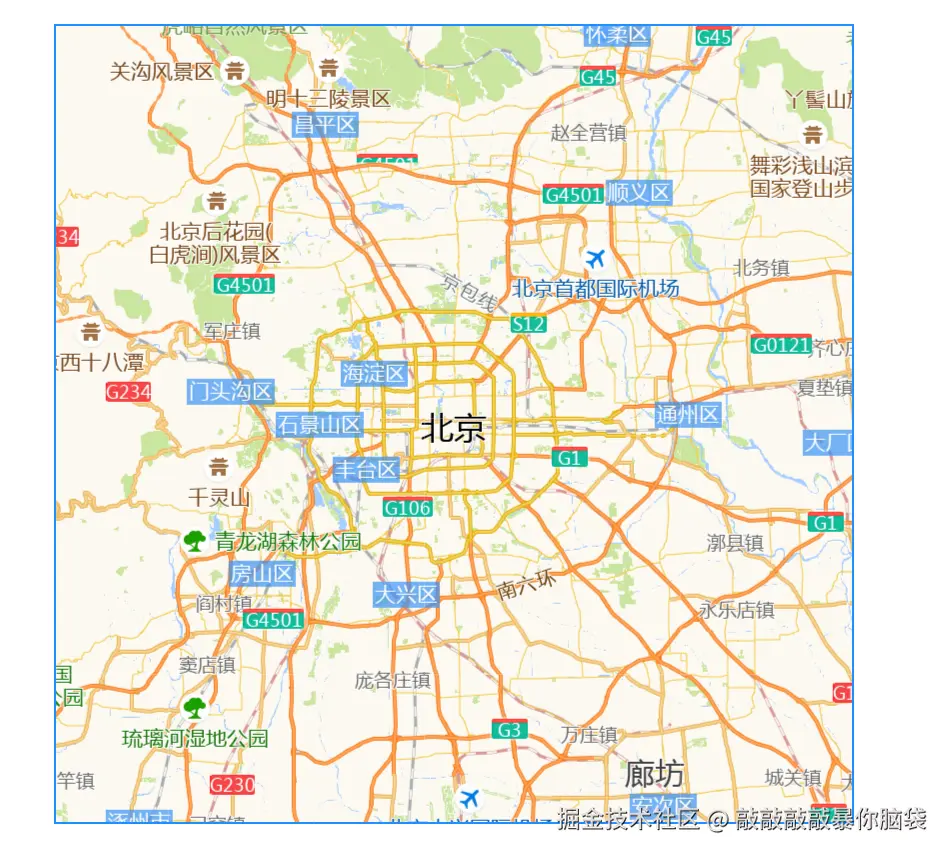
}2. 绘制地图底图
准备完工具,可以开始绘制地图底图了,这里使用了高德地图的瓦片底图 'http://wprd04.is.autonavi.com/appmaptile?lang=zh_cn&size=1&style=7&x={x}&y={y}&z={z}'
首先,计算在该缩放等级下,根据绘制的canvas像素大小,地图中心点,瓦片底图索引范围。
实现逻辑如下:
- 利用墨卡托投影将中心点经纬度转为该缩放等级下的像素坐标
- 中心点像素坐标加减canvas大小的一半,计算出可视范围内像素坐标
- 瓦片底图是256x256大小的图片,直接通过像素坐标除以256取整算出可视范围内的瓦片索引,左上点向下取整
Math.floor(start / 256),右下点向上取整Math.ceil(end /256) - 另外需要计算瓦片底图开始像素坐标相对canvas可视范围的左上点像素坐标偏移,用于绘制底图时加上该偏移量,让底图位置对应上。
ts
 getTileBounds() {
    //中心经纬度转像素坐标
    const tileCenter = this.projection.lnglat2px(this.center, this.zoom);
    //canvas大小
    const mapSize = this.getMapSize();
    //取一半,获取左上点和右下点相对于中心点的像素坐标
    const halfWidth = mapSize[0] * 0.5;
    const halfHeight = mapSize[1] * 0.5;
    const start: LngLatXY = [tileCenter[0] - halfWidth, tileCenter[1] - halfHeight];
    const end: LngLatXY = [tileCenter[0] + halfWidth, tileCenter[1] + halfHeight];
    //瓦片底图是256x256大小的图片,计算瓦片范围
    const bounds = [
      [Math.floor(start[0] / this.tileSize), Math.floor(start[1] / this.tileSize)],
      [Math.ceil(end[0] / this.tileSize), Math.ceil(end[1] / this.tileSize)]
    ];
    return {
      tileCenter,
      bounds,
      start,
      end,
      //瓦片开始像素坐标相对canvas可视范围的左上点像素坐标偏移
      offset: [bounds[0][0] * this.tileSize - start[0], bounds[0][1] * this.tileSize - start[1]]
    };
  }
然后,根据上面的计算结果,可以开始绘制底图了
加载瓦片底图绘制,为了提升加载性能,缓存image,方便后续移动和缩放地图时复用。
ts
  getTileImage(x: number, y: number, z: number) {
    return new Promise<HTMLImageElement>((resolve) => {
      const id = `${x}-${y}-${z}`;
      //缓存瓦片底图
      if (this.cacheTiles[id]) {
        resolve(this.cacheTiles[id]);
      } else {
        //加载瓦片底图
        const url = this.tileUrl.replace('{x}', String(x)).replace('{y}', String(y)).replace('{z}', String(z));
        const image = new Image();
        image.src = url;
        image.onload = () => {
          this.cacheTiles[id] = image;
          resolve(image);
        };
      }
    });
  }
  // 绘制瓦片底图
   async drawTileImage(ctx: CanvasRenderingContext2D, x: number, y: number, z: number, imageX: number, imageY: number) {
    const image = await this.getTileImage(x, y, z);
    ctx.drawImage(image, imageX, imageY);
  }
收集需要绘制的瓦片索引和瓦片在canvas上的位置,利用http1.1的同一个域名下TCP并发连接数4-8个,通常6个,异步加载图片绘,并制到canvas上
ts
 const { offset, bounds, start, end, tileCenter } = this.getTileBounds();
    //中心点像素坐标
    this.tileCenter = tileCenter;
    //开始像素坐标
    this.tileStart = start;
    //结束像素坐标
    this.tileEnd = end;
    //收集需要绘制的瓦片索引和瓦片在canvas上的位置
    const queue = [];
    for (let x = bounds[0][0], i = 0; x < bounds[1][0]; x++, i++) {
      for (let y = bounds[0][1], j = 0; y < bounds[1][1]; y++, j++) {
        queue.push({
          x,
          y,
          //瓦片位置 + 偏移位置
          imageX: i * this.tileSize + offset[0],
          imageY: j * this.tileSize + offset[1]
        });
      }
    }
    //异步加载图片绘制到canvas上
    for (let i = 0; i < queue.length; i = i + 6) {
      const list = queue.slice(i, i + 6);
      await Promise.all(list.map((a) => this.drawTileImage(ctx, a.x, a.y, this.zoom, a.imageX, a.imageY)));
    }
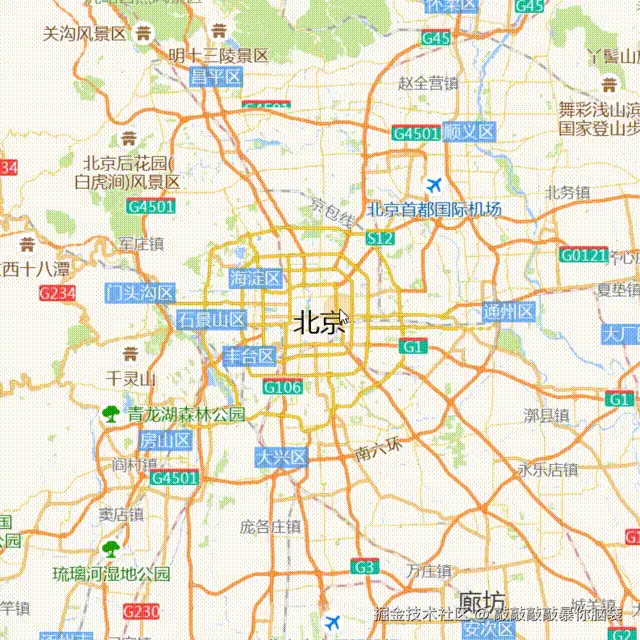
给地图添加动作,滚轮修改缩放等级,重新绘制底图,添加防抖避免滚动缩放太频繁
ts
setZoom(z: number) {
    if (z >= 3 && z <= 19) {
      this.zoom = Math.ceil(z);
      this.drawLayer();
    }
  }
   onWheel = debounce(
    function (ev: WheelEvent) {
      console.log('🚀 ~ MyMap ~ onWheel ~ ev:', ev, ev.deltaY);
      if (ev.deltaY > 0) {
        //down
        this.setZoom(this.zoom - 1);
      } else {
        //up
        this.setZoom(this.zoom + 1);
      }
    }.bind(this),
    100
  );
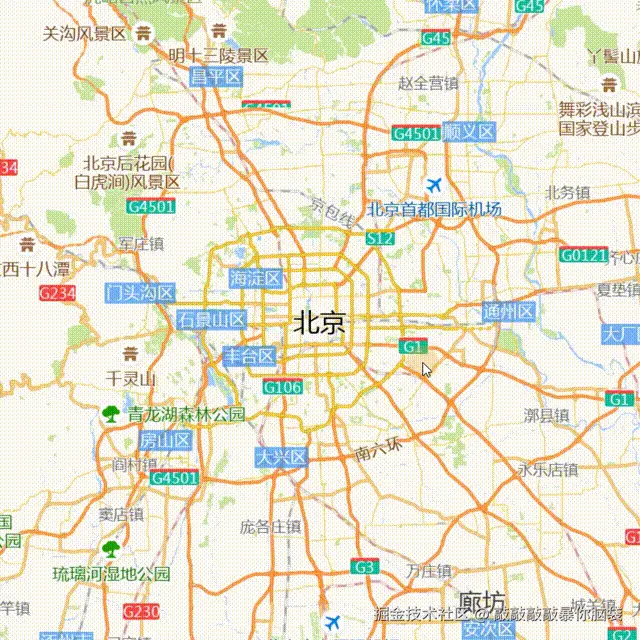
给地图添加动作,拖拽移动修改地图中心点,新的中心点像素坐标=旧的中心点像素坐标-鼠标移动距离*阻尼系数,避免移动范围太大,再根据新的中心点像素坐标计算出新的经纬度坐标,重新绘制底图
ts
 setCenter(center: LngLatXY) {
    if (center[0] >= -180 && center[0] <= 180 && center && center[1] >= -90 && center[1] <= 90) {
      this.center = center;
      this.drawLayer();
    }
  }
  onMouseDown(ev: MouseEvent) {
    this.move.enable = true;
    this.move.isMove = false;
    //鼠标开始位置
    this.move.start = [ev.offsetX, ev.offsetY];
  }
  onMouseMove(ev: MouseEvent) {
    if (this.move.enable) {
      this.move.isMove = true;
      //鼠标移动后位置
      this.move.end = [ev.offsetX, ev.offsetY];
    }
  }
   onMouseUp() {
    if (this.move.enable && this.move.isMove) {
      this.move.enable = false;
      //鼠标移动的距离,乘以moveStep阻尼系数,避免移动范围太大
      const offsetx = (this.move.end[0] - this.move.start[0]) * this.move.moveStep;
      const offsety = (this.move.end[1] - this.move.start[1]) * this.move.moveStep;
      //新的中心点像素坐标=旧的中心点像素坐标-鼠标移动距离
      const newtileCenter: LngLatXY = [this.tileCenter[0] - offsetx, this.tileCenter[1] - offsety];
    //根据新的中心点像素坐标计算出新的经纬度坐标
      const center = this.projection.px2lnglat(newtileCenter, this.zoom);
      this.setCenter(center);
    }
  }
获取canvas点击位置的经纬度 ,点击点在地图的像素坐标=点击点的像素坐标+左上点像素坐标,再将该点像素坐标通过墨卡托投影转为经纬度
ts
onClickMap(ev: MouseEvent) {
    this.move.enable = false;
    if (!this.move.isMove) {
      const x = ev.offsetX;
      const y = ev.offsetY;

      const lnglat = this.projection.px2lnglat([x + this.tileStart[0], y + this.tileStart[1]], this.zoom);
      console.log(lnglat);
}
}
3. 绘制形状元素
我这里将形状绘制与底图绘制做了分离,写了一个CanvasRender的class类,封装canvas的绘制操作,这样可以让Canvas的形状元素绘制只针对像素坐标,不用担心经纬度,后续的事件监听也更方便。转换到地图中时再适配,将canvas的像素坐标转为经纬度。
CanvasRender收集形状元素范围,用于后续事件监听
ts
 setBoxMap(start: PxXY, end: PxXY, data: CanvasDrawType) {
    //元素开启了动作,并且在可视范围内
    if (
      data.isAction &&
      ((end[0] >= 0 && end[1] >= 0) || (start[0] <= this.canvas.width && start[1] <= this.canvas.height))
    ) {
      const item = { start, end, data, id: data.id };

      this.boxMap.push(item);
    }
}CanvasRender绘制圆形
ts
drawCircle(op: CanvasCircle) {
    this.ctx.beginPath();
    const x = op.center[0];
    const y = op.center[1];
    this.ctx.arc(x, y, op.radius, 0, PI2);

    const style = op.style;
    const lineWidth = style.lineWidth || 0;
    if (style.fillColor) {
      this.setShapeStyle(style);
      this.ctx.fill();
    }
    if (style.lineWidth && style.lineColor) {
      this.setLineStyle(style);
      this.ctx.stroke();
    }
    this.setBoxMap(
      [x - op.radius - lineWidth, y - op.radius - lineWidth],
      [x + op.radius + lineWidth, y + op.radius + lineWidth],
      op
    );
}CanvasRender绘制矩形
ts
drawRect(op: CanvasRect) {
    const startX = Math.min(op.start[0], op.end[0]);
    const startY = Math.min(op.start[1], op.end[1]);
    const endX = Math.max(op.start[0], op.end[0]);
    const endY = Math.max(op.start[1], op.end[1]);
    this.ctx.beginPath();
    this.ctx.moveTo(startX, startY);
    this.ctx.lineTo(endX, startY);
    this.ctx.lineTo(endX, endY);
    this.ctx.lineTo(startX, endY);
    this.ctx.closePath();

    const style = op.style;
    const lineWidth = style.lineWidth || 0;
    if (style.fillColor) {
      this.setShapeStyle(style);
      this.ctx.fill();
    }
    if (style.lineWidth && style.lineColor) {
      this.setLineStyle(style);
      this.ctx.stroke();
    }

    this.setBoxMap([startX - lineWidth, startY - lineWidth], [endX + lineWidth, endY + lineWidth], op);
}CanvasRender绘制多边形和折线
ts
drawPolygonOrLine(op: CanvasPolygon | CanvasLine) {
    this.ctx.beginPath();
    const bound = {
      minx: Number.MAX_VALUE,
      miny: Number.MAX_VALUE,
      maxx: 0,
      maxy: 0
    };
    const start = op.path[0];
    this.ctx.moveTo(start[0], start[1]);
    bound.minx = Math.min(bound.minx, start[0]);
    bound.miny = Math.min(bound.miny, start[1]);
    bound.maxx = Math.max(bound.maxx, start[0]);
    bound.maxy = Math.max(bound.maxy, start[1]);
    for (let i = 1; i < op.path.length; i++) {
      const item = op.path[i];
      this.ctx.lineTo(item[0], item[1]);
      bound.minx = Math.min(bound.minx, item[0]);
      bound.miny = Math.min(bound.miny, item[1]);
      bound.maxx = Math.max(bound.maxx, item[0]);
      bound.maxy = Math.max(bound.maxy, item[1]);
    }
    this.ctx.closePath();
    const lineWidth = op.style.lineWidth || 0;
    this.setBoxMap(
      [bound.minx - lineWidth, bound.miny - lineWidth],
      [bound.maxx + lineWidth, bound.maxy + lineWidth],
      op
    );
  }
  //绘制多边形
  drawPolygon(op: CanvasPolygon) {
    this.drawPolygonOrLine(op);
    const style = op.style;
    if (style.fillColor) {
      this.setShapeStyle(style);
      this.ctx.fill();
    }
    if (style.lineWidth && style.lineColor) {
      this.setLineStyle(style);
      this.ctx.stroke();
    }
  }
  //绘制折线
  drawLine(op: CanvasLine) {
    this.drawPolygonOrLine(op);
    const style = op.style;

    if (style.lineWidth && style.lineColor) {
      this.setLineStyle(style);
      this.ctx.stroke();
    }
}CanvasRender绘制文本
ts
drawText(op: CanvasText) {
    this.ctx.beginPath();
    const x = op.offsetX ? op.pos[0] + op.offsetX : op.pos[0];
    const y = op.offsetY ? op.pos[1] + op.offsetY : op.pos[1];
    const style = op.style;
    const fontSize = style.fontSize || 14;
    this.ctx.font = `${fontSize}px ${style.fontFamily || 'Sans-serif'}`;
    this.ctx.textAlign = 'center';
    this.ctx.textBaseline = 'middle';

    const width = this.ctx.measureText(op.text).width;
    const lineWidth = style.lineWidth || 0;
    if (style.fillColor) {
      this.setShapeStyle(style);
      this.ctx.fillText(op.text, x, y);
    }
    if (style.lineColor && style.lineWidth) {
      this.setLineStyle(style);
      this.ctx.strokeText(op.text, x, y);
    }

    const w = Math.ceil(width * 0.5);
    const h = Math.ceil(fontSize * 0.5);
    this.setBoxMap([x - w - lineWidth, y - h - lineWidth], [x + w + lineWidth, y + h + lineWidth], op);
}CanvasRender绘制图片
ts
loadImage(url: string) {
    return new Promise<HTMLImageElement>((resolve) => {
      //缓存图片
      if (this.cacheImage[url]) {
        resolve(this.cacheImage[url]);
      } else {
        //加载图片
        const image = new Image();
        image.crossOrigin = '*';
        image.src = url;
        // image.naturalHeight;
        // image.naturalWidth;
        image.onload = () => {
          this.cacheImage[url] = image;
          resolve(image);
        };
      }
    });
  }
  async drawImage(op: CanvasImage) {
    const image = await this.loadImage(op.url);
    const w = op.width ? Math.ceil(op.width * 0.5) : Math.ceil(image.naturalWidth * 0.5);
    const h = op.height ? Math.ceil(op.height * 0.5) : Math.ceil(image.naturalHeight * 0.5);
    const x = op.offsetX ? op.pos[0] + op.offsetX : op.pos[0];
    const y = op.offsetY ? op.pos[1] + op.offsetY : op.pos[1];
    if (op.height && op.width) {
      this.ctx.drawImage(image, x - w, y - h, op.width, op.height);
    } else {
      this.ctx.drawImage(image, x - w, y - h);
    }
    this.setBoxMap([x - w, y - h], [x + w, y + h], op);
}CanvasRender统一绘制方法
ts
  async draw(op: CanvasDrawType) {
    this.resetStyle();
    switch (op.type) {
      case 'Circle':
        this.drawCircle(op);
        break;
      case 'Text':
        this.drawText(op);
        break;
      case 'Polygon':
        this.drawPolygon(op);
        break;
      case 'Line':
        this.drawLine(op);
        break;
      case 'Rect':
        this.drawRect(op);
        break;
      case 'Image':
        await this.drawImage(op);
        break;
    }
}- 在地图上增删形状元素配置
ts
  //添加到形状配置到地图
  add(op: CanvasDrawType) {
    this.shapeConfig.push(op);
  }
  //根据id移除形状
  removeById(id: string) {
    this.shapeConfig = this.shapeConfig.filter((it) => it.id === id);
  }
  //根据name移除形状
  removeByName(name: string) {
    this.shapeConfig = this.shapeConfig.filter((it) => it.name === name);
}- 给地图绘制形状,需要对地图形状配置做一些转换适配canvas,比如将经纬度转为canvas的像素坐标,将长度米转换为该缩放等级的像素大小。
ts
//经纬度转canvas上的像素坐标
lnglat2Canvas(lnglat: LngLatXY, z: number): LngLatXY {
const [x, y] = this.projection.lnglat2px(lnglat, z);
return [x - this.tileStart[0], y - this.tileStart[1]];
}
async drawShape() {
const z = this.zoom;
this.shapeConfig.sort((a, b) => (a.zIndex || 0) - (b.zIndex || 0));
for (let i = 0; i < this.shapeConfig.length; i++) {
const op = {
...this.shapeConfig[i]
};
if (op.type === 'Circle') {
op.center = this.lnglat2Canvas(op.center, z);
op.radius = this.projection.meter2px(op.radius, z);
} else if (op.type === 'Image' || op.type === 'Text') {
op.pos = this.lnglat2Canvas(op.pos, z);
} else if (op.type === 'Rect') {
op.start = this.lnglat2Canvas(op.start, z);
op.end = this.lnglat2Canvas(op.end, z);
} else if (op.type === 'Line' || op.type === 'Polygon') {
op.path = op.path.map((p) => this.lnglat2Canvas(p, z));
}
await this.renderer.draw(op);
}
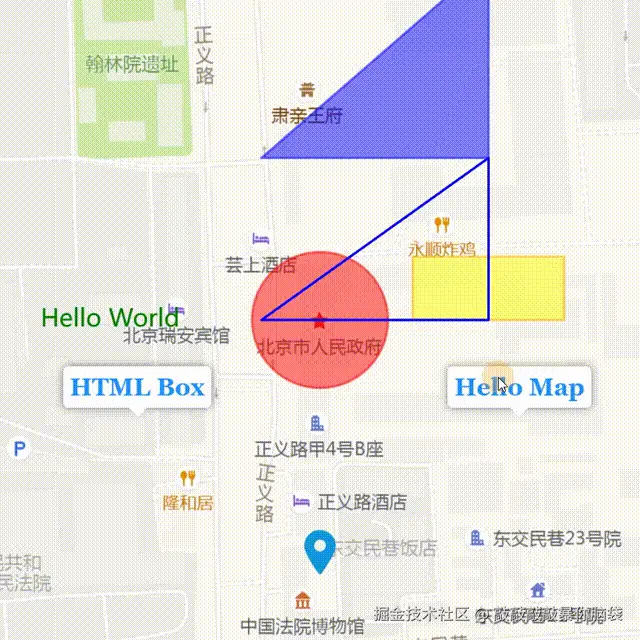
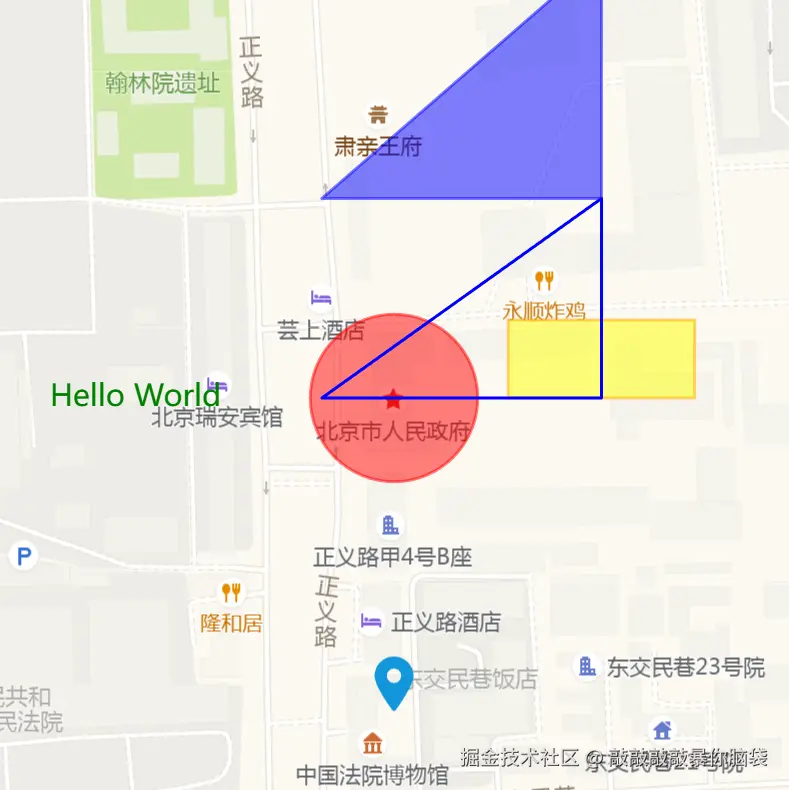
}- 使用地图绘制形状
ts
const map = new MyMap({
  container: document.getElementById('map') as HTMLElement,
  zoom: 18,
  center: [116.407387, 39.904179]
});
const shapes: CanvasDrawType[] = [
  {
    id: 'Image',
    type: 'Image',
    pos: [116.407387, 39.903],
    url: 'location.png',
    isAction: true
  },
  {
    id: 'Circle',
    type: 'Circle',
    center: [116.407387, 39.904179],
    radius: 50,
    style: {
      fillColor: 'red',
      fillOpacity: 0.5,
      lineColor: 'red',
      lineWidth: 3
    },
    isAction: true
  },
  {
    id: 'Rect',
    type: 'Rect',
    start: [116.408, 39.904179],
    end: [116.409, 39.9045],
    style: {
      fillColor: 'yellow',
      fillOpacity: 0.5,
      lineColor: 'orange',
      lineWidth: 3
    },
    isAction: true
  },
  {
    id: 'Text',
    type: 'Text',
    pos: [116.406, 39.904179],
    text: 'Hello World',
    style: {
      fontSize: 30,
      fillColor: 'green'
    },
    isAction: true
  },
  {
    id: 'Line',
    type: 'Line',
    path: [
      [116.407, 39.904179],
      [116.4085, 39.904179],
      [116.4085, 39.905]
    ],
    style: {
      lineColor: 'blue',
      lineWidth: 3
    },
    isAction: true
  },
  {
    id: 'Polygon',
    type: 'Polygon',
    path: [
      [116.407, 39.905],
      [116.4085, 39.905],
      [116.4085, 39.906]
    ],
    style: {
      fillColor: 'blue',
      fillOpacity: 0.5,
      lineColor: 'blue',
      lineWidth: 3
    },
    isAction: true
  }
];
shapes.forEach((item) => {
  map.add(item);
});
CanvasRender判断点是否在形状内,用于事件监听
ts
/**@description 射线算法,判断点是否在多边形内 */
function isPointInPolygon(pt: PxXY, pts: PxXY[]) {
  // 交点个数
  let counter = 0;
  // 水平射线和多边形边的交点x坐标
  let xinters;
  // 线段起点和终点
  let p1, p2;
  // for循环
  for (let i = 0; i < pts.length; i++) {
    p1 = pts[i];
    p2 = pts[(i + 1) % pts.length]; // 最后一个点等于起点pts[0]
    if (pt[1] > Math.min(p1[1], p2[1]) && pt[1] <= Math.max(p1[1], p2[1])) {
      xinters = ((pt[1] - p1[1]) * (p2[0] - p1[0])) / (p2[1] - p1[1]) + p1[0];
      if (p1[1] == p2[1] || pt[0] <= xinters) {
        counter++;
      }
    }
  }
  if (counter % 2 == 0) {
    return false;
  } else {
    return true;
  }
}
//点是否在形状内
checkShapes(x: number, y: number) {
    x = Math.floor(x);
    y = Math.floor(y);
    const objs: CanvasDrawType[] = [];
    //遍历可视范围内形状,判断是否在点击坐标上
    for (let i = 0; i < this.boxMap.length; i++) {
      const item = this.boxMap[i];
      if (x >= item.start[0] && y >= item.start[1] && x <= item.end[0] && y <= item.end[1]) {
        const type = item.data.type;
        //圆形 点到圆心距离在半径内
        if (type === 'Circle') {
          const d = Math.pow(x - item.data.center[0], 2) + Math.pow(y - item.data.center[1], 2);
          if (Math.sqrt(d) <= item.data.radius) {
            objs.push(item.data);
          }
          //多边形和折线,点通过射线算法是否在多边形内
        } else if (type === 'Polygon' || type === 'Line') {
          if (isPointInPolygon([x, y], item.data.path)) {
            objs.push(item.data);
          }
        } else {
          objs.push(item.data);
        }
      }
    }

    return objs;
  }
  //监听点击动作
 onClickMap(ev: MouseEvent) {
    this.move.enable = false;
    if (!this.move.isMove) {
      const x = ev.offsetX;
      const y = ev.offsetY;
      const lnglat = this.projection.px2lnglat([x + this.tileStart[0], y + this.tileStart[1]], this.zoom);
      //   console.log("🚀 ~ MyMap ~ onClickMap ~ lnglat:", lnglat)
      const objs = this.renderer.checkShapes(x, y);
      //   console.log('🚀 ~ MyMap ~ onClickMap ~ objs:', objs);
      this.events.emit('click', { objs, lnglat, x, y });
    }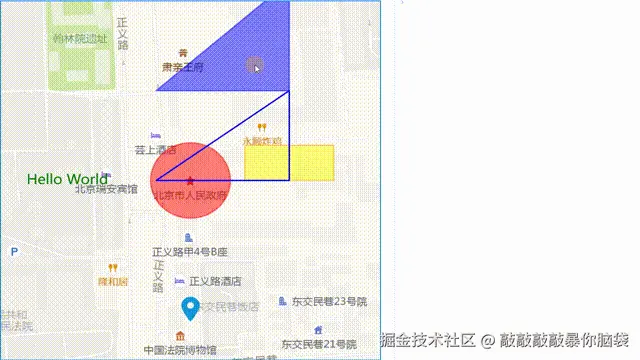
}- 监听点击形状元素,修改样式
ts
let selectObj: CanvasDrawType;
map.events.on('click', ({ objs }: { objs: CanvasDrawType[] }) => {
  if (objs.length) {
    if (selectObj) {
      //@ts-ignore
      if (['Rect', 'Circle', 'Polygon'].includes(selectObj.type)) {
        //@ts-ignore
        selectObj.style.fillOpacity = 0.5;
      }
    }
    selectObj = objs[0];
    //@ts-ignore
    if (['Rect', 'Circle', 'Polygon'].includes(selectObj.type)) {
      //@ts-ignore
      selectObj.style.fillOpacity = 1;
    }
    map.drawLayer();
  }
});
4. 添加HTML元素
- 给地图添加HTML,经纬度位置需转换成canvas上的像素坐标,并收集html范围,用于事件监听
ts
async addHtml(data: MapHtmlOverlay) {
    const dom = document.createElement('div');
    dom.style.position = 'absolute';
    dom.style.display = 'inline-block';
    this.overlay.appendChild(dom);
    const item = { data, dom };
    this.htmlOverlays.push(item);
    await this.updateHtml(item);
  }
  async updateHtml({ data, dom }: MapHtmlOptions) {
    dom.innerHTML = data.content;
    await nextTick();
    const pos = this.lnglat2Canvas(data.pos, this.zoom);
    const offset = data.offset || [0, 0];
    const w = dom.offsetWidth;
    const h = dom.offsetHeight;
    let x = 0;
    let y = 0;
    //锚点位置
    const anchor = data.anchor || 'center-bottom';
    switch (anchor) {
      case 'left-middle':
        y = h * 0.5;
        break;
      case 'left-bottom':
        y = h;
        break;
      case 'right-top':
        x = w;
        break;
      case 'right-middle':
        x = w;
        y = h * 0.5;
        break;
      case 'right-bottom':
        x = w;
        y = h;
        break;
      case 'center-top':
        x = w * 0.5;
        break;
      case 'center-middle':
        x = w * 0.5;
        break;
      case 'center-bottom':
        x = w * 0.5;
        y = h;
        break;
    }

    const left = pos[0] - x + (offset[0] || 0);
    const top = pos[1] - y + (offset[1] || 0);
    //设置dom位置
    dom.style.left = left + 'px';
    dom.style.top = top + 'px';
    const start: LngLatXY = [left, top];
    const end: LngLatXY = [left + dom.offsetWidth, top + dom.offsetHeight];
    const box: HtmlBoxType = { start, end, dom, data };
    //收集html范围,用于事件监听
    if (
      data.isAction &&
      ((end[0] >= 0 && end[1] >= 0) || (start[0] <= this.canvas.width && start[1] <= this.canvas.height))
    ) {
      this.htmlBox.push(box);
    }
  }
  //更新html
  async renderHtml() {
  this.htmlBox = [];
    for (let i = 0; i < this.htmlOverlays.length; i++) {
      await this.updateHtml(this.htmlOverlays[i]);
    }
} - 检测点击的html元素
ts
//检测点是否在html内
  checkHtmlBox(x: number, y: number) {
    const objs: MapHtmlOptions[] = [];
    this.htmlBox.forEach((a) => {
      if (x >= a.start[0] && x <= a.end[0] && y >= a.start[1] && y <= a.end[1]) {
        objs.push({ data: a.data, dom: a.dom });
      }
    });
    return objs;
  }
   onClickMap(ev: MouseEvent) {
 //...
      const x = ev.offsetX;
      const y = ev.offsetY;
      const htmls = this.checkHtmlBox(x, y);
      this.events.emit('click', { objs, lnglat, x, y, htmls });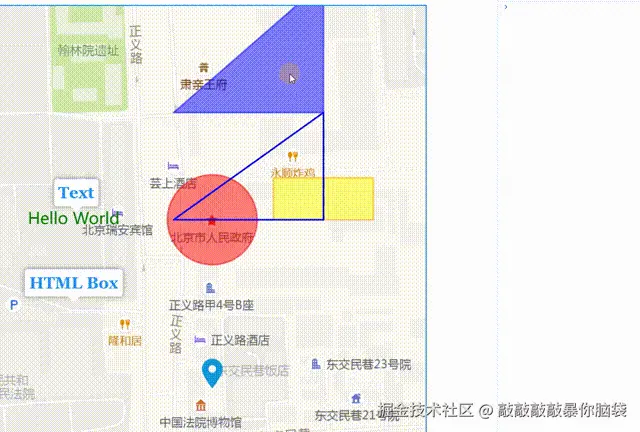
}- 增加html元素,点击地图形状元素修改html内容和位置
ts
function getTextBox(str: string) {
  return `<div class="text-box"><div>${str}</div></div>`;
}
const textBox: MapHtmlOverlay = {
  type: 'html',
  content: getTextBox('Hello Map'),
  pos: [116.4085, 39.9035],
  id: 'textbox'
};
map.addHtml(textBox);

const htmlObj: MapHtmlOverlay = {
  type: 'html',
  content: getTextBox('HTML Box'),
  pos: [116.406, 39.9035],
  id: 'html',
  isAction: true
};
map.addHtml(htmlObj);

map.events.on(
  'click',
  ({ objs, lnglat, htmls }: { objs: CanvasDrawType[]; lnglat: LngLatXY; htmls: MapHtmlOptions }) => {
  //点击的html元素
  if (htmls.length)
   console.log(
      '🚀 ~ htmls:',
      htmls.map((item) => item.data.id)
    );
    if (objs.length) {
      textBox.content = getTextBox(objs[0].id + '');
      textBox.pos = lnglat;
      map.drawLayer();
    }
  }
);
好啦!canvas的2D地图的基础功能完成啦~
5. GIthub地址
https://github.com/xiaolidan00/demo-vite-ts/tree/main/src/map
参考