💫《博主主页》:奈斯DB-CSDN博客
**🔥《擅长领域》:**擅长阿里云AnalyticDB for MySQL(分布式数据仓库)、Oracle、MySQL、Linux、prometheus监控;并对SQLserver、NoSQL(MongoDB)有了解
💖如果觉得文章对你有所帮助,欢迎点赞收藏加关注💖

鸽了一周,我带着监控神器杀回来了 😎! 这一周博主可不是在摸鱼🐟,而是在疯狂折腾 Prometheus + Grafana 的安装部署。
无论是运维老司机还是刚入门的小伙伴, Prometheus + Grafana 都能让你的服务器、数据库、应用监控变得清晰又高效。接下来,我会手把手教你:
✅ 如何安装和配置 Prometheus (指标采集与存储)
✅ 部署 Grafana (数据可视化大屏)
✅ 监控 Linux 服务
接下来就带大家从安装到装X,手把手搞出一套监控系统。
prometheus官网:
Prometheus - Monitoring system & time series database
包括了prometheus、alertmanager、mysqld_exporter、node_exporter等安装包的下载
Grafana官网:
Grafana: The open and composable observability platform | Grafana Labs
prometheus+Grafana全系列文章(实时更新 🔥 ):
【prometheus+Grafana篇】Prometheus与Grafana:深入了解监控架构与数据可视化分析平台-CSDN博客
【prometheus+Grafana篇】从零开始:Linux 7.6 上二进制安装 Prometheus、Grafana 和 Node Exporter-CSDN博客

目录
[二、安装prometheus(Prometheus Server:默认端口9090。主要用于抓取数据和存储时序数据,另外还提供査询和Alert Rule配置管理)](#二、安装prometheus(Prometheus Server:默认端口9090。主要用于抓取数据和存储时序数据,另外还提供査询和Alert Rule配置管理))
[2)选择Operating system(操作系统)为linux;选择Architecture(架构)为all](#2)选择Operating system(操作系统)为linux;选择Architecture(架构)为all)
3)目前prometheus最新版本为2.53.0。对于Arch(Architecture)架构,不同的架构名称代表不同的处理器架构或指令集体系结构,它们用于确定软件或操作系统在哪种硬件架构上运行。
10)修改prometheus监控的配置文件prometheus.yml
13)重启prometheus进程或者重新加载配置文件(二选一)
三、安装Grafana(Grafana:默认端口3000。获取prometheus抓取的指标数据,在Grafana上展示)
1)下载grafana安装包,选择download------Self-managed------Grafana(Download)
[2)选择软件Version版本;选择安装的操作系统;选择Standalone Linux Binaries(独立Linux二进制文件)](#2)选择软件Version版本;选择安装的操作系统;选择Standalone Linux Binaries(独立Linux二进制文件))
四、安装node-exporter(node-exporter:默认端口9100。用于收集操作系统和硬件信息的metrics)
1)下载node-exporter安装包,选择download
[2)选择Operating system(操作系统)为linux;选择Architecture(架构)为all](#2)选择Operating system(操作系统)为linux;选择Architecture(架构)为all)
8)登录node-exporter界面管理,默认端口为9100
五、将当前主机加入到prometheus监控,并通过Grafana展示
1)将node-exporter的信息加入到prometheus监控的配置文件prometheus.yml中
2)prometheus.yml文件添加了信息,所以重启prometheus进程或者重新加载配置文件(二选一)
[一、添加数据源:Connections---Data sources---选择"prometheus"---Add new data source](#一、添加数据源:Connections—Data sources—选择“prometheus”—Add new data source)
二、下载一个仪表盘:Grafana官网"http://www.grafana.com"---Dashboards,然后选择一个下载量高的自己喜欢的node-exporter(主机监控)
[三、将仪表盘添加到Grafana上:Dashboards---New---Import---点击"Upload dashboard JSON file"](#三、将仪表盘添加到Grafana上:Dashboards—New—Import—点击“Upload dashboard JSON file”)
四、仪表盘展示:Dashboards---查看到已经定义好的仪表盘,并且数据源是prometheus监控,点击进去
上车须知:
|------------|----------------|--------|-------------------|----------------------------------------------------------------------------|
| 主机名 | IP地址 | 配置 | 系统 | 描述 |
| prometheus | 110.120.100.21 | 4C 8G | Red Hat Linux 7.6 | Prometheus版本:2.45.6 node-exporter版本:1.8.2 Grafana版本:10.4.5 alertmanager版本: |
**Prometheus Server:**默认端口9090。主要用于抓取数据和存储时序数据,另外还提供査询和Alert Rule配置管理。
**node-exporter:**默认端口9100。用于收集操作系统和硬件信息的metrics。
**Grafana:**默认端口3000。获取prometheus抓取的指标数据,在Grafana上展示。
**alertmanager:**默认端口9093。用于告警通知管理的alertmanager。
开始部署安装!!!Action! 💻
一、系统层面配置
1)配置hosts文件
bashecho "110.120.100.21 prometheus" >> /etc/hosts cat /etc/hosts2)关闭防火墙
bashsystemctl stop firewalld.service systemctl disable firewalld.service systemctl status firewalld.service3)禁用SELINUX(SELinux 主要作用就是最大限度地减小系统中服务进程可访问的资源)
bashecho "SELINUX=disabled" > /etc/selinux/config echo "#SELINUXTYPE=targeted " >> /etc/selinux/config setenforce 0 more /etc/selinux/config4)配置ntp时间同步服务器
bash通过定时任务,定时同步ntp服务器上的时间: vi /etc/crontab 0 0 * * * root /usr/sbin/ntpdate 10.2.1.240;/sbin/hwclock -w ###编辑自动计划任务,将系统时间同步到指定的NTP 服务器(10.2.1.240),并将同步后的时间写入硬件时钟。
二、安装prometheus(Prometheus Server:默认端口9090。主要用于抓取数据和存储时序数据,另外还提供査询和Alert Rule配置管理)
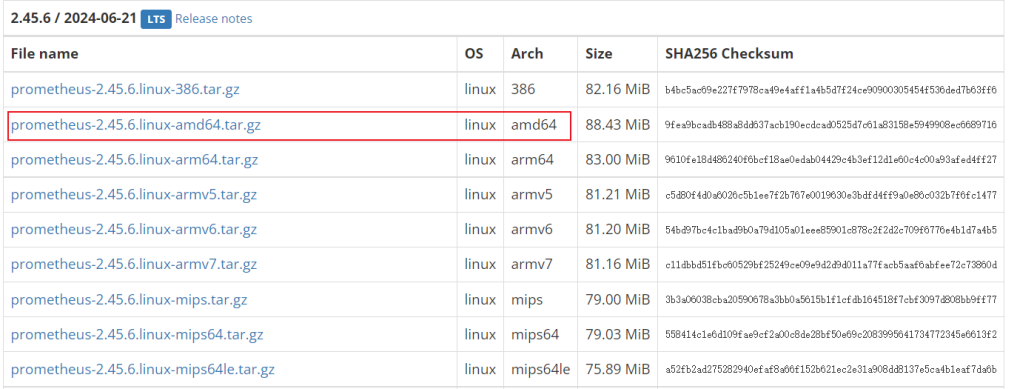
1)下载prometheus安装包,选择download
2)选择Operating system(操作系统)为linux;选择Architecture(架构)为all
3)目前prometheus最新版本为2.53.0。对于Arch(Architecture)架构,不同的架构名称代表不同的处理器架构或指令集体系结构,它们用于确定软件或操作系统在哪种硬件架构上运行。
**386:**这是Intel 80386 处理器架构,也被称为 x86。它是早期的32位处理器架构。
**amd64:**也称为x86-64 或 x64,这是一种64位的处理器架构,由 AMD 公司推出。它是基于 x86 架构的64位扩展,现在广泛用于桌面和服务器系统。
**arm64:**这是ARMv8-A 的64位处理器架构,主要应用于 ARM 架构的64位处理器,包括用于服务器、移动设备和嵌入式系统的处理器。
**armv5 和 armv6:**这两者都属于ARM 架构的32位处理器架构,分别对应于较旧的 ARM 处理器。它们通常用于嵌入式系统和一些较老的移动设备。
............
4)解压二进制prometheus包
bashtar -zxvf prometheus-2.45.6.linux-amd64.tar.gz5)移动并重命名prometheus解压出来的目录
bashmv prometheus-2.45.6.linux-amd64 /opt/ mv /opt/prometheus-2.45.6.linux-amd64 /opt/prometheus6)创建prometheus用户
bashgroupadd prometheus useradd -g prometheus -M -s /usr/sbin/nologin prometheus ---创建一个名为prometheus的系统账号,该账号没有家目录并且不能登录Shell。这种设置适用于需要运行服务或任务而不需要用户交互的情况。 -M:不为用户创建家目录。对于系统服务账号来说,通常不需要家目录,因此使用 -M 可以跳过家目录的创建步骤。 -s /usr/sbin/nologin:指定用户登录时使用的Shell。将用户prometheus的登录Shell设置为/usr/sbin/nologin。nologin Shell的作用是阻止用户登录系统,但允许该用户拥有有效的系统账号。这通常用于服务账号,因为它们不需要交互式Shell访问,仅用于执行特定服务或任务。 passwd prometheus id prometheus7)创建目录并赋权
bashmkdir -p /opt/prometheus/data ---创建Prometheus存储时序数据的路径为 /opt/prometheus/data。时序数据库(TSDB)用于存储Prometheus收集的时间序列数据。 chown -R prometheus:prometheus /opt/prometheus/8)写入linux启动服务项
bashcd /usr/lib/systemd/system vi prometheus.service [Unit] Description=prometheus After=network.target [Service] Type=simple User=prometheus Group=prometheus Restart=on-failure ExecStart=/opt/prometheus/prometheus --config.file=/opt/prometheus/prometheus.yml --storage.tsdb.path=/opt/prometheus/data --storage.tsdb.retention=60d --web.enable-lifecycle --log.level=info --web.listen-address=0.0.0.0:9090 [Install] WantedBy=multi-user.target systemctl daemon-reload systemctl start prometheus.service systemctl enable prometheus.service systemctl status prometheus.service**###--config.file:**指定Prometheus的配置文件路径为 /opt/prometheus/prometheus.yml。这个配置文件包含了Prometheus的各种配置选项,如监控目标、规则等。
**###--storage.tsdb.path:**设置Prometheus存储时序数据的路径为 /opt/prometheus/data。时序数据库(TSDB)用于存储Prometheus收集的时间序列数据。
**###--storage.tsdb.retention.time:**指定时序数据库中数据的保留时间为60天。这意味着Prometheus将保留60天内的所有收集数据,超过这个时间的数据将自动过期并删除,默认是15天。Prometheus 会自动删除旧的数据,Prometheus 将数据存储在固定大小的 block 中(通常为2小时数据),这些 block 只有在完全过期时才会被删除。
- Prometheus 会在后续的压缩周期(默认2小时)中逐步删除过期 block,可能需要等待几个压缩周期才能看到明显的空间释放。
- 如果将保留天数由180天调整到60天prometheus不会立马删除旧的数据,因为需要等到block完全过期时才会被删除,block过期时需要时间的(默认2小时)。当然可以直接在--storage.tsdb.path参数设置的数据路径下删除监控数据,监控数据都是按照时间生成的文件夹。
**###--web.enable-lifecycle:**启用Prometheus的生命周期接口,允许通过HTTP请求来动态重新加载配置等操作。这对于在运行时更新配置或执行其他管理操作非常有用,当修改了prometheus的配置后,可以通过curl命令来重新加载配置文件,而不需要重启prometheus。
**###--log.level=info :**表示设置日志级别为 info。在日志级别中,通常有不同的选项,如 debug、info、warn、error 等,每个级别代表了不同的日志详细程度:
- debug:最详细的日志级别,通常用于调试目的,记录大量细节。
- info:提供一般信息,用于记录正常操作时的状态和事件。
- warn:用于记录警告,表示可能的问题或不寻常的情况,但程序仍然可以继续运行。
- error:用于记录错误,表示程序遇到了一个无法继续的问题。
**###--web.listen-address=<address>:<port>:**指定服务端口。默认通过9090端口访问prometheus管理界面,可以修改成其他端口用于访问prometheus管理界面(如果没有修改端口的需求可以不设置这个参数)。此参数只能在prometheus命令启动时指定,不可以在配置文件prometheus.yml中指定。Grafana通过grafana-server启动时并没有指定端口的参数,如果需要修改成其他端口用于访问grafana管理界面,就需要在配置文件/opt/prometheus/grafana/conf/defaults.ini中修改http_port参数
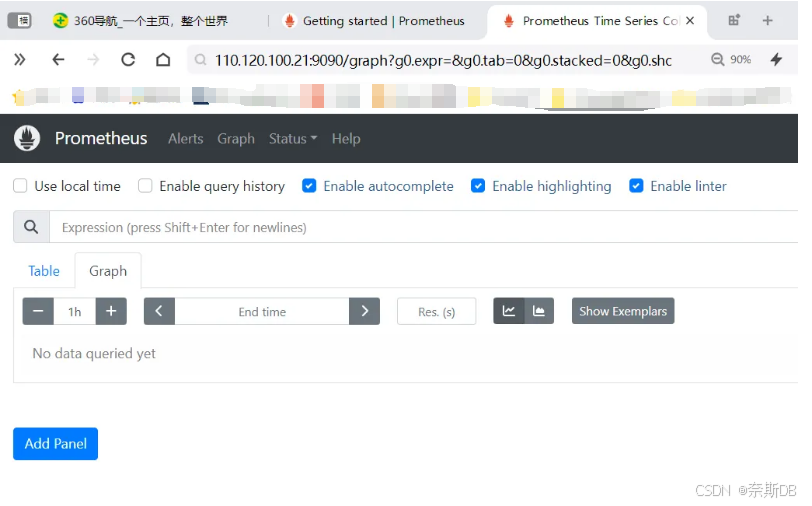
9)登录prometheus界面管理,默认端口为9090
10)修改prometheus监控的配置文件prometheus.yml
bashvi /opt/prometheus/prometheus.yml ### prometheus.yml:这个配置文件包含了Prometheus的各种配置选项,如监控目标、规则等。 # my global config global: scrape_interval: 15s ###scrape_interval:设置抓取数据的间隔时间为15秒,即每隔15秒抓取一次数据,默认为每1分钟抓取一次。 evaluation_interval: 15s ###evaluation_interval:设置规则评估的间隔时间为15秒,即每隔15秒评估一次规则,默认为每1分钟评估一次。 # evaluation_interval: 10s ###scrape_timeout:抓取数据的超时时间,默认为10秒。 # Alertmanager configuration alerting: ###alerting:告警配置部分,配置如何处理告警信息。 alertmanagers: ###alertmanagers:告警管理器的配置,这里使用静态配置方式配置Alertmanager的目标地址。 - static_configs: - targets: - localhost:9093 ###用于告警通知管理的alertmanager和prometheus安装在同一台机器上,所以可以配置成localhost进行访问alertmanager # Load rules once and periodically evaluate them according to the global 'evaluation_interval'. rule_files: ###rule_files:规则文件配置部分,用于加载和周期性地评估规则。 - "rules/*.yml" ###指定自定义的规则文件 # A scrape configuration containing exactly one endpoint to scrape: # Here it's Prometheus itself. scrape_configs: ###scrape_configs:抓取配置部分 # The job name is added as a label `job=<job_name>` to any timeseries scraped from this config. # metrics_path defaults to '/metrics' # scheme defaults to 'http'. # prometheus配置(配置Prometheus监控自身作为一个抓取目标,也可以不配置,因为也会在prometheus监控机上安装node-exporter,用于收集操作系统和硬件信息的metrics。node-exporter可以收集信息默认端口9100,可能因为是prometheus监控机的原因,9090不仅是prometheus管理界面,居然也可以通过9090/metrics进入到采集信息界面) - job_name: "prometheus服务器" ###job_name 用来唯一标识一个监控任务。在同一个 prometheus.yml 文件中,不同的 scrape_config可以有不同的job_name,以便 Prometheus 能够区分和管理不同的监控目标和配置,用来将不同的监控目标分组。 scrape_interval: 15s static_configs: ###允许直接列出要监控的每个目标的地址信息,例如 IP 地址和端口号。这些信息是静态的,不会在 Prometheus 运行时发生变化。 - targets: ["localhost:9090"] ###用来指定一个或多个要监控的目标,通常是一个 HTTP 或 HTTPS 端点。每个目标都由一个字符串表示,格式通常是 <hostname>:<port> 或者 <ip_address>:<port>。可以在同一个 job 的 targets 中列出多个目标,每个目标都会独立地被 Prometheus 抓取和处理。 labels: ###为每个监控任务(job)或者每个指标添加额外的元数据信息。这些信息通常包括描述性的名称、环境信息、服务版本等,用来更好地理解和分析指标数据的背景和上下文。 instance: Prometheus服务器11)自定义规则文件
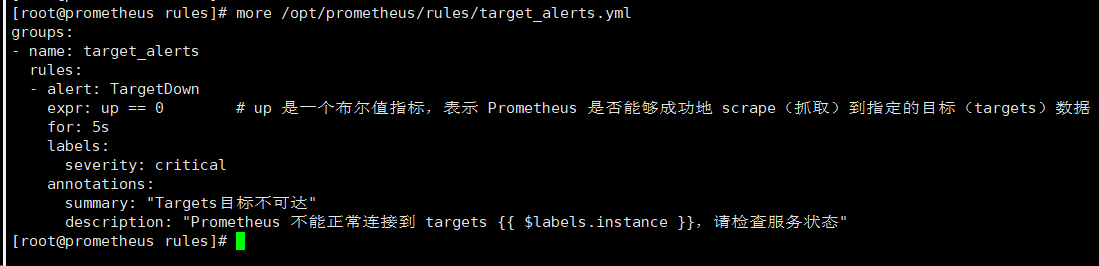
bash#创建告警规则文件夹 cd /opt/prometheus/ mkdir rules #定义scrape(抓取)到指定的目标(targets)的告警规则 vi /opt/prometheus/rules/target_alerts.yml groups: - name: target_alerts rules: - alert: TargetDown expr: up == 0 # up 是一个布尔值指标,表示 Prometheus 是否能够成功地 scrape(抓取)到指定的目标(targets)数据 for: 5s labels: severity: critical annotations: summary: "Targets目标不可达" description: "Prometheus 不能正常连接到 targets {{ $labels.instance }},请检查服务状态"
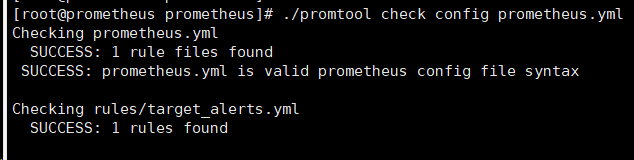
bashchown prometheus:prometheus /opt/prometheus/rules/target_alerts.yml more /opt/prometheus/rules/target_alerts.yml12)检查配置文件
bashcd /opt/prometheus/ ./promtool check config prometheus.yml ###用于检查 Prometheus 配置文件(prometheus.yml)的语法和格式是否正确。执行这条命令会执行以下操作:
- 验证配置文件的语法:检查 prometheus.yml 文件是否符合 Prometheus 配置格式规范。
- 检测潜在的错误或警告:如果配置文件中存在拼写错误、格式问题、无效的配置项等问题,它会提供相关的错误信息或警告。比如告警规则写的不对,就会有提示
- 输出有用的诊断信息:如果配置文件存在问题,promtool 会输出详细的错误信息。
13)重启prometheus进程或者重新加载配置文件(二选一)
bash#重启 systemctl restart prometheus.service #重载:前提是在prometheus.service启动服务项中加了--web.enable-lifecycle参数 ###--web.enable-lifecycle:###启用Prometheus的生命周期接口,允许通过HTTP请求来动态重新加载配置等操作。这对于在运行时更新配置或执行其他管理操作非常有用,当修改了prometheus的配置后,可以通过curl命令来重新加载配置文件,而不需要重启prometheus。 curl -X POST http://localhost:9090/-/reload


三、安装Grafana(Grafana:默认端口3000。获取prometheus抓取的指标数据,在Grafana上展示)
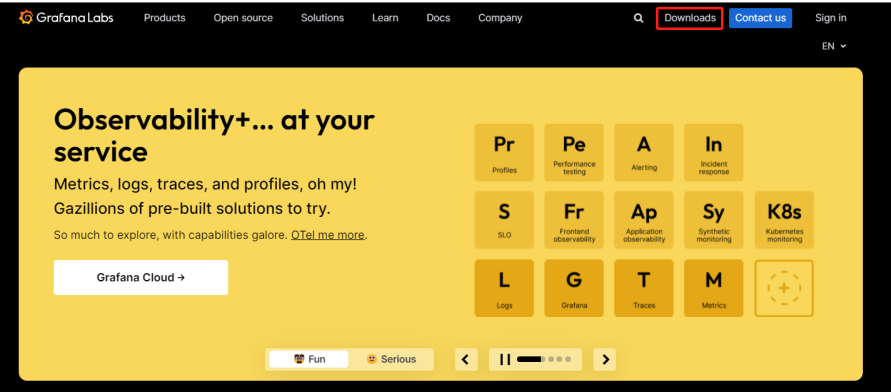
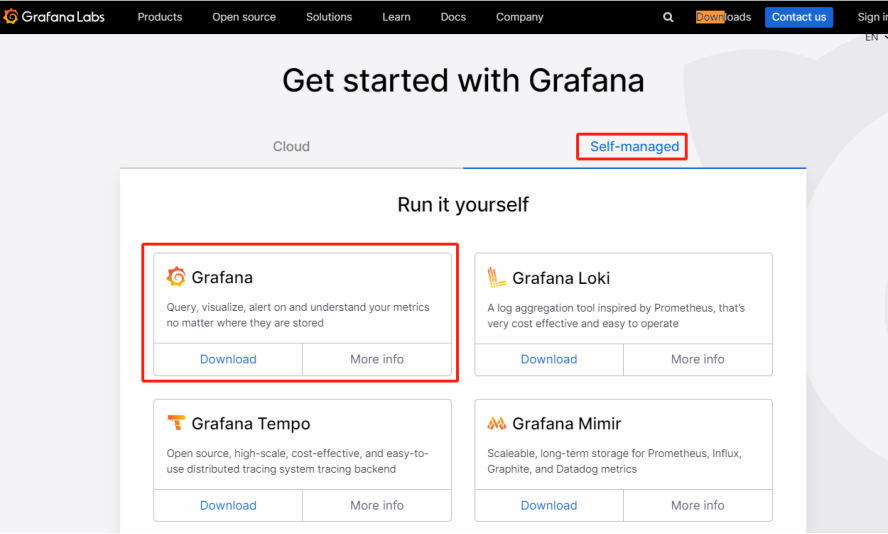
1)下载grafana安装包,选择download------Self-managed------Grafana(Download)
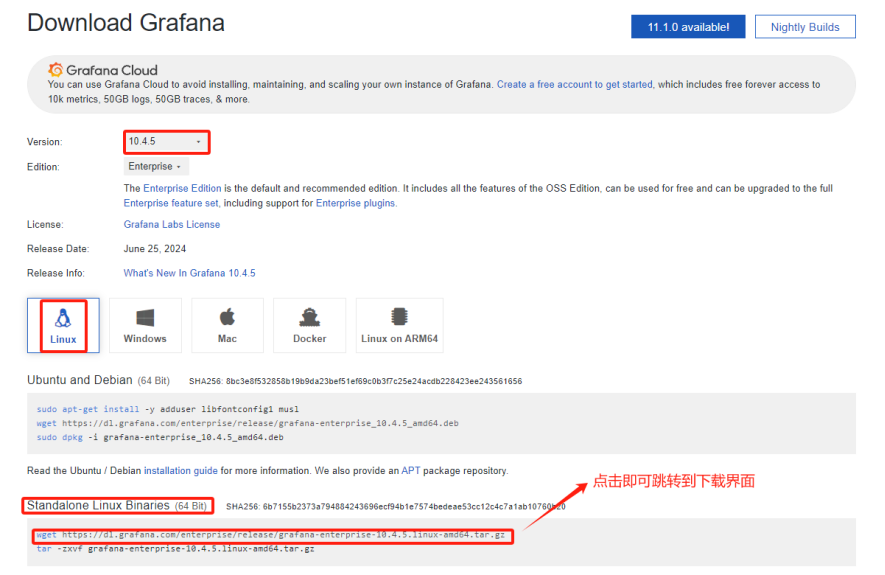
2)选择软件Version版本;选择安装的操作系统;选择Standalone Linux Binaries(独立Linux二进制文件)
注意: 如果linux服务器在外网上面,直接在linux上运行wget https://dl.grafana.com/enterprise/release/grafana-enterprise-10.4.5.linux-amd64.tar.gz,即可下载。
3)解压二进制Grafana包
bashtar -zxvf grafana-enterprise-10.4.5.linux-amd64.tar.gz4)移动并重命名Grafana解压出来的目录
bashmv grafana-v10.4.5 /opt/prometheus ###移动到prometheus相关目录下 mv /opt/prometheus/grafana-v10.4.5 /opt/prometheus/grafana5)赋权
bashchown -R prometheus:prometheus /opt/prometheus/grafana6)写入linux启动服务项
bashcd /usr/lib/systemd/system vi grafana-server.service [Unit] Description=Grafana server After=network.target [Service] Type=simple User=prometheus Group=prometheus Restart=on-failure ExecStart=/opt/prometheus/grafana/bin/grafana-server --config=/opt/prometheus/grafana/conf/defaults.ini --homepath=/opt/prometheus/grafana [Install] WantedBy=multi-user.target systemctl daemon-reload systemctl start grafana-server.service systemctl enable grafana-server.service systemctl status grafana-server.service**###--config:**指定配置文件的路径,Grafana 使用配置文件来定义其行为、数据存储位置、数据库连接信息以及其他运行时设置。
**###--homepath:**指定 Grafana 的主目录路径,Grafana 在运行时需要访问其主目录,以查找插件、日志文件、静态资源等。
###和prometheus不同,grafana-server启动时并没有指定端口的参数,如果需要修改成其他端口用于访问grafana管理界面,就需要在配置文件/opt/prometheus/grafana/conf/defaults.ini中修改http_port参数
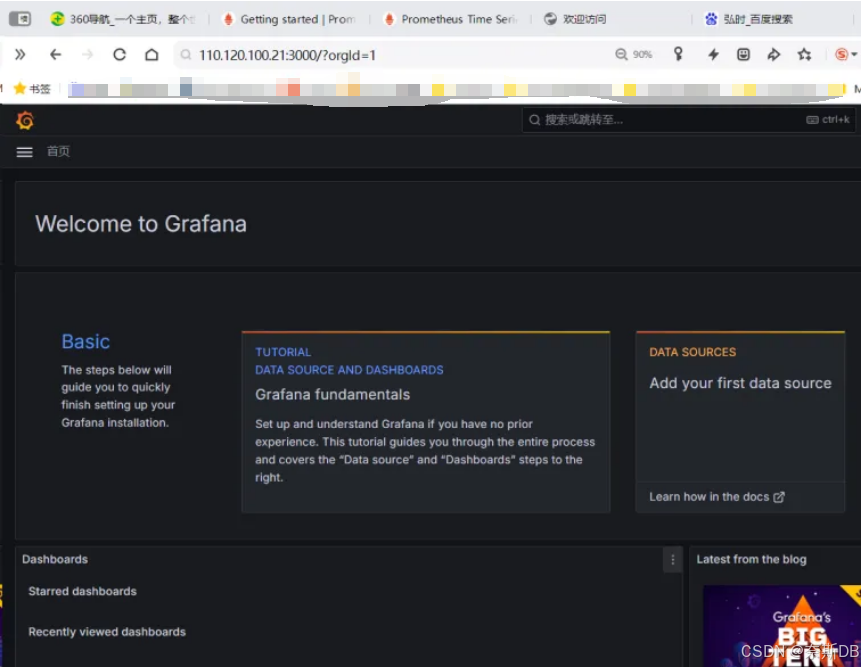
7)登录Grafana界面管理,默认端口为3000
默认用户:admin
默认密码:admin
四、安装node-exporter(node-exporter:默认端口9100。用于收集操作系统和硬件信息的metrics)
1)下载node-exporter安装包,选择download
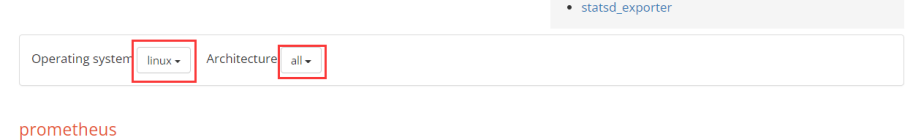
2)选择Operating system(操作系统)为linux;选择Architecture(架构)为all
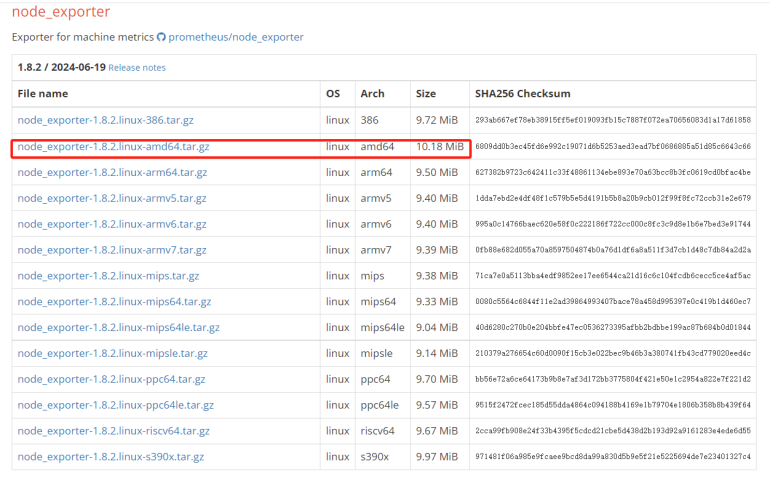
3)目前node-exporter最新版本为1.8.2。对于Arch(Architecture)架构,不同的架构名称代表不同的处理器架构或指令集体系结构,它们用于确定软件或操作系统在哪种硬件架构上运行。
**386:**这是Intel 80386 处理器架构,也被称为 x86。它是早期的32位处理器架构。
**amd64:**也称为x86-64 或 x64,这是一种64位的处理器架构,由 AMD 公司推出。它是基于 x86 架构的64位扩展,现在广泛用于桌面和服务器系统。
**arm64:**这是ARMv8-A 的64位处理器架构,主要应用于 ARM 架构的64位处理器,包括用于服务器、移动设备和嵌入式系统的处理器。
**armv5 和 armv6:**这两者都属于ARM 架构的32位处理器架构,分别对应于较旧的 ARM 处理器。它们通常用于嵌入式系统和一些较老的移动设备。
............
4)解压二进制node-exporter包
bashtar -zxvf node_exporter-1.8.2.linux-amd64.tar.gz5)移动并重命名node-exporter解压出来的目录
bashmv node_exporter-1.8.2.linux-amd64 /opt/prometheus ###移动到prometheus相关目录下 mv /opt/prometheus/node_exporter-1.8.2.linux-amd64 /opt/prometheus/node_exporter6)赋权
bashchown -R prometheus:prometheus /opt/prometheus/node_exporter7)写入linux启动服务项
bashcd /usr/lib/systemd/system vi node_exporter.service [Unit] Description=node_exporter After=network.target [Service] Type=simple User=prometheus Group=prometheus Restart=on-failure ExecStart=/opt/prometheus/node_exporter/node_exporter --web.listen-address=0.0.0.0:9100 [Install] WantedBy=multi-user.target systemctl daemon-reload systemctl start node_exporter.service systemctl enable node_exporter.service systemctl status node_exporter.service**###--web.listen-address=<address>:<port>:**指定服务端口。默认通过9100端口访问node_exporter管理界面,可以修改成其他端口用于访问node_exporter管理界面(如果没有修改端口的需求可以不设置这个参数)。此参数只能在node_exporter命令启动时指定,不可以在配置文件prometheus.yml中指定。
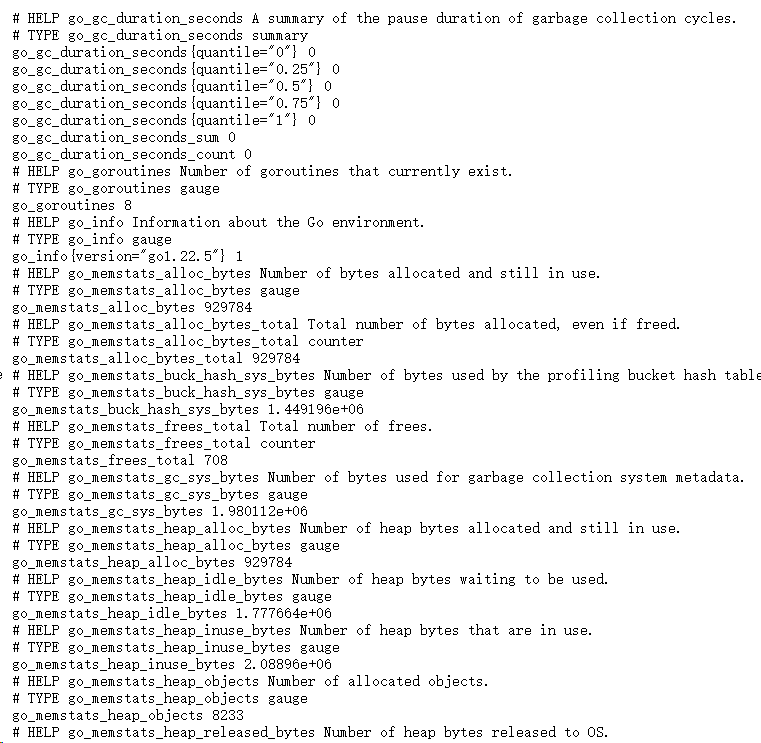
8)登录node-exporter界面管理,默认端口为9100
http://110.120.100.21:9100/metrics

五、将当前主机加入到prometheus监控,并通过Grafana展示
1)将node-exporter的信息加入到prometheus监控的配置文件prometheus.yml中
bashvi /opt/prometheus/prometheus.yml 在scrape_configs下面新增如下内容: # node-exporter配置 - job_name: "Prometheus服务器" scrape_interval: 15s static_configs: - targets: ["localhost:9100"] labels: instance: Prometheus服务器2)prometheus.yml文件添加了信息,所以重启prometheus进程或者重新加载配置文件(二选一)
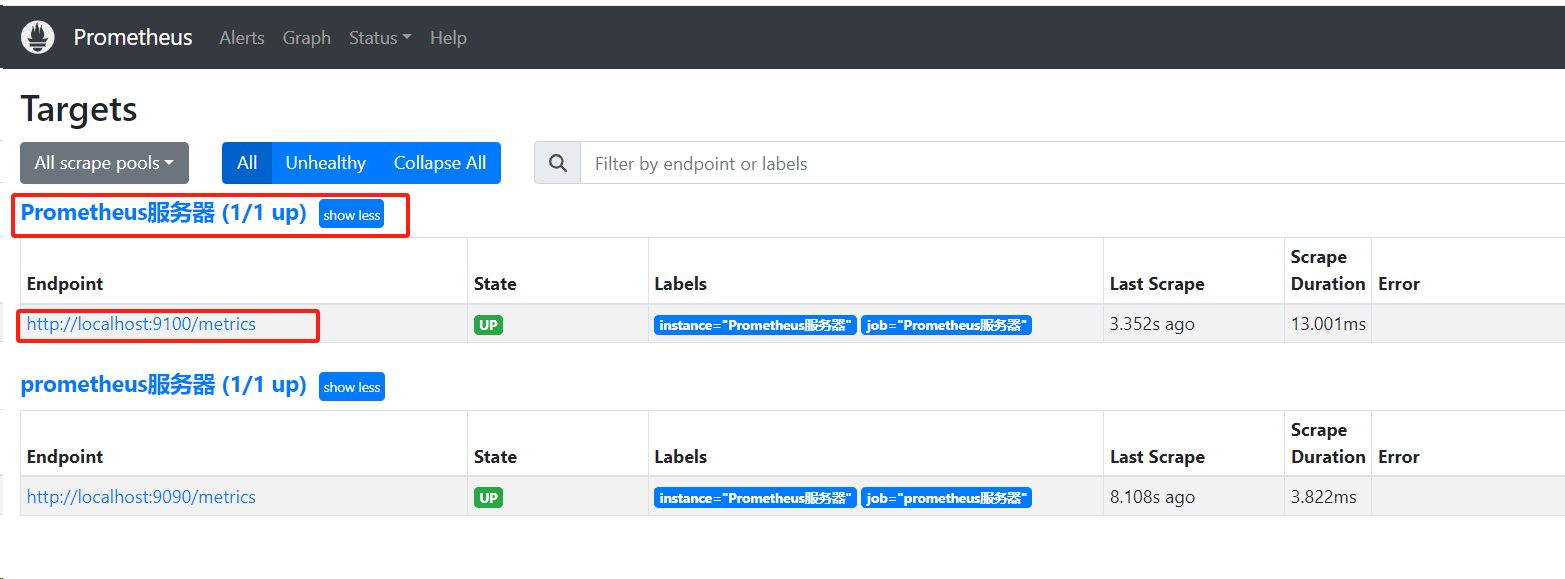
bash#重启 systemctl restart prometheus.service #重载:前提是在prometheus.service启动服务项中加了--web.enable-lifecycle参数 ###--web.enable-lifecycle:###启用Prometheus的生命周期接口,允许通过HTTP请求来动态重新加载配置等操作。这对于在运行时更新配置或执行其他管理操作非常有用,当修改了prometheus的配置后,可以通过curl命令来重新加载配置文件,而不需要重启prometheus。 curl -X POST http://localhost:9090/-/reload3)在prometheus查看是否可以看到监控信息
菜单栏:Status---Targets
4)登录Grafana界面管理,将当前主机的监控信息做展示
默认用户:admin
默认密码:admin
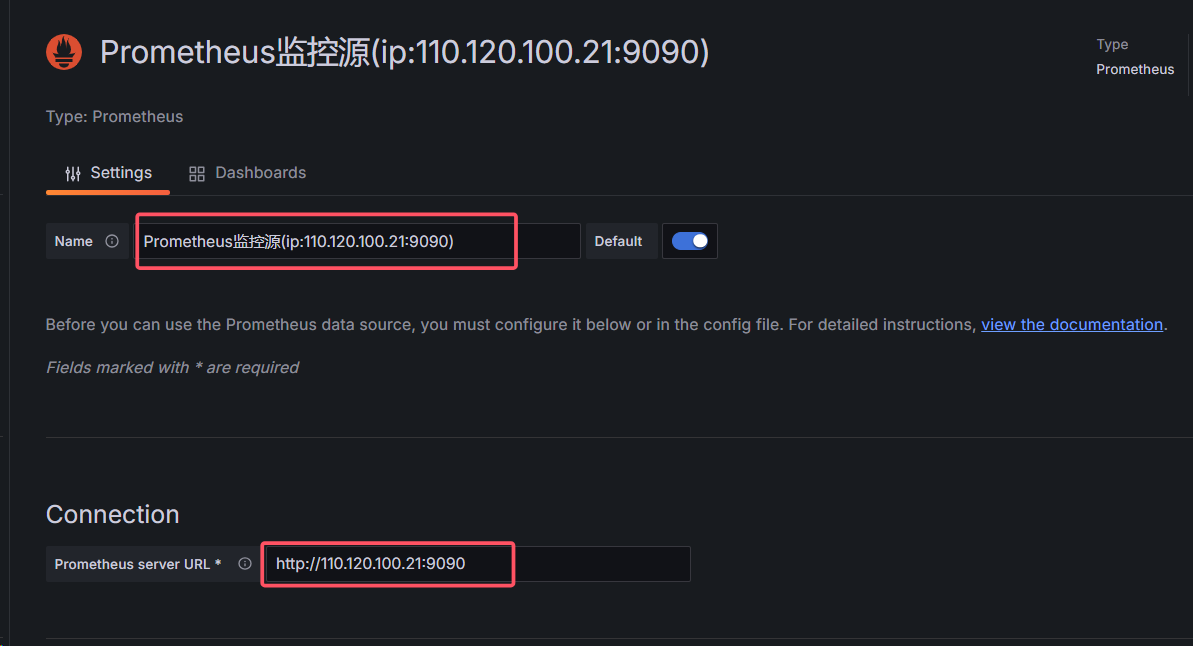
一、添加数据源:Connections---Data sources---选择"prometheus"---Add new data source
**Name:**定义名称。Prometheus监控源(ip:110.120.100.21:9090)
**Connection:**prometheus的地址,这里指的是prometheus监控的地址,而不是node-exporter的地址
....
然后保存
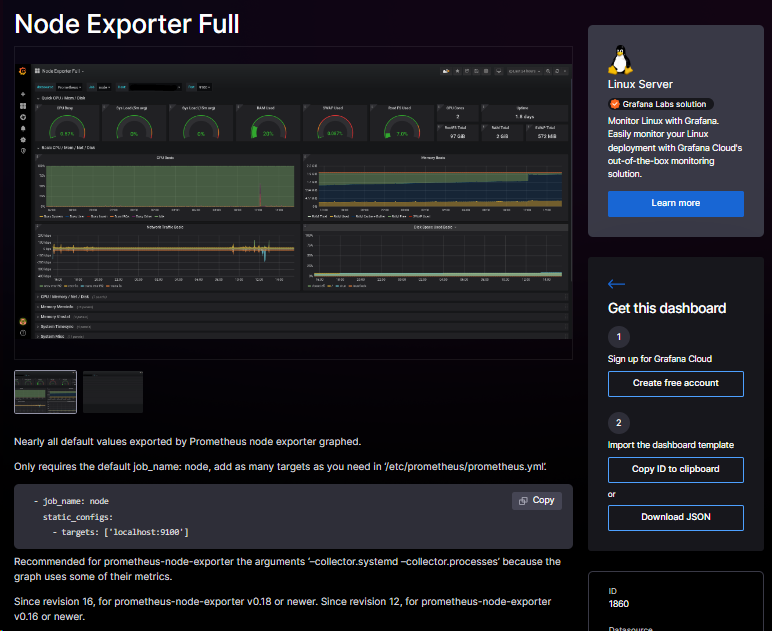
二、下载一个仪表盘:Grafana官网"http://www.grafana.com"---Dashboards,然后选择一个下载量高的自己喜欢的node-exporter(主机监控)
以1860为例,新增了多个指标,比较全面
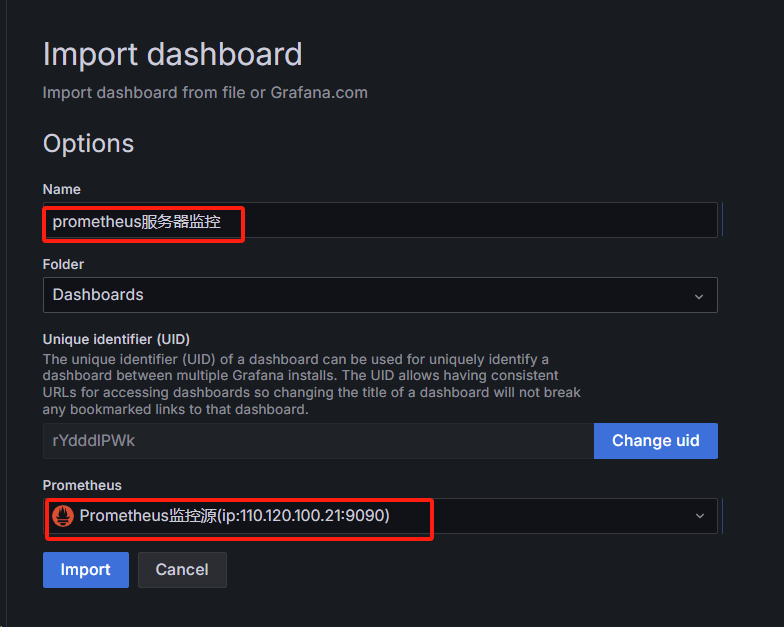
三、将仪表盘添加到Grafana上:Dashboards---New---Import---点击"Upload dashboard JSON file"
**Name:**定义名称,最好定义为主机ip加用途
**Prometheus:**选择prometheus源,Prometheus监控源(ip:110.120.100.21:9090)
....
然后import
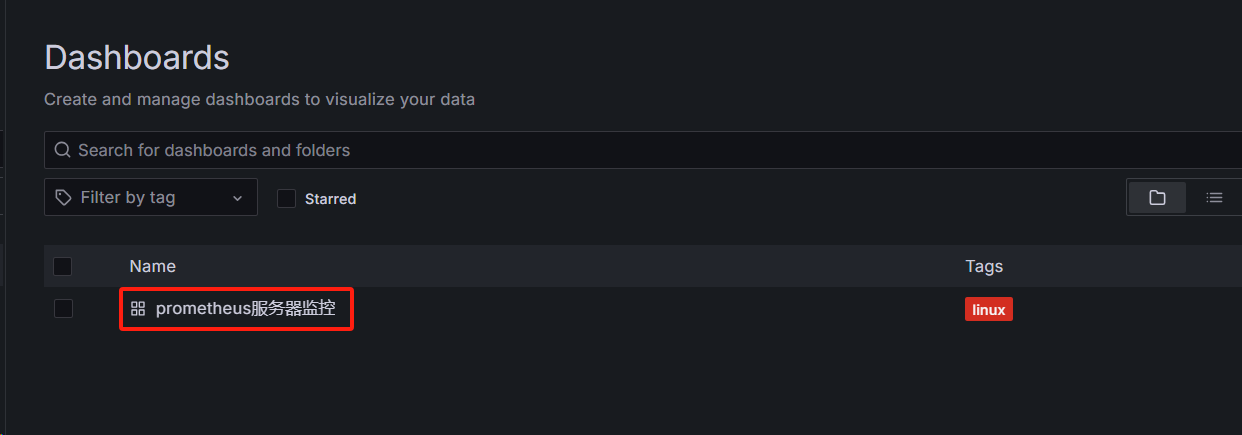
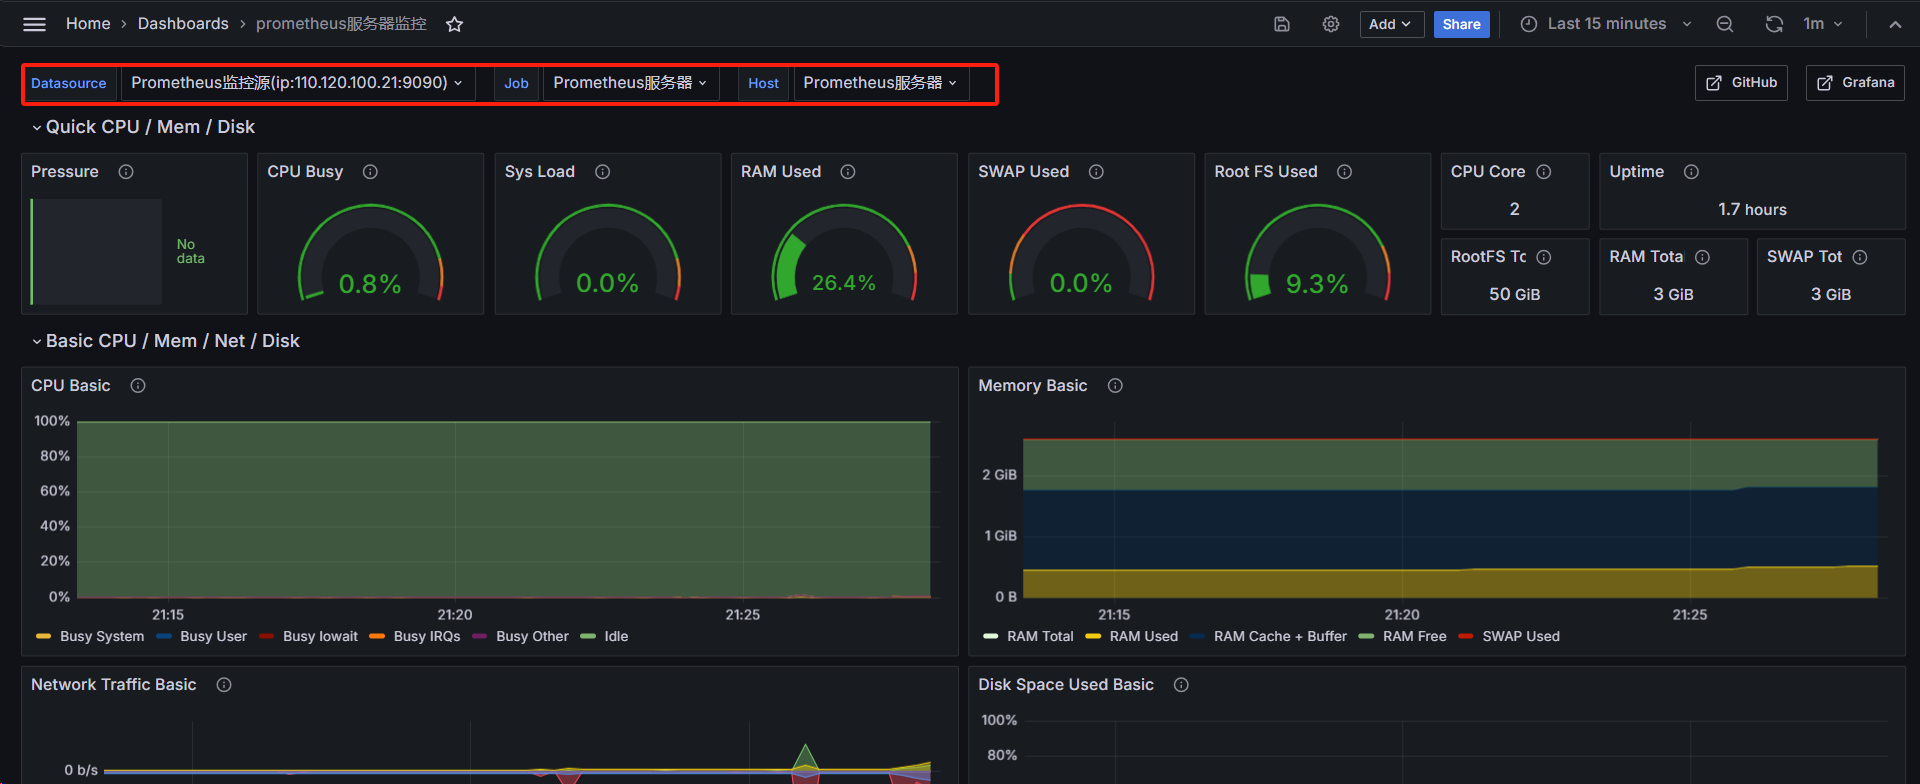
四、仪表盘展示:Dashboards---查看到已经定义好的仪表盘,并且数据源是prometheus监控,点击进去
**仪表盘Name:**prometheus服务器监控
**数据源Name:**prometheus监控,Prometheus监控源(ip:110.120.100.21:9090)
**Datasource:**选择在添加数据源时,已经定义好的"prometheus监控"
**Job:**这里其实就是当时已经在配置prometheus.yml时,定义的job_name,也就是说Grafana会自动识别到
**Host:**这里其实就是当时已经在配置prometheus.yml时,定义的instance,也就是说Grafana会自动识别到
呼,完结,撒花。博主觉得关于安装部署已经写的很清楚了,甚至有点"啰嗦",正式因为有了精益求精的精神才能把每一步安装流程都写的清楚明了,也希望这边文章可以成为各位安装prometheus+Grafana的标准化文章。那么我们下一篇安装和配置alertmanager见!!!