【README】
plot画图有两种方法:包括 plt.plot(), ax.plot()-画多个子图 ,其中ax表示某个坐标轴;
【1】画单个图
python
import matplotlib
# 避免兼容性问题:明确指定 matplotlib 使用兼容的后端,TkAgg 或 Agg
matplotlib.use('TkAgg')
import matplotlib.pyplot as plt
import numpy as np

# 设置画布大小(宽=8个单位,高=4个单位)
figure01 = plt.figure(figsize=(8, 4))

# plot画图有两种方法:包括 plt.plot(), ax.plot()-画多个子图 ,其中ax表示某个坐标轴

X = np.arange(0, 12.1, 0.1)
Y = np.sin(X)
# 画线
# marker 画点
# linestyle 设置为空串,plt.plot()画出来的是散点图
# zorder 设置图像上下层(数值越大,在上层)
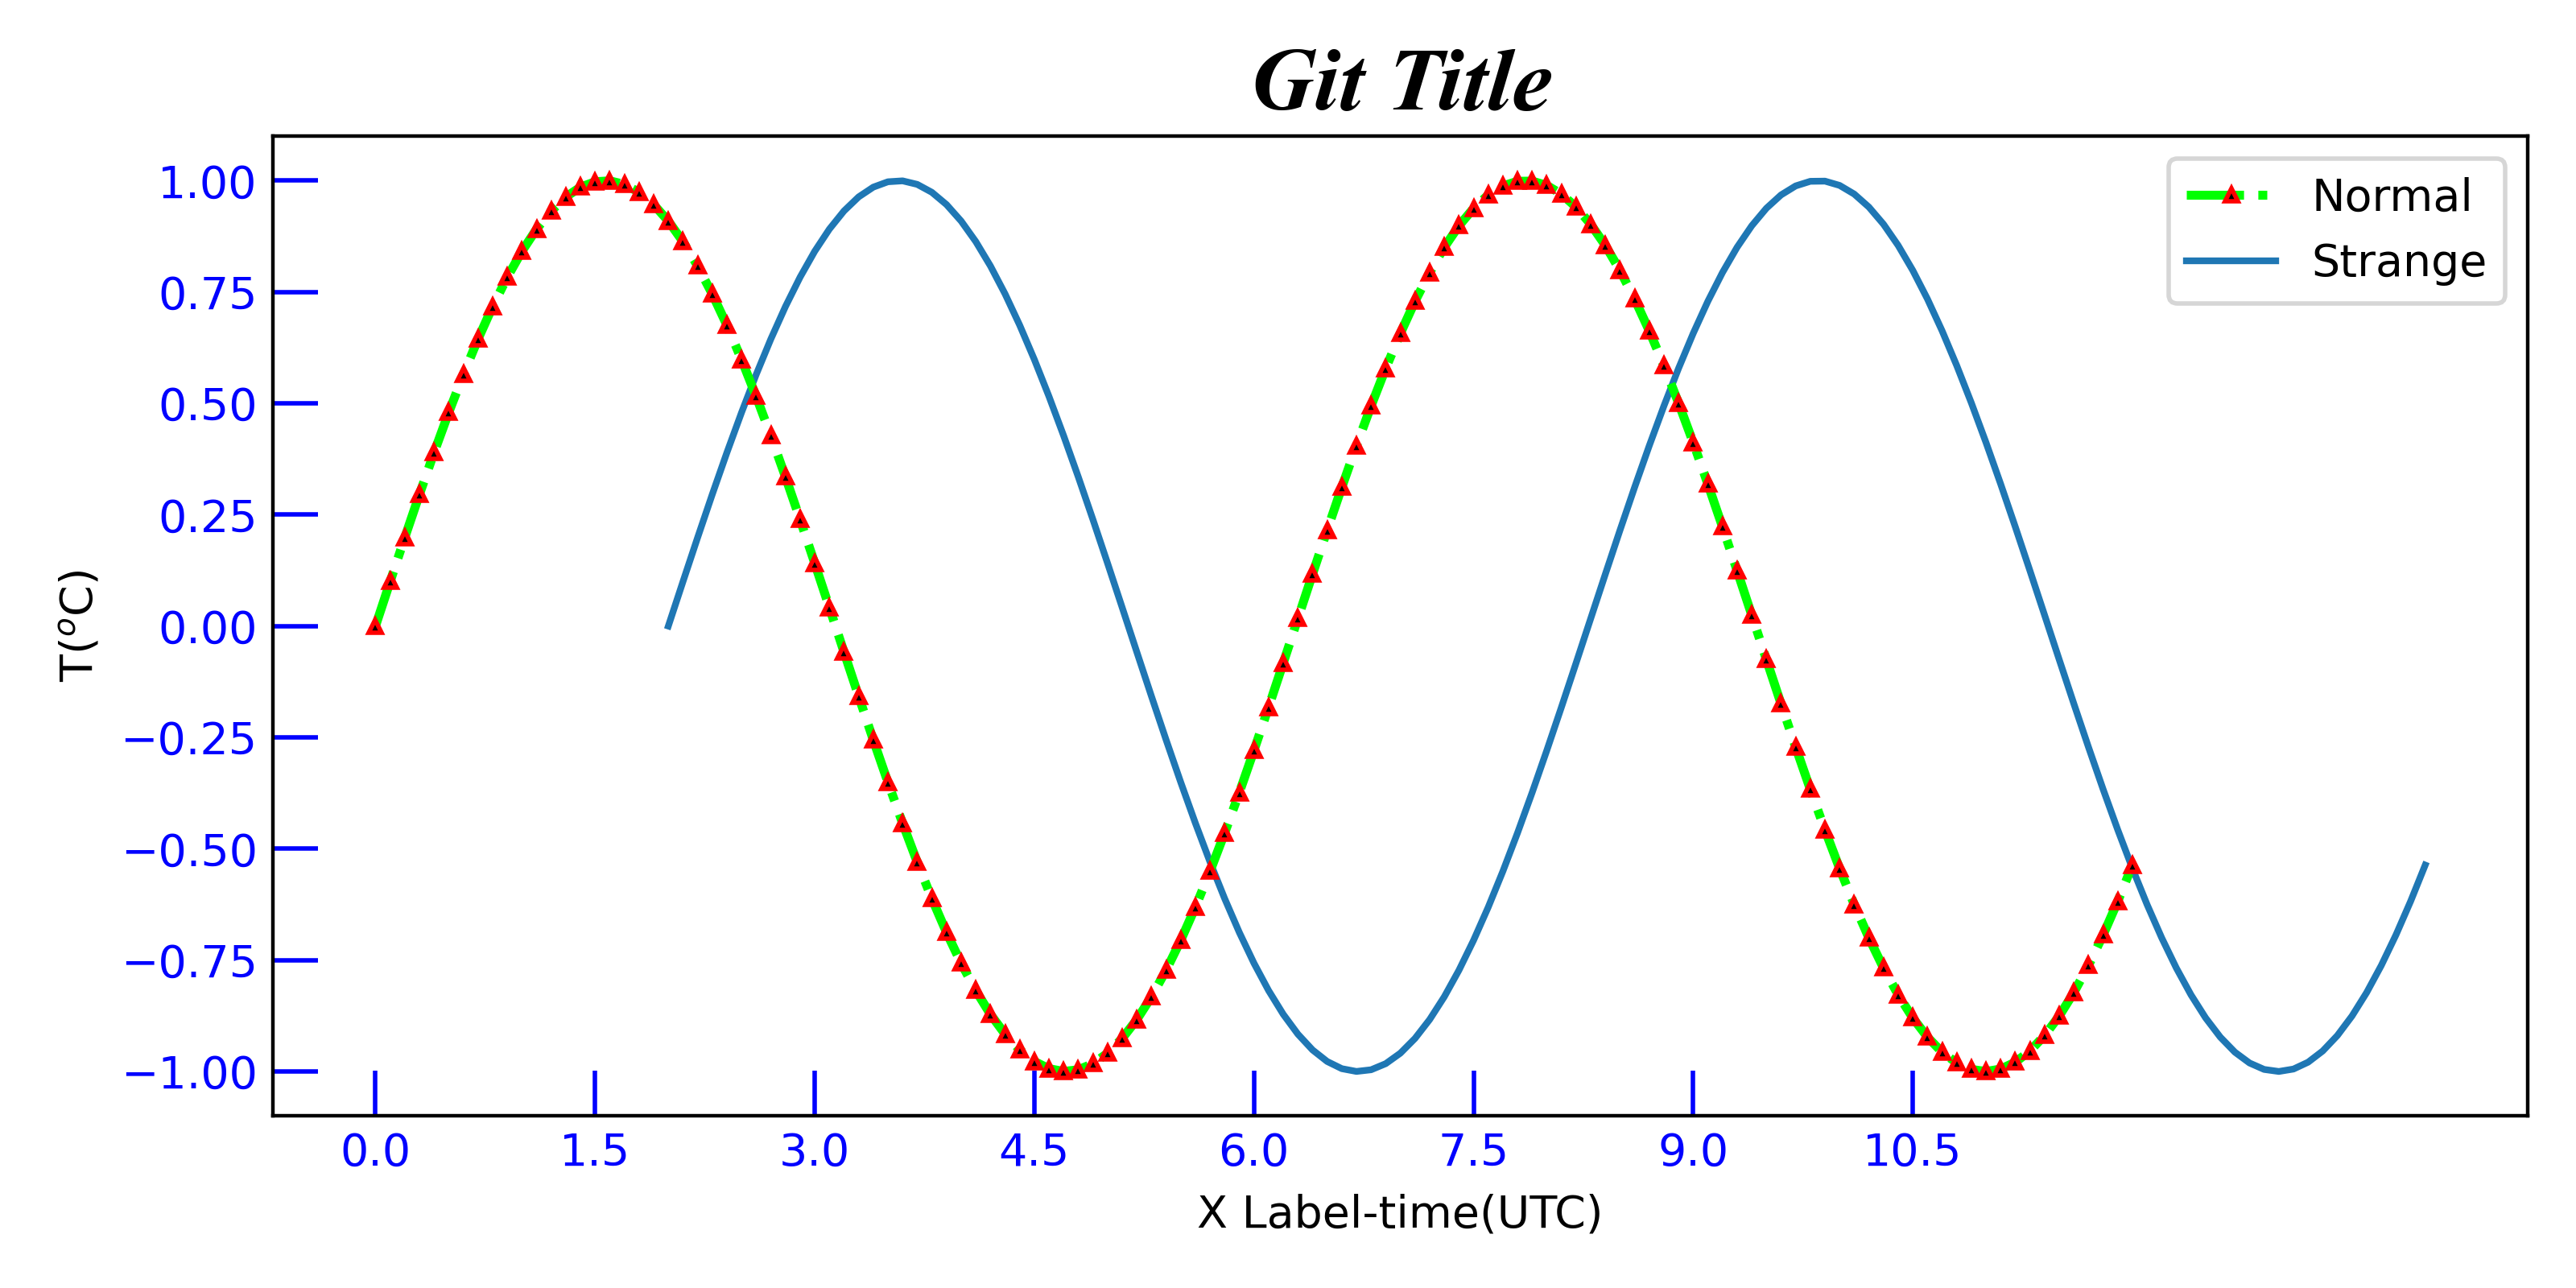
plt.plot(X, Y, color='lime', linestyle='-.', linewidth=2,
         marker='^', markerfacecolor='black', markeredgecolor='red', markersize=3, markeredgewidth=1, label='Normal',  zorder=2)

# 获取坐标轴
ax1 = plt.gca()
ax1.set_title('Git Title', fontname='Times New Roman', fontsize='20', weight='bold', style='italic')
ax1.set_xlabel('X Label-time(UTC)')
ax1.set_ylabel('T($^o$C)')

# 设置刻度
ax1.set_xticks(np.arange(0, 12, 1.5))
# 设置刻度属性,如方向,颜色
ax1.tick_params(axis='both', direction='in', colors='blue', length=10, width=1)

# 画多个图
plt.plot(X+2, Y, label='Strange', zorder=1)

# plt.plot() 设置多个图的label标签,然后调用plt.legend()显式图例标签
plt.legend()

# 画图紧致布局
plt.tight_layout()
# 保存
plt.savefig('./matplotlib_exercise01.png', dpi=400)

plt.show()

# 画散点图
# plt.scatter(X, Y)
# # plt.show()
结果:
【2】一个面板画多个图
python
import matplotlib
matplotlib.use('TkAgg')
import matplotlib.pyplot as plt
import numpy as np

# plot画子图
X = np.arange(0, 12.1, 0.1)
Y = np.sin(X)

# 获取多个子图的图像与坐标轴
# figure表示画布, ax_array表示坐标轴数组
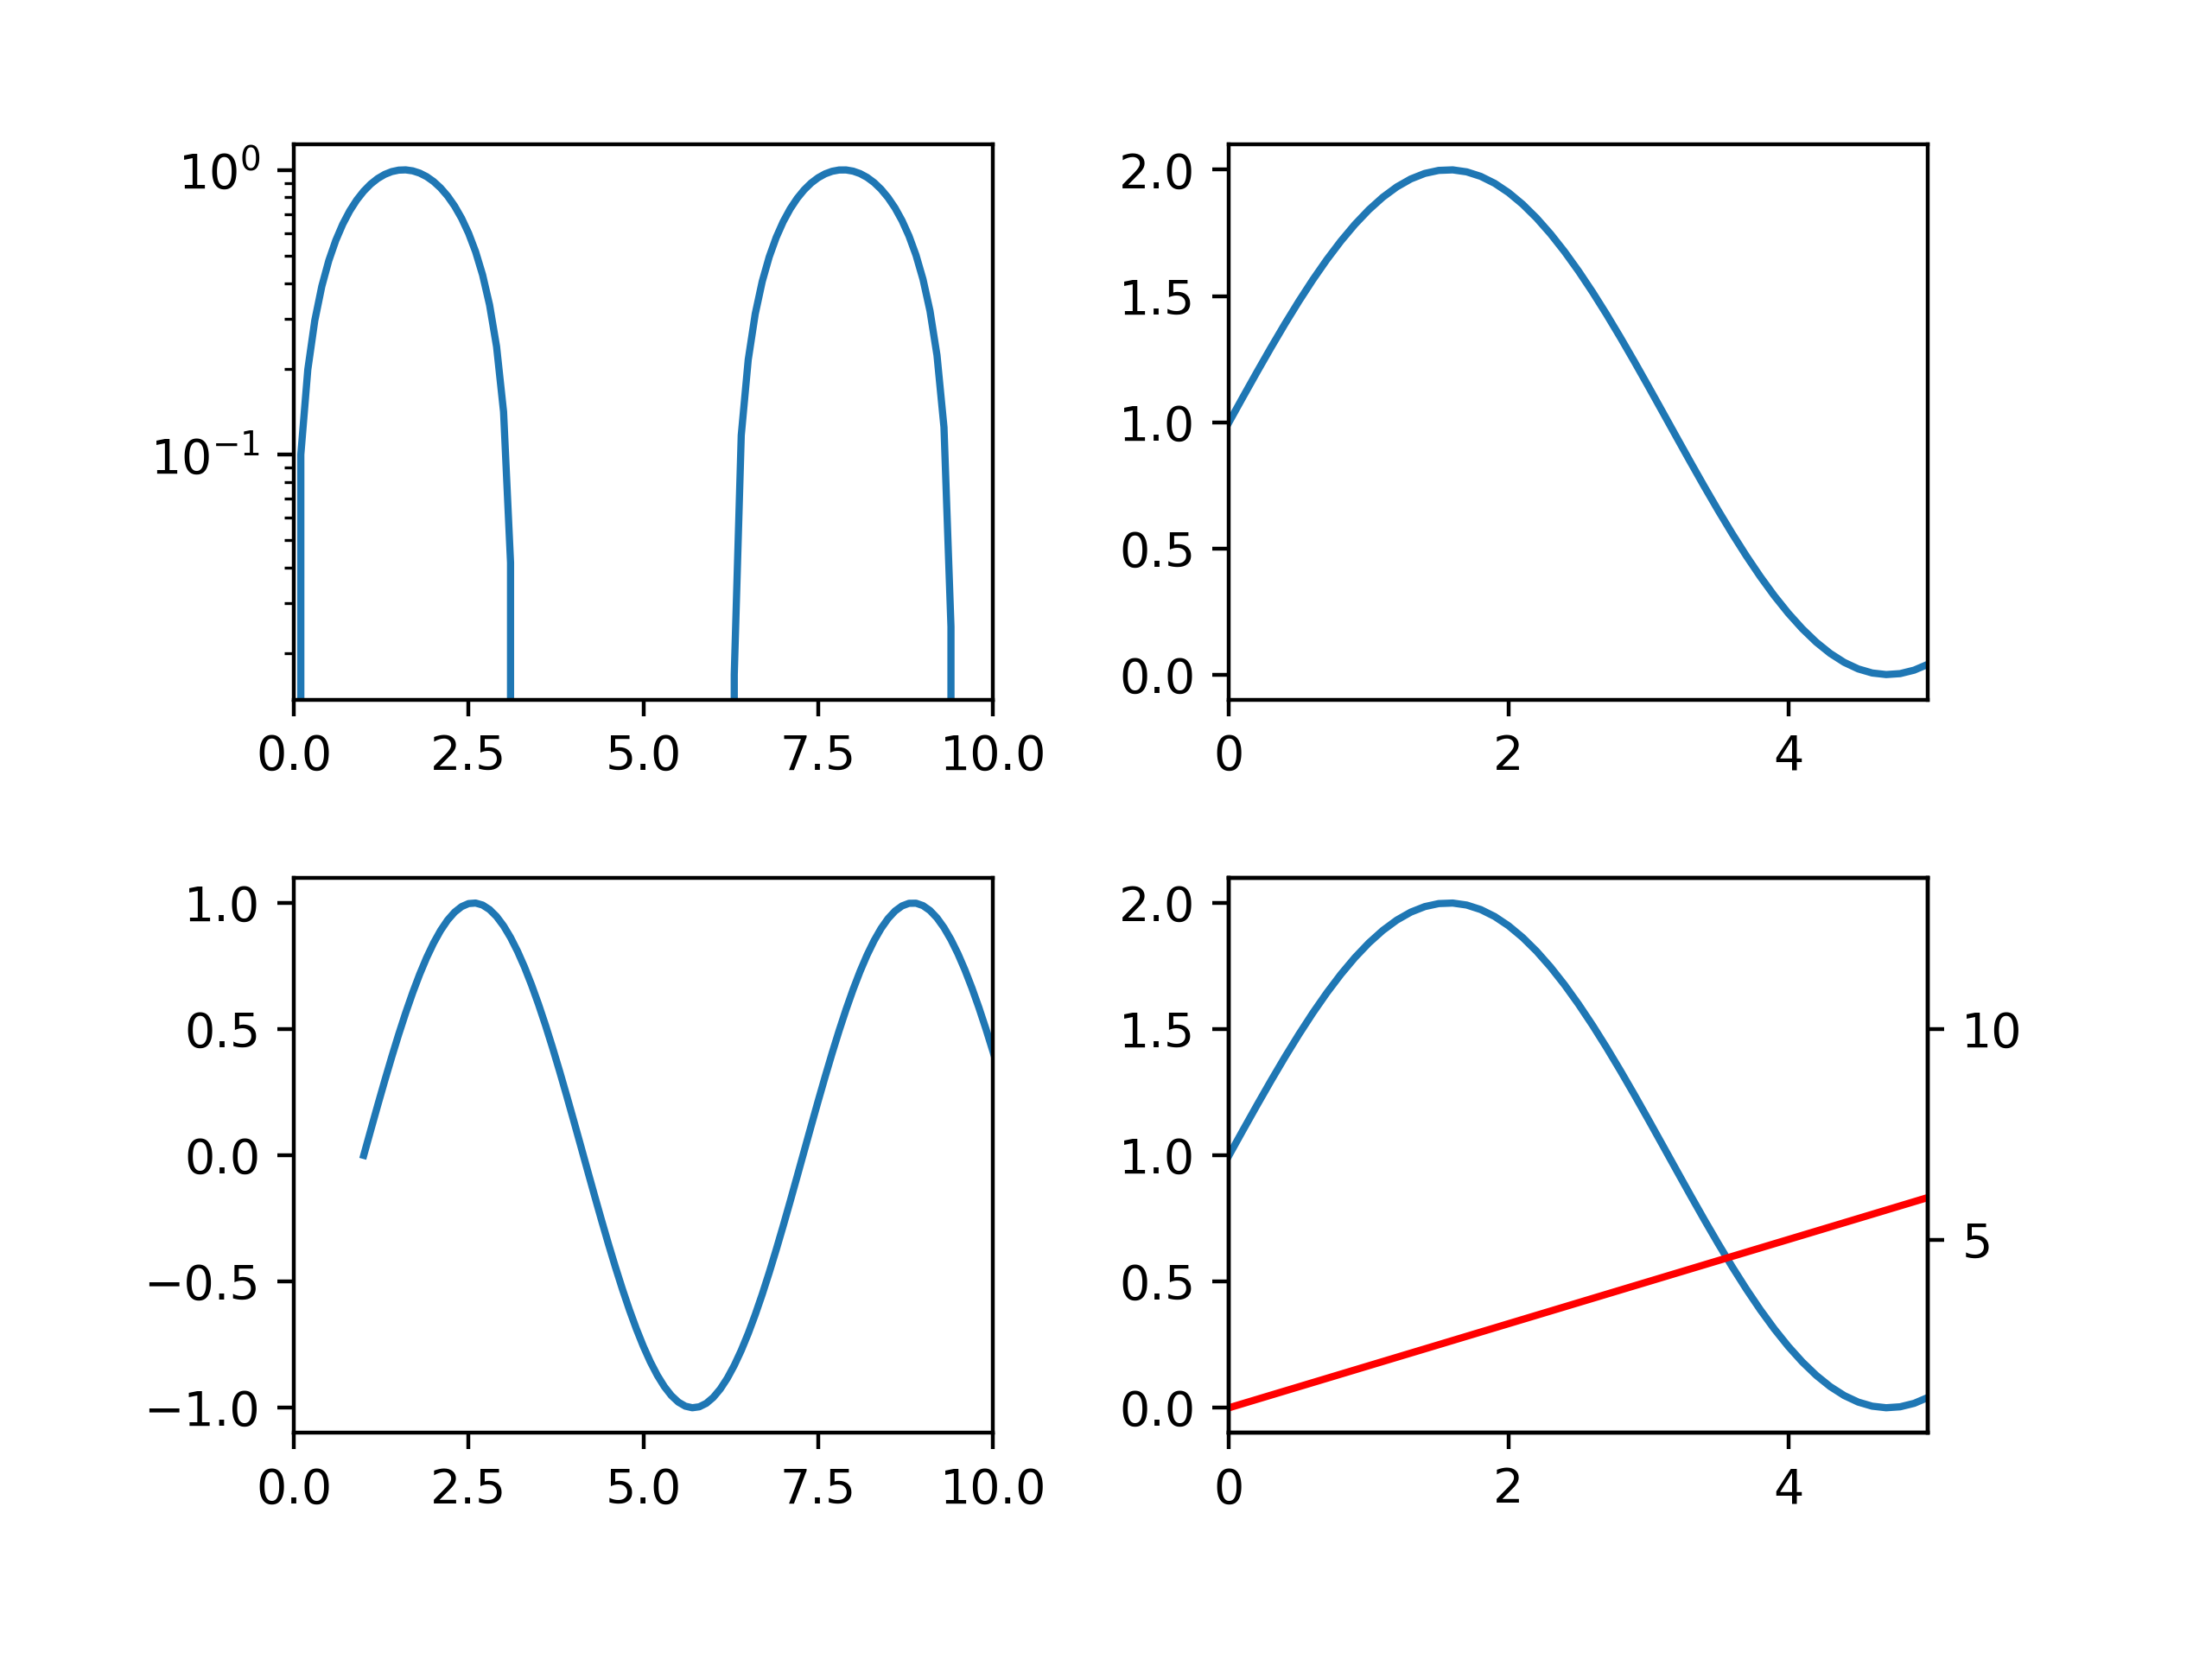
figure, ax_array = plt.subplots(nrows=2, ncols=2)
print("type(figure) = ", type(figure))
print("type(ax_array) = ", type(ax_array))
# type(figure) =  <class 'matplotlib.figure.Figure'>
# type(ax_array) =  <class 'numpy.ndarray'>

ax_array[0, 0].plot(X, Y)
ax_array[0, 1].plot(X, Y + 1)
ax_array[1, 0].plot(X + 1, Y)
ax_array[1, 1].plot(X, Y + 1)


# 设置x轴的取值范围相同,以便比较
ax_array[0, 0].set_xlim([0, 10])
ax_array[1, 0].set_xlim([0, 10])
ax_array[0, 1].set_xlim([0, 5])
ax_array[1, 1].set_xlim([0, 5])

# 设置y轴为指数坐标轴
ax_array[0, 0].set_yscale('log')

# 设置双坐标轴(在ax4坐标轴基础上画第2个坐标轴 ax4_twinx)
# ax00 与 ax00_twinx 共用同一个x轴
ax4 = ax_array[1, 1]
ax4_twinx = ax4.twinx()
X4 = np.arange(0, 12.1, 0.1)
Y4 = X + 1
ax4_twinx.plot(X4, Y4, 'r')

# 自动调整布局,并设置间距
figure.tight_layout(
    pad=3.0,      # 画布边缘间距
    w_pad=2.0,    # 水平间距
    h_pad=2.0     # 垂直间距
)
plt.show()
【结果】