文章目录
- 1.概述
- 2.被监控服务器相关软件安装
-
- [2.1 Docker、Docker-Compose安装](#2.1 Docker、Docker-Compose安装)
- [2.2 基础软件、采集软件容器化部署](#2.2 基础软件、采集软件容器化部署)
- 3.监控服务器核心组件安装
-
- 3.1.Prometheus安装
-
- [3.1.1 安装流程](#3.1.1 安装流程)
- [3.1.2 修改prometheus.yml](#3.1.2 修改prometheus.yml)
- [3.1.3 添加监控规则文件](#3.1.3 添加监控规则文件)
- [3.1.4 自定义Systemctl](#3.1.4 自定义Systemctl)
- [3.1.5 启动Prometheus](#3.1.5 启动Prometheus)
- 3.1.6.访问Prometheus后台
- [3.1.7 检查target是否已经加载](#3.1.7 检查target是否已经加载)
- [3.1.8 检查rules是否已经加载](#3.1.8 检查rules是否已经加载)
- 3.1.9.备注说明
- 3.2.Grafana安装
-
- 3.2.1.安装流程
- [3.2.2 自定义Systemctl](#3.2.2 自定义Systemctl)
- [3.2.3 启动Grafana](#3.2.3 启动Grafana)
- [3.2.4 访问Grafana后台](#3.2.4 访问Grafana后台)
- [3.2.5 添加Prometheus数据源](#3.2.5 添加Prometheus数据源)
- [3.2.6 添加Dashboard(服务器监控仪表盘)](#3.2.6 添加Dashboard(服务器监控仪表盘))
- [3.2.7 添加Dashboard(容器监控仪表盘)](#3.2.7 添加Dashboard(容器监控仪表盘))
- [3.2.8 添加JAVA监控(JVM监控仪表盘)](#3.2.8 添加JAVA监控(JVM监控仪表盘))
- [3.2.9 添加Mysql监控(Mysql监控仪表盘)](#3.2.9 添加Mysql监控(Mysql监控仪表盘))
- [3.2.10 添加Nginx监控(Nginx监控仪表盘)](#3.2.10 添加Nginx监控(Nginx监控仪表盘))
- [3.2.11 添加Redis监控(Redis监控仪表盘)](#3.2.11 添加Redis监控(Redis监控仪表盘))
- [3.2.12 添加黑盒监控(黑盒监控仪表盘)](#3.2.12 添加黑盒监控(黑盒监控仪表盘))
- 3.3.AlertManager安装
-
- 3.3.1.安装流程
- 3.3.2.修改alertmanager.yml
- 3.3.3.邮件通知相关配置
-
- [3.3.3.1 获取163邮件授权码](#3.3.3.1 获取163邮件授权码)
- [3.3.3.2 编定义邮件模板(可选)](#3.3.3.2 编定义邮件模板(可选))
- 3.3.4.企业微信通知相关配置
- [3.3.5 自定义服务通知相关配置(springboot为例)](#3.3.5 自定义服务通知相关配置(springboot为例))
-
- [3.3.5.1 修改pom.xml](#3.3.5.1 修改pom.xml)
- [3.3.5.2 修改application.yml](#3.3.5.2 修改application.yml)
- [3.3.5.3 添加webhook接口](#3.3.5.3 添加webhook接口)
- [3.3.6 自定义Systemctl](#3.3.6 自定义Systemctl)
- [3.3.7 启动AlertManager](#3.3.7 启动AlertManager)
- [3.3.8 告警效果展示](#3.3.8 告警效果展示)
-
- [3.3.8.1 邮件告警效果展示](#3.3.8.1 邮件告警效果展示)
- [3.3.8.2 企业微信告警效果展示](#3.3.8.2 企业微信告警效果展示)
1.概述
服务器资源情况:
| 服务器名 | IP | CPU | 内存 | 描述 |
|---|---|---|---|---|
| prometheus | 192.168.25.41 | 1 | 1.9G | 安装Prometheus、Grafana、AlertManager。模拟监控的服务器 |
| prometheus-monitor-node | 192.168.25.42 | 1 | 1.9G | 安装一些基础软件、应用服务。模拟被监控的服务器 |
192.168.25.41 监控服务器上软件安装情况:
| IP | 端口 | 软件名称 | 版本 | 安装方式 | 完整安装包名称 | 备注 |
|---|---|---|---|---|---|---|
| 192.168.25.41 | 9090 | prometheus | 3.1.0 | 二进制方式 | prometheus-3.1.0.linux-amd64.tar.gz | 监控的核心组件 |
| 192.168.25.41 | 3000 | grafana | 11.5.1 | 二进制方式 | grafana-enterprise-11.5.1.linux-amd64.tar.gz | 提供图形化监控数据展示 |
| 192.168.25.41 | 9093 | alertmanager | 0.28.0 | 二进制方式 | alertmanager-0.28.0.linux-amd64.tar.gz | 告警通知 |
| 192.168.25.41 | 9100 | node_exporter | 1.8.2 | 二进制方式 | node_exporter-1.8.2.linux-amd64.tar.gz | (可选安装)对服务器资源进行监控,并把数据提供给Prometheus。 |
192.168.25.42 被监控服务器上软件安装情况:
| IP | 端口 | 软件名称 | 版本 | 安装方式 | 备注 |
|---|---|---|---|---|---|
| 192.168.25.42 | docker | 24.0.2 | 二进制方式 | 用于运行其他软件、服务 | |
| 192.168.25.42 | docker-compose | v2.5.0 | 二进制方式 | ||
| 192.168.25.42 | 80 | nginx | 1.27.4 | 容器方式 | Nginx服务 |
| 192.168.25.42 | 6379 | redis | 6.2.17 | 容器方式 | Redis服务 |
| 192.168.25.42 | 3306 | mysql | 6.2.17 | 容器方式 | MySql服务 |
| 192.168.25.42 | 8081 | java-web-demo | 0.0.4 | 容器方式 | java应用服务(这是本人私有的镜像) |
| 192.168.25.42 | 8080 | cadvisor | v0.33.0 | 容器方式 | 用于采集Docker的监控数据 |
| 192.168.25.42 | 9091 | pushgateway | v1.11.0 | 容器方式 | 用户可将采集数据发到pushgateway,由pushgatway将采集数据推到Prometheus |
| 192.168.25.42 | 8080 | cadvisor | v0.33.0 | 容器方式 | 用于采集Docker的监控数据 |
| 192.168.25.42 | 9100 | node_exporter | v1.5.0 | 容器方式 | 用于采集服务器的监控数据 |
| 192.168.25.42 | 9113 | nginx_exporter | v1.5.0 | 容器方式 | 用于采集Nginx的监控数据 |
| 192.168.25.42 | 9121 | redis_exporter | v1.5.0 | 容器方式 | 用于采集Redis的监控数据 |
| 192.168.25.42 | 9104 | mysqld-exporter | v1.5.0 | 容器方式 | 用于采集MySql的监控数据(也可监控Mariadb) |
| 192.168.25.42 | 9100 | blackbox_exporter | 0.25.0 | 容器方式 | 采集外部地址数据。如http、tcp、icpm等 |
注:软件下载地址:https://prometheus.io/download/
注:软件下载地址:https://prometheus.io/download/
2.被监控服务器相关软件安装
2.1 Docker、Docker-Compose安装
参考安装文档:Centos7.9离线安装Docker24(无坑版)
或直接使用:docker-v1.24 一键部署脚本
2.2 基础软件、采集软件容器化部署
创建docker-compose.yaml文件
内容如下:
bash
version: '3.3'

volumes:
  prometheus_data: {}
  grafana_data: {}

networks:
  monitoring:
    driver: bridge

services:
  nginx:
    image: nginx:1.27.4
    container_name: nginx
    restart: always
    ports:
      - 80:80
    volumes:
      - /etc/localtime:/etc/localtime:ro
      - /root/default.conf:/etc/nginx/conf.d/default.conf
    environment:
      - TZ=Asia/Shanghai
  redis:
    image: redis:6.2.17
    container_name: redis
    command: redis-server --requirepass 123456 --maxmemory 512mb
    restart: always
    #volumes:
    #  - /data/redis/data:/data
    ports:
      - 6379:6379
  db:
    image: mysql:8.0.37
    restart: always
    container_name: mysql
    environment:
      TZ: Asia/Shanghai
      LANG: en_US.UTF-8
      MYSQL_ROOT_PASSWORD: 123456
    command:
      --default-authentication-plugin=mysql_native_password
      --character-set-server=utf8mb4
      --collation-server=utf8mb4_general_ci
      --lower_case_table_names=1
      --performance_schema=1
      --sql-mode=""
      --skip-log-bin
    volumes:
      - /data/mysql/conf:/etc/mysql/conf.d #数据文件挂载
      - /data/mysql/data:/var/lib/mysql #数据文件挂载
    ports:
       - 3306:3306
  java-web-demo:
    image: java-web-demo:0.0.4
    container_name: springboot-web-demo
    restart: always
    ports:
      - 8081:8080

  pushgateway:
    image: prom/pushgateway:v1.11.0
    container_name: pushgateway
    restart: always
    ports:
      - "9091:9091"

  cadvisor:
    image: google/cadvisor:v0.33.0
    container_name: cadvisor
    restart: always
    privileged: true
    ports:
      - 8080:8080
    volumes:
      - /etc/localtime:/etc/localtime:ro
      - /:/rootfs:ro
      - /var/run:/var/run:rw
      - /sys:/sys:ro
      - /var/lib/docker/:/var/lib/docker:ro
    environment:
      - TZ=Asia/Shanghai
    networks:
      - monitoring
  node_exporter:
    image: prom/node-exporter:v1.5.0
    container_name: node-exporter
    restart: always
    ports:
      - 9100:9100
    network_mode: "host"
    volumes:
      - /etc/localtime:/etc/localtime:ro
      - /proc:/host/proc:ro
      - /sys:/host/sys:ro
      - /:/rootfs:ro
    environment:
      TZ: Asia/Shanghai
    command:
      - '--web.listen-address=:9100'
      - '--path.procfs=/host/proc'
      - '--path.sysfs=/host/sys'
      - "--path.rootfs=/rootfs"
      - '--collector.filesystem.ignored-mount-points=^/(sys|proc|dev|host|etc|rootfs/var/lib/docker)($$|/)'
  nginx_exporter:
    image: nginx/nginx-prometheus-exporter:0.11
    container_name: nginx_exporter
    hostname: nginx_exporter
    command:
     - '-nginx.scrape-uri=http://192.168.25.42/stub_status'
    restart: always
    ports:
    - "9113:9113"
  redis_exporter:
    image: oliver006/redis_exporter
    container_name: redis_exporter
    restart: always
    environment:
      REDIS_ADDR: "192.168.25.42:6379"
      REDIS_PASSWORD: 123456
    ports:
      - "9121:9121"
  mysqld-exporter:
    image: prom/mysqld-exporter
    container_name: mysqld-exporter
    restart: always
    command:
      - '--collect.info_schema.processlist'
      - '--collect.info_schema.innodb_metrics'
      - '--collect.info_schema.tablestats'
      - '--collect.info_schema.tables'
      - '--collect.info_schema.userstats'
      - '--collect.engine_innodb_status'
      - '--config.my-cnf=/my.cnf'
    volumes:
      - /root/my.cnf:/my.cnf
    ports:
      - 9104:9104
  blackbox_exporter:
    image: prom/blackbox-exporter:v0.25.0
    container_name: blackbox_exporter
    restart: always
    volumes:
    - /data/blackbox_exporter:/etc/blackbox_exporter
    ports:
    - 9115:9115
上面数据卷挂载将宿主机中指定文件映射到容器,故而宿主机上还需要有相关文件或者文件夹,具体如下:
Nginx的default.conf文件完整内容如下::
bash
[root@prometheus-monitor-node ~]# cat default.conf
server {
    listen       80;
    listen  [::]:80;
    server_name  localhost;

    #access_log  /var/log/nginx/host.access.log  main;

    location / {
        root   /usr/share/nginx/html;
        index  index.html index.htm;
    }

    location /stub_status {
        stub_status on;
        access_log off;
        #allow nginx_export的ip;
        allow 0.0.0.0/0;
        deny all;
    }

    #error_page  404              /404.html;

    # redirect server error pages to the static page /50x.html
    #
    error_page   500 502 503 504  /50x.html;
    location = /50x.html {
        root   /usr/share/nginx/html;
    }
}
Mysql的my.conf文件完整内容
bash
[root@prometheus-monitor-node ~]# cat my.cnf
[client]
host=192.168.25.42
user=exporter
password=123456
port=3306黑盒blackbox_exporter的config.yml文件完整内容如下:
- 注:/data/blackbox_exporter只有一个config.yml文件,没有其他文件了。
bash
mkdir -p /data/blackbox_exporter
bash
[root@prometheus-monitor-node ~]# cat /data/blackbox_exporter/config.yml
modules:
  http_2xx:
    prober: http
    http:
      method: GET
  http_post_2xx:
    prober: http
    http:
      method: POST
  tcp_connect:
    prober: tcp
  pop3s_banner:
    prober: tcp
    tcp:
      query_response:
      - expect: "^+OK"
      tls: true
      tls_config:
        insecure_skip_verify: false
  grpc:
    prober: grpc
    grpc:
      tls: true
      preferred_ip_protocol: "ip4"
  grpc_plain:
    prober: grpc
    grpc:
      tls: false
      service: "service1"
  ssh_banner:
    prober: tcp
    tcp:
      query_response:
      - expect: "^SSH-2.0-"
      - send: "SSH-2.0-blackbox-ssh-check"
  irc_banner:
    prober: tcp
    tcp:
      query_response:
      - send: "NICK prober"
      - send: "USER prober prober prober :prober"
      - expect: "PING :([^ ]+)"
        send: "PONG ${1}"
      - expect: "^:[^ ]+ 001"
  icmp:
    prober: icmp
  icmp_ttl5:
    prober: icmp
    timeout: 5s
    icmp:
      ttl: 5
运行相关服务
bash
docker -f docker-compose.yaml up -d最终效果如下:
bash
[root@prometheus-monitor-node ~]# docker ps
CONTAINER ID   IMAGE                                  COMMAND                   CREATED          STATUS                    PORTS                                                  NAMES
e45f0d5ece57   google/cadvisor:v0.33.0                "/usr/bin/cadvisor -..."   32 minutes ago   Up 32 minutes (healthy)   0.0.0.0:8080->8080/tcp, :::8080->8080/tcp              cadvisor
394ca6fc8915   prom/pushgateway:v1.11.0               "/bin/pushgateway"        3 days ago       Up 55 minutes             0.0.0.0:9091->9091/tcp, :::9091->9091/tcp              pushgateway
f5e38277ceca   prom/blackbox-exporter:v0.25.0         "/bin/blackbox_expor..."   7 days ago       Up 55 minutes             0.0.0.0:9115->9115/tcp, :::9115->9115/tcp              blackbox_exporter
1e38cd21cf0e   nginx:1.27.4                           "/docker-entrypoint...."   7 days ago       Up 55 minutes             0.0.0.0:80->80/tcp, :::80->80/tcp                      nginx
bdc5b8b4b4f4   java-web-demo:0.0.4                    "java -jar app.jar"       9 days ago       Up 55 minutes             0.0.0.0:8081->8080/tcp, :::8081->8080/tcp              springboot-web-demo
e0b0e18151ea   prom/mysqld-exporter                   "/bin/mysqld_exporte..."   10 days ago      Up 55 minutes             0.0.0.0:9104->9104/tcp, :::9104->9104/tcp              mysqld-exporter
1528db64726b   redis:6.2.17                           "docker-entrypoint.s..."   10 days ago      Up 55 minutes             0.0.0.0:6379->6379/tcp, :::6379->6379/tcp              redis
82eb7094818c   mysql:8.0.37                           "docker-entrypoint.s..."   10 days ago      Up 55 minutes             0.0.0.0:3306->3306/tcp, :::3306->3306/tcp, 33060/tcp   mysql
452c7fb8c129   oliver006/redis_exporter               "/redis_exporter"         10 days ago      Up 55 minutes             0.0.0.0:9121->9121/tcp, :::9121->9121/tcp              redis_exporter
c63f2666c72b   nginx/nginx-prometheus-exporter:0.11   "/usr/bin/nginx-prom..."   10 days ago      Up 55 minutes             0.0.0.0:9113->9113/tcp, :::9113->9113/tcp              nginx_exporter
50ca88f777b8   prom/node-exporter:v1.5.0              "/bin/node_exporter ..."   10 days ago      Up 55 minutes                                                                    node-exporter
注1 :docker方式查看容器列表:docker ps
注2 :docker方式重启容器:docker restart 容器名
注3 :docker方式查看容器日志:docker logs -f 容器名
注4 :docker-compose方式查看容器列表:docker-compose ps
注5:docker-compose重启/重新加载指定服务:docker -f docker-compose.yaml up -d 服务名
3.监控服务器核心组件安装
3.1.Prometheus安装
3.1.1 安装流程
bash
# 下载安装包
wget https://github.com/prometheus/prometheus/releases/download/v3.1.0/prometheus-3.1.0.linux-amd64.tar.gz
# 创建安装目录
mkdir -p /opt/software/prometheus/
# 解压到特定目录
tar -zxvf prometheus-3.1.0.linux-amd64.tar.gz -C /opt/software/prometheus/
#重命名
mv /opt/software/prometheus/prometheus-3.1.0.linux-amd64 /opt/software/prometheus/prometheus
这是我最终配置完成后的目录结构(如果后面安装看懵了请参考此目录结构):
bash
[root@prometheus prometheus]# tree /opt/software/prometheus/prometheus

├── data
├── EOF
├── LICENSE
├── NOTICE
├── prometheus
├── prometheus.yml
├── prometheus.yml_bak
├── promtool
├── rules
│   ├── alert.yml
│   ├── blackbox_exporter.yml
│   ├── docker.yml
│   ├── mysqld.yml
│   ├── nginx.yml
│   ├── node-exporter.yml
│   ├── redis.yml
│   └── springboot.yml
└── targets
    ├── blackbox_http.yml
    ├── blackbox_icmp.yml
    ├── blackbox_tcp.yml
    ├── pushgateway.yml
    ├── springboot.yml
    └── targets.yml
3.1.2 修改prometheus.yml
注:prometheus.yml里面的配置有两种配置方式,一种是静态文件配置方式,第二种是动态文件配置方式。你可以两种都尝试看看,推荐用第二种,
方式一(静态文件方式,每次配置发生变动需手动加载):
修改prometheus.yml,完整内容如下:
bash
# my global config
global:
  scrape_interval: 15s # Set the scrape interval to every 15 seconds. Default is every 1 minute.
  evaluation_interval: 15s # Evaluate rules every 15 seconds. The default is every 1 minute.
  # scrape_timeout is set to the global default (10s).

# Alertmanager configuration
alerting:
  alertmanagers:
    - static_configs:
        - targets:
           - 192.168.25.41:9093

# Load rules once and periodically evaluate them according to the global 'evaluation_interval'.
rule_files:
  - "rules/*"
  # - "first_rules.yml"
  # - "second_rules.yml"

# A scrape configuration containing exactly one endpoint to scrape:
# Here it's Prometheus itself.
scrape_configs:
  # The job name is added as a label `job=<job_name>` to any timeseries scraped from this config.
  - job_name: "prometheus"
    static_configs:
      - targets: ["localhost:9090"]
  - job_name: "alertmanager"
    scrape_interval: 15s
    static_configs:
      - targets: ["192.168.25.41:9093"]
  - job_name: "node_exporter"
    scrape_interval: 15s
    static_configs:
      - targets: ["192.168.25.41:9100"]
        labels:
          instance: Prometheus服务器
          myCusLabel: myCusVal
      - targets: ["192.168.25.42:9100"]
        labels:
          instance: 被监控服务器42
          myCusLabel: myCusVal
  - job_name: "cadvisor"
    scrape_interval: 15s
    static_configs:
      - targets: ["192.168.25.42:8080"]
        labels:
          instance: 被监控服务器42
          myCusLabel: myCusVal
  - job_name: "nginx-exporter"
    scrape_interval: 15s
    static_configs:
      - targets: ["192.168.25.42:9113"]
        labels:
          instance: 被监控服务器42
          myCusLabel: myCusVal
  - job_name: "redis-exporter"
    scrape_interval: 15s
    static_configs:
      - targets: ["192.168.25.42:9121"]
        labels:
          instance: 被监控服务器42
          myCusLabel: myCusVal
  - job_name: "mysql-exporter"
    scrape_interval: 15s
    static_configs:
      - targets: ["192.168.25.42:9104"]
        labels:
          instance: 被监控服务器42
          myCusLabel: myCusVal
  - job_name: "springboot-demo"
    scrape_interval: 15s
    metrics_path: '/actuator/prometheus'
    static_configs:
      - targets: ["192.168.25.42:8081"]
        labels:
          instance: 被监控服务器42
          myCusLabel: myCusVal
          mytype: springboot
  - job_name: "pushgateway"
    scrape_interval: 15s
    honor_labels: true  #加上此配置,exporter节点上传数据中的一些标签将不会被pushgateway节点的相同标签覆盖
    static_configs:
      - targets: ["192.168.25.42:9091"]
        labels:
          instance: 被监控服务器42
          myCusLabel: myCusVal
  - job_name: "blackbox_http"
    metrics_path: /probe
    params:
      module: [http_2xx]
    static_configs:
      - targets:
        - https://www.baidu.com
        - https://www.jd.com
        labels:
          company: "外部公司"
          project: "外部项目"
          env: "dev"
      - targets:
        - http://192.168.25.42:8081/
        labels:
          describe: springboot-web-demo应用
          company: "内部公司"
          project: "内部项目"
          env: "test"
    relabel_configs:
      - source_labels: [__address__]
        target_label: __param_target
      - source_labels: [__param_target]
        target_label: instance
      - target_label: __address__
        replacement: 192.168.25.42:9115
  - job_name: "blackbox_tcp"
    metrics_path: /probe
    params:
      module: [tcp_connect]
    static_configs:
      - targets:
        - 192.168.25.42:22
        - 192.168.25.41:9090
        labels:
          company: "内部公司"
          project: "测试项目"
          env: "test"
    relabel_configs:
      - source_labels: [__address__]
        target_label: __param_target
      - source_labels: [__param_target]
        target_label: instance
      - target_label: __address__
        replacement: 192.168.25.42:9115
  #icmp检查配置 ping
  - job_name: "blackbox_icmp"
    metrics_path: /probe
    params:
      module: [icmp]
    static_configs:
      - targets:
        - 192.168.25.42
        - 192.168.25.200  # 不存在的ip
        labels:
          company: "内部公司"
          project: "测试项目"
    relabel_configs:
      - source_labels: [__address__]
        target_label: __param_target
      - source_labels: [__param_target]
        target_label: instance
      - target_label: __address__
        replacement: 192.168.25.42:9115
方式二(动态文件方式,每次配置发生变动会自动加载):
修改prometheus.yml,完整内容如下:
bash
# my global config
global:
  scrape_interval: 15s # Set the scrape interval to every 15 seconds. Default is every 1 minute.
  evaluation_interval: 15s # Evaluate rules every 15 seconds. The default is every 1 minute.
  # scrape_timeout is set to the global default (10s).

# Alertmanager configuration
alerting:
  alertmanagers:
    - static_configs:
        - targets:
           - 192.168.25.41:9093

# Load rules once and periodically evaluate them according to the global 'evaluation_interval'.
rule_files:
  - "rules/*"
  # - "first_rules.yml"
  # - "second_rules.yml"

# A scrape configuration containing exactly one endpoint to scrape:
# Here it's Prometheus itself.
scrape_configs:
  # The job name is added as a label `job=<job_name>` to any timeseries scraped from this config.
  - job_name: "file-target"
    file_sd_configs:
      - refresh_interval: 10s
        files:
          - targets/targets.yml
  - job_name: "file-sd-pushgateway"
    scrape_interval: 15s
    honor_labels: true  # 为true时,exporter节点上传数据中的一些标签将不会被pushgateway节点的相同标签覆盖
    file_sd_configs:
      - refresh_interval: 10s
        files:
          - targets/pushgateway.yml
  - job_name: "file-application"
    scrape_interval: 15s
    metrics_path: '/actuator/prometheus'
    file_sd_configs:
      - refresh_interval: 10s
        files:
          - targets/springboot.yml

  - job_name: "file-blackbox_http"
    metrics_path: /probe
    params:
      module: [http_2xx]
    file_sd_configs:
      - refresh_interval: 10s
        files:
          - targets/blackbox_http.yml
    relabel_configs:
      - source_labels: [__address__]
        target_label: __param_target
      - source_labels: [__param_target]
        target_label: instance
      - source_labels: [__param_target]
        target_label: __param_myparam
        replacement: myparamVal
      - target_label: __address__
        replacement: 192.168.25.42:9115
      #- regex: "__(.*)__"    默认__xx__的标签都会隐藏,这两行让__xx__标签替换成xx标签,故而用户可以看到这些xx标签
      #  action: labelmap
  - job_name: "file-blackbox_tcp"
    metrics_path: /probe
    params:
      module: [tcp_connect]
    file_sd_configs:
      - refresh_interval: 10s
        files:
          - targets/blackbox_tcp.yml
    relabel_configs:
      - source_labels: [__address__]
        target_label: __param_target
      - source_labels: [__param_target]
        target_label: instance
      - target_label: __address__
        replacement: 192.168.25.42:9115
  #icmp检查配置 ping
  - job_name: "file-blackbox_icmp"
    metrics_path: /probe
    params:
      module: [icmp]
    file_sd_configs:
      - refresh_interval: 10s
        files:
          - targets/blackbox_icmp.yml
    relabel_configs:
      - source_labels: [__address__]
        target_label: __param_target
      - source_labels: [__param_target]
        target_label: instance
      - target_label: __address__
        replacement: 192.168.25.42:9115
创建targets目录,用于存放动态配置文件。
bash
mkdir -p /opt/software/prometheus/prometheus/targets/添加/opt/software/prometheus/prometheus/targets/targets.yml文件,完整内容如下:
bash
- targets: ["192.168.25.41:9090"]
  labels:
    job: prometheus
- targets: ["192.168.25.41:9093"]
  labels:
    job: alertmanager
- targets: ["192.168.25.41:9100"]
  labels:
    job: node_exporter
    instance: Prometheus服务器
    myCusLabel: myCusVal
- targets: ["192.168.25.42:9100"]
  labels:
    job: node_exporter
    instance: 被监控服务器42
    myCusLabel: myCusVal
- targets: ["192.168.25.42:8080"]
  labels:
    job: cadvisor
    instance: 被监控服务器42
    myCusLabel: myCusVal
- targets: ["192.168.25.42:9113"]
  labels:
    job: nginx-exporter
    instance: 被监控服务器42
    myCusLabel: myCusVal
- targets: ["192.168.25.42:9121"]
  labels:
    job: redis-exporter
    instance: 被监控服务器42
    myCusLabel: myCusVal
- targets: ["192.168.25.42:9104"]
  labels:
    job: mysql-exporter
    instance: 被监控服务器42
    myCusLabel: myCusVal
添加/opt/software/prometheus/prometheus/targets/springboot.yml文件,内容如下:
bash
- targets: ["192.168.25.42:8081"]
  labels:
    job: java-application
    instance: 被监控服务器42
    myCusLabel: myCusVal
    mytype: springboot
添加/opt/software/prometheus/prometheus/targets/pushgateway.yml文件,完整内容如下:
bash
- targets: ["192.168.25.42:9091"]
  labels:
    job: pushgateway
    instance: 被监控服务器42
    myCusLabel: myCusVal
添加/opt/software/prometheus/prometheus/targets/blackbox_http.yml文件,完整内容如下:
bash
- targets:
    - https://www.baidu.com
    - https://www.jd.com
  labels:
    job: blackbox_http
    company: "外部公司"
    project: "外部项目"
    env: "dev"
- targets:
    - http://192.168.25.42:8081/
  labels:
    job: blackbox_http
    describe: springboot-web-demo应用
    company: "内部公司"
    project: "内部项目"
    env: "dev"
添加/opt/software/prometheus/prometheus/targets/blackbox_tcp.yml文件,完整内容如下:
bash
- targets:
    - 192.168.25.42	  # 被监控的endpoint
    - 192.168.25.200  # 被监控的endpoint
  labels:
    job: blackbox_icmp
    company: "内部公司"
    project: "测试项目"
添加/opt/software/prometheus/prometheus/targets/blackbox_icmp.yml文件,完整内容如下:
bash
- targets:
    - 192.168.25.42	  # 被监控的IP
    - 192.168.25.200  # 被监控的IP
  labels:
    job: blackbox_icmp
    company: "内部公司"
    project: "测试项目"
    env: "dev"
3.1.3 添加监控规则文件
创建规则目录
bash
mkdir /opt/software/prometheus/prometheus/rules/添加/opt/software/prometheus/prometheus/rules/alert.yml件,完整内容如下:
bash
groups:
- name: Prometheus alert
  rules:
  - alert: 服务告警
    expr: up==0
    for: 30s
    labels:
      serverity: critical
    annotations:
      summary: "服务异常,实例{{$labels.instance}}"
      description: "{{$labels.job}}服务已关闭"
添加/opt/software/prometheus/prometheus/rules/node-exporter.yml文件,完整内容如下:
bash
groups:
- name: node-exporter
rules:
- alert: HostOutOfMemory
expr: node_memory_MemAvailable_bytes / node_memory_MemTotal_bytes * 100 < 10
for: 2m
labels:
severity: warning
annotations:
summary: "主机内存不足,实例:{{ $labels.instance }}"
description: "内存可用率<10%,当前值:{{ $value }}"
- alert: HostMemoryUnderMemoryPressure
expr: rate(node_vmstat_pgmajfault[1m]) > 1000
for: 2m
labels:
severity: warning
annotations:
summary: "内存压力不足,实例:{{ $labels.instance }}"
description: "节点内存压力大。 重大页面错误率高,当前值为:{{ $value }}"
- alert: HostUnusualNetworkThroughputIn
expr: sum by (instance) (rate(node_network_receive_bytes_total[2m])) / 1024 / 1024 > 100
for: 5m
labels:
severity: warning
annotations:
summary: "异常流入网络吞吐量,实例:{{ $labels.instance }}"
description: "网络流入流量 > 100 MB/s,当前值:{{ $value }}"
- alert: HostUnusualNetworkThroughputOut
expr: sum by (instance) (rate(node_network_transmit_bytes_total[2m])) / 1024 / 1024 > 100
for: 5m
labels:
severity: warning
annotations:
summary: "异常流出网络吞吐量,实例:{{ $labels.instance }}"
description: "网络流出流量 > 100 MB/s,当前值为:{{ $value }}"
- alert: HostUnusualDiskReadRate
expr: sum by (instance) (rate(node_disk_read_bytes_total[2m])) / 1024 / 1024 > 50
for: 5m
labels:
severity: warning
annotations:
summary: "异常磁盘读取,实例:{{ $labels.instance }}"
description: "磁盘读取> 50 MB/s,当前值:{{ $value }}"
- alert: HostUnusualDiskWriteRate
expr: sum by (instance) (rate(node_disk_written_bytes_total[2m])) / 1024 / 1024 > 50
for: 2m
labels:
severity: warning
annotations:
summary: "异常磁盘写入,实例:{{ $labels.instance }}"
description: "磁盘写入> 50 MB/s,当前值:{{ $value }}"
- alert: HostOutOfDiskSpace
expr: (node_filesystem_avail_bytes * 100) / node_filesystem_size_bytes < 10 and ON (instance, device, mountpoint) node_filesystem_readonly == 0
for: 2m
labels:
severity: warning
annotations:
summary: "磁盘空间不足告警,实例:{{ $labels.instance }}"
description: "剩余磁盘空间< 10% ,当前值:{{ $value }}"
- alert: HostDiskWillFillIn24Hours
expr: (node_filesystem_avail_bytes * 100) / node_filesystem_size_bytes < 10 and ON (instance, device, mountpoint) predict_linear(node_filesystem_avail_bytes{fstype!~"tmpfs"}[1h], 24 * 3600) < 0 and ON (instance, device, mountpoint) node_filesystem_readonly == 0
for: 2m
labels:
severity: warning
annotations:
summary: "磁盘空间将在24小时内耗尽,实例:{{ $labels.instance }}"
description: "以当前写入速率预计磁盘空间将在 24 小时内耗尽,当前值:{{ $value }}"
- alert: HostOutOfInodes
expr: node_filesystem_files_free{mountpoint ="/"} / node_filesystem_files{mountpoint="/"} * 100 < 10 and ON (instance, device, mountpoint) node_filesystem_readonly{mountpoint="/"} == 0
for: 2m
labels:
severity: warning
annotations:
summary: "磁盘Inodes不足,实例:{{ $labels.instance }}"
description: "剩余磁盘 inodes < 10%,当前值: {{ $value }}"
- alert: HostUnusualDiskReadLatency
expr: rate(node_disk_read_time_seconds_total[1m]) / rate(node_disk_reads_completed_total[1m]) > 0.1 and rate(node_disk_reads_completed_total[1m]) > 0
for: 2m
labels:
severity: warning
annotations:
summary: "异常磁盘读取延迟,实例:{{ $labels.instance }}"
description: "磁盘读取延迟 > 100ms,当前值:{{ $value }}"
- alert: HostUnusualDiskWriteLatency
expr: rate(node_disk_write_time_seconds_total[1m]) / rate(node_disk_writes_completed_total[1m]) > 0.1 and rate(node_disk_writes_completed_total[1m]) > 0
for: 2m
labels:
severity: warning
annotations:
summary: "异常磁盘写入延迟,实例:{{ $labels.instance }}"
description: "磁盘写入延迟 > 100ms,当前值:{{ $value }}"
- alert: high_load
expr: node_load1 > 4
for: 2m
labels:
severity: page
annotations:
summary: "CPU1分钟负载过高,实例:{{ $labels.instance }}"
description: "CPU1分钟负载>4,已经持续2分钟。当前值为:{{ $value }}"
- alert: HostCpuIsUnderUtilized
expr: 100 - (avg by(instance) (rate(node_cpu_seconds_total{mode="idle"}[2m])) * 100) > 80
for: 1m
labels:
severity: warning
annotations:
summary: "cpu负载高,实例:{{ $labels.instance }}"
description: "cpu负载> 80%,当前值:{{ $value }}"
- alert: HostCpuStealNoisyNeighbor
expr: avg by(instance) (rate(node_cpu_seconds_total{mode="steal"}[5m])) * 100 > 10
for: 0m
labels:
severity: warning
annotations:
summary: "CPU窃取率异常,实例:{{ $labels.instance }}"
description: "CPU 窃取率 > 10%。 嘈杂的邻居正在扼杀 VM 性能,或者 Spot 实例可能失去信用,当前值:{{ $value }}"
- alert: HostSwapIsFillingUp
expr: (1 - (node_memory_SwapFree_bytes / node_memory_SwapTotal_bytes)) * 100 > 80
for: 2m
labels:
severity: warning
annotations:
summary: "磁盘swap空间使用率异常,实例:{{ $labels.instance }}"
description: "磁盘swap空间使用率>80%"
- alert: HostNetworkReceiveErrors
expr: rate(node_network_receive_errs_total[2m]) / rate(node_network_receive_packets_total[2m]) > 0.01
for: 2m
labels:
severity: warning
annotations:
summary: "异常网络接收错误,实例:{{ $labels.instance }}"
description: "网卡{{ $labels.device }}在过去2分钟接收错误率大于0.01,当前值:{{ $value }}"
- alert: HostNetworkTransmitErrors
expr: rate(node_network_transmit_errs_total[2m]) / rate(node_network_transmit_packets_total[2m]) > 0.01
for: 2m
labels:
severity: warning
annotations:
summary: "异常网络传输错误,实例:{{ $labels.instance }}"
description: "网卡{{ $labels.device }}在过去2分钟传输错误率大于0.01,当前值:{{ $value }}"
- alert: HostNetworkInterfaceSaturated
expr: (rate(node_network_receive_bytes_total{device!~"^tap.*"}[1m]) + rate(node_network_transmit_bytes_total{device!~"^tap.*"}[1m])) / node_network_speed_bytes{device!~"^tap.*"} > 0.8 < 10000
for: 1m
labels:
severity: warning
annotations:
summary: "异常网络接口饱和,实例:{{ $labels.instance }}"
description: "网卡{{ $labels.device }}正在超载,当前值{{ $value }}"
- alert: HostConntrackLimit
expr: node_nf_conntrack_entries / node_nf_conntrack_entries_limit > 0.8
for: 5m
labels:
severity: warning
annotations:
summary: "异常连接数,实例:{{ $labels.instance }}"
description: "连接数过大,当前连接数:{{ $value }}"
- alert: HostClockSkew
expr: (node_timex_offset_seconds > 0.05 and deriv(node_timex_offset_seconds[5m]) >= 0) or (node_timex_offset_seconds < -0.05 and deriv(node_timex_offset_seconds[5m]) <= 0)
for: 2m
labels:
severity: warning
annotations:
summary: "异常时钟偏差,实例:{{ $labels.instance }}"
description: "检测到时钟偏差,时钟不同步。值为:{{ $value }}"
- alert: HostClockNotSynchronising
expr: min_over_time(node_timex_sync_status[1m]) == 0 and node_timex_maxerror_seconds >= 16
for: 2m
labels:
severity: warning
annotations:
summary: "时钟不同步,实例:{{ $labels.instance }}"
description: "时钟不同步"
- alert: NodeFileDescriptorLimit
expr: node_filefd_allocated / node_filefd_maximum * 100 > 80
for: 1m
labels:
severity: warning
annotations:
summary: "预计内核将很快耗尽文件描述符限制"
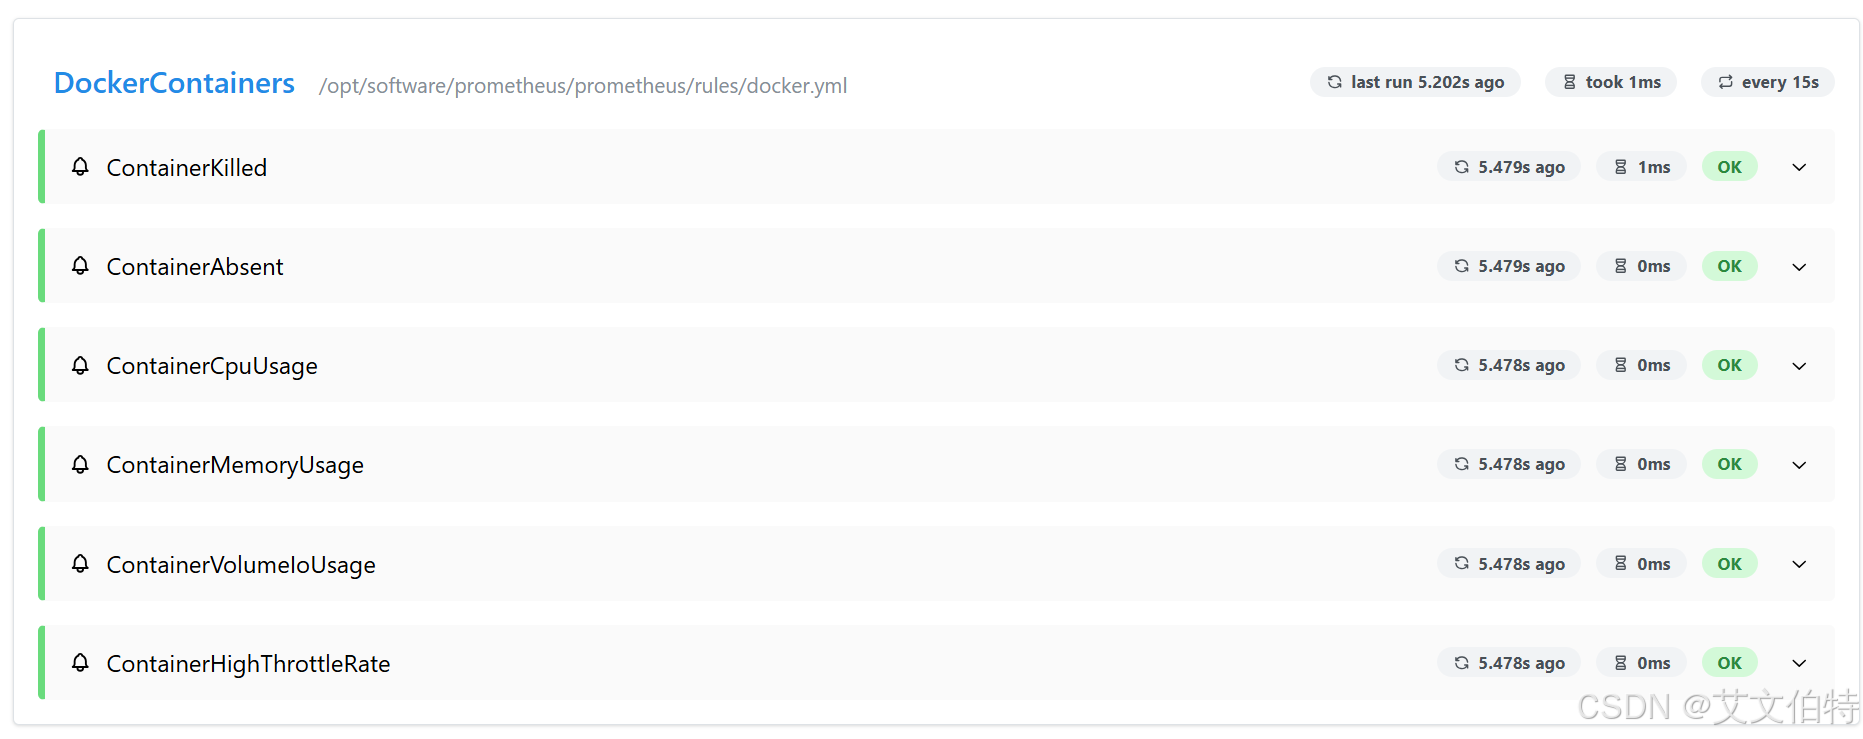
description: "{{ $labels.instance }}}已分配的文件描述符数超过了限制的80%,当前值为:{{ $value }}"添加/opt/software/prometheus/prometheus/rules/docker.yml文件,完整内容如下:
bash
groups:
- name: DockerContainers
  rules:
  - alert: ContainerKilled
    expr: time() - container_last_seen > 60
    for: 0m
    labels:
      severity: warning
    annotations:
      isummary: "Docker容器被杀死 容器:{{ $labels.instance }}"
      description: "{{ $value }}个容器消失了"
  # This rule can be very noisy in dynamic infra with legitimate container start/stop/deployment.
  - alert: ContainerAbsent
    expr: absent(container_last_seen)
    for: 5m
    labels:
      severity: warning
    annotations:
      summary: "无容器 容器: {{ $labels.instance }}"
      description: "5分钟检查容器不存在,值为:{{ $value }}"
  - alert: ContainerCpuUsage
    expr: (sum(rate(container_cpu_usage_seconds_total{name!=""}[3m])) BY (instance, name) * 100) > 300
    for: 2m
    labels:
      severity: warning
    annotations:
      summary: "容器cpu使用率告警 容器: {{ $labels.instance }}"
      description: "容器cpu使用率超过300%,当前值为:{{ $value }}"
  - alert: ContainerMemoryUsage
    expr: (sum(container_memory_working_set_bytes{name!=""}) BY (instance, name) / sum(container_spec_memory_limit_bytes > 0) BY (instance, name) * 100) > 80
    for: 2m
    labels:
      severity: warning
    annotations:
      summary: "容器内存使用率告警 容器: {{ $labels.instance }}"
      description: "容器内存使用率超过80%,当前值为:{{ $value }}"
  - alert: ContainerVolumeIoUsage
    expr: (sum(container_fs_io_current{name!=""}) BY (instance, name) * 100) > 80
    for: 2m
    labels:
      severity: warning
    annotations:
      summary: "容器存储io使用率告警 容器: {{ $labels.instance }}"
      description: "容器存储io使用率超过 80%,当前值为:{{ $value }}"
  - alert: ContainerHighThrottleRate
    expr: rate(container_cpu_cfs_throttled_seconds_total[3m]) > 1
    for: 2m
    labels:
      severity: warning
    annotations:
      summary: "容器限制告警 容器:{{ $labels.instance }}"
      description: "容器被限制,当前值为:{{ $value }}"
添加/opt/software/prometheus/prometheus/rules/mysqld.yml文件,完整内容如下:
bash
groups:
- name: MySQL
  rules:
  - alert: MysqlDown
    expr: mysql_up == 0
    for: 30s
    labels:
      severity: critical
    annotations:
      summary: "MySQL Down,实例:{{ $labels.instance }}"
      description: "MySQL_exporter连不上MySQL了,当前状态为:{{ $value }}"
  - alert: MysqlTooManyConnections
    expr: max_over_time(mysql_global_status_threads_connected[1m]) / mysql_global_variables_max_connections * 100 > 80
    for: 2m
    labels:
      severity: warning
    annotations:
      summary: "Mysql连接数过多告警,实例:{{ $labels.instance }}"
      description: "MySQL连接数>80%,当前值:{{ $value }}"
  - alert: MysqlHighThreadsRunning
    expr: max_over_time(mysql_global_status_threads_running[1m]) > 20
    for: 2m
    labels:
      severity: warning
    annotations:
      summary: "Mysql运行的线程过多,实例:{{ $labels.instance }}"
      description: "Mysql运行的线程 > 20,当前运行的线程:{{ $value }}"
  - alert: MysqlSlowQueries
    expr: increase(mysql_global_status_slow_queries[2m]) > 0
    for: 2m
    labels:
      severity: warning
    annotations:
      summary: "Mysql慢日志告警,实例:{{ $labels.instance }}"
      description: "MySQL在过去2分钟有新的{{ $value }}条慢查询"
  #MySQL innodb 日志写入停滞
  - alert: MysqlInnodbLogWaits
    expr: rate(mysql_global_status_innodb_log_waits[15m]) > 10
    for: 0m
    labels:
      severity: warning
    annotations:
      summary: "MySQL innodb日志等待,实例:{{ $labels.instance }}"
      description: "MySQL innodb日志写入停滞,当前值: {{ $value }}"
  - alert: MysqlRestarted
    expr: mysql_global_status_uptime < 60
    for: 0m
    labels:
      severity: info
    annotations:
      summary: "MySQL 重启,实例:{{ $labels.instance }}"
      description: "不到一分钟前,MySQL重启过"

  - alert: RowLockCurrentWaits
    expr: mysql_global_status_innodb_row_lock_current_waits > 0
    for: 1m
    labels:
      severity: info
    annotations:
      summary: "MySQL有锁等待,实例:{{ $labels.instance }}"
      description: "当前有{{ $value }}个锁等待"
添加/opt/software/prometheus/prometheus/rules/nginx.yml文件,完整内容如下:
bash
groups:
- name: nginx
  rules:
  # 对任何实例超过30秒无法联系的情况发出警报
  - alert: NginxDown
    expr: nginx_up == 0
    for: 30s
    labels:
      severity: critical
    annotations:
      summary: "nginx异常,实例:{{ $labels.instance }}"
      description: "{{ $labels.job }} nginx已关闭"
添加/opt/software/prometheus/prometheus/rules/redis.yml文件,完整内容如下:
bash
groups:
- name: redis
  rules:
  - alert: RedisDown
    expr: redis_up == 0
    for: 0m
    labels:
      severity: critical
    annotations:
      summary: 'Redis Down,实例:{{ $labels.instance }}'
      description: "Redis实例 is down"
  - alert: RedisMissingBackup
    expr: time() - redis_rdb_last_save_timestamp_seconds > 60 * 60 * 24
    for: 0m
    labels:
      severity: critical
    annotations:
      summary: "Redis备份丢失,实例:{{ $labels.instance }}"
      description: "Redis 24小时未备份"

  - alert: RedisOutOfConfiguredMaxmemory
    expr: redis_memory_used_bytes / redis_memory_max_bytes * 100 > 90
    for: 2m
    labels:
      severity: warning
    annotations:
      summary: "Redis超出配置的最大内存,实例:{{ $labels.instance }}"
      description: "Redis内存使用超过配置最大内存的90%"
  - alert: RedisTooManyConnections
    expr: redis_connected_clients > 100
    for: 2m
    labels:
      severity: warning
    annotations:
      summary: "Redis连接数过多,实例:{{ $labels.instance }}"
      description: "Redis当前连接数为: {{ $value }}"
  - alert: RedisNotEnoughConnections
    expr: redis_connected_clients < 1
    for: 2m
    labels:
      severity: warning
    annotations:
      summary: "Redis没有足够的连接,实例:{{ $labels.instance }}"
      description: "Redis当前连接数为: {{ $value }}"
  - alert: RedisRejectedConnections
    expr: increase(redis_rejected_connections_total[1m]) > 0
    for: 0m
    labels:
      severity: critical
    annotations:
      summary: "Redis有拒绝连接,实例:{{ $labels.instance }}"
      description: "与Redis 的某些连接被拒绝{{ $value }}"
添加/opt/software/prometheus/prometheus/rules/springboot.yml文件,完整内容如下:
bash
groups:
- name: SprinBoot
rules:
- alert: SprinBooErrorEvents
expr: increase(logback_events_total{level="error"}[3m]) > 0
for: 30s
labels:
severity: warning
annotations:
summary: "Springboot错误事件 容器: $labels.instance"
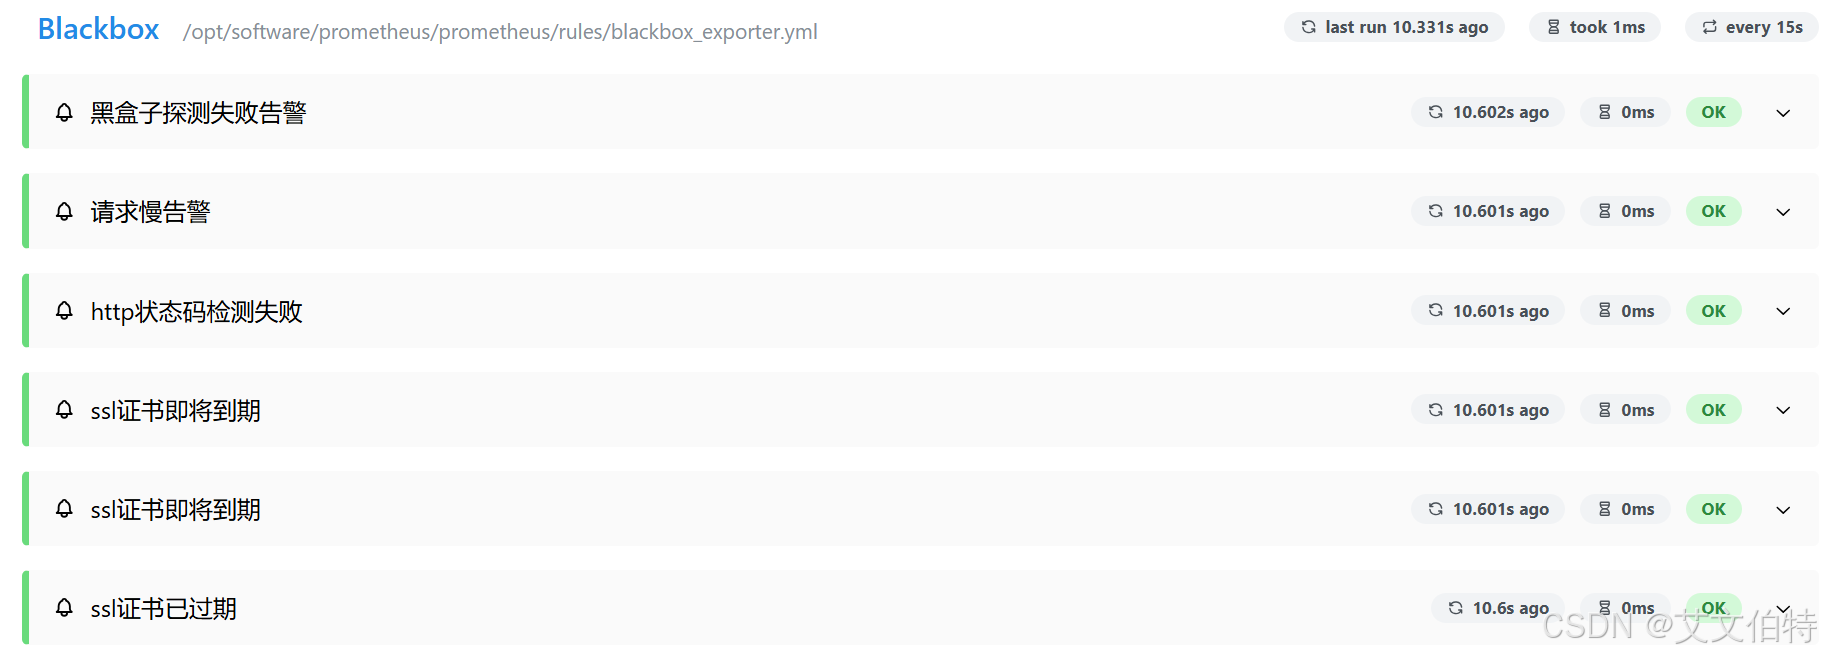
description: "在过去2分钟有新的{{ $value }}个错误事件"添加/opt/software/prometheus/prometheus/rules/blackbox_exporter.yml文件,完整内容如下:
bash
groups:
- name: Blackbox
  rules:
  - alert: 黑盒子探测失败告警
    expr: probe_success == 0
    for: 1m
    labels:
      severity: critical
    annotations:
      summary: "黑盒子探测失败{{ $labels.instance }}"
      description: "黑盒子检测失败,当前值:{{ $value }}"
  - alert: 请求慢告警
    expr: avg_over_time(probe_duration_seconds[1m]) > 1
    for: 1m
    labels:
      severity: warning
    annotations:
      summary: "请求慢{{ $labels.instance }}"
      description: "请求时间超过1秒,值为:{{ $value }}"
  - alert: http状态码检测失败
    expr: probe_http_status_code <= 199 OR probe_http_status_code >= 400
    for: 1m
    labels:
      severity: critical
    annotations:
      summary: "http状态码检测失败{{ $labels.instance }}"
      description: "HTTP状态码非 200-399,当前状态码为:{{ $value }}"
  - alert: ssl证书即将到期
    expr: probe_ssl_earliest_cert_expiry - time() < 86400 * 30
    for: 1m
    labels:
      severity: warning
    annotations:
      summary: "证书即将到期{{ $labels.instance }}"
      description: "SSL 证书在 30 天后到期,值:{{ $value }}"

  - alert: ssl证书即将到期
    expr: probe_ssl_earliest_cert_expiry - time() < 86400 * 3
    for: 1m
    labels:
      severity: critical
    annotations:
      summary: "证书即将到期{{ $labels.instance }}"
      description: "SSL 证书在 3 天后到期,值:{{ $value }}"

  - alert: ssl证书已过期
    expr: probe_ssl_earliest_cert_expiry - time() <= 0
    for: 1m
    labels:
      severity: critical
    annotations:
      summary: "证书已过期{{ $labels.instance }}"
      description: "SSL 证书已经过期,请确认是否在使用"
3.1.4 自定义Systemctl
bash
cat > /etc/systemd/system/prometheus.service << 'EOF'
[Unit]
Description=Prometheus Server
Documentation=https://prometheus.io/docs/introduction/overview/
After=network-online.target

[Service]
Type=simple
User=root
Group=root
Restart=on-failure
ExecStart=/opt/software/prometheus/prometheus/prometheus \
  --config.file=/opt/software/prometheus/prometheus/prometheus.yml \
  --storage.tsdb.path=/opt/software/prometheus/prometheus/data \
  --storage.tsdb.retention.time=60d \
  --web.enable-lifecycle

[Install]
WantedBy=multi-user.target

EOF
加载自定义的systemctl配置
bash
systemctl daemon-reload3.1.5 启动Prometheus
bash
# 启动Prometheus
systemctl start prometheus
# 开机自启动Prometheus
systemctl enable prometheus
3.1.6.访问Prometheus后台
浏览器访问:http://192.168.25.41:9090/
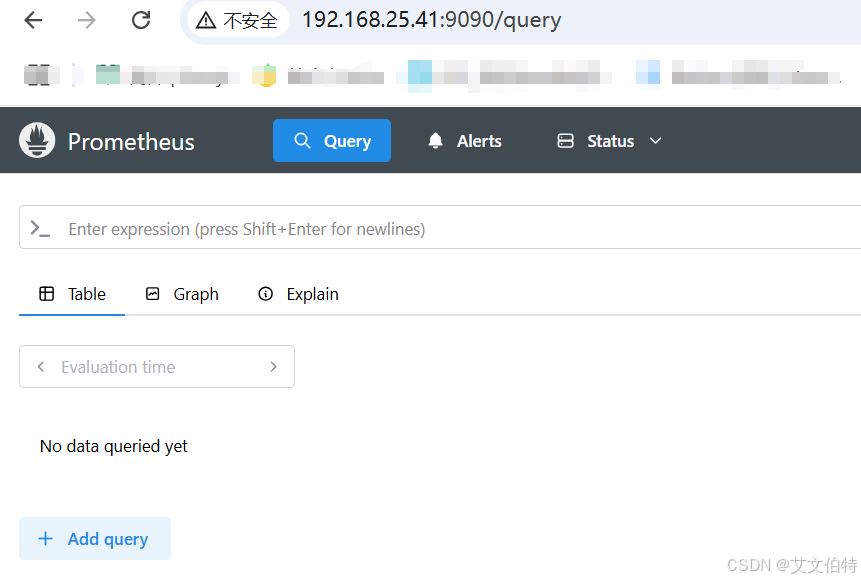
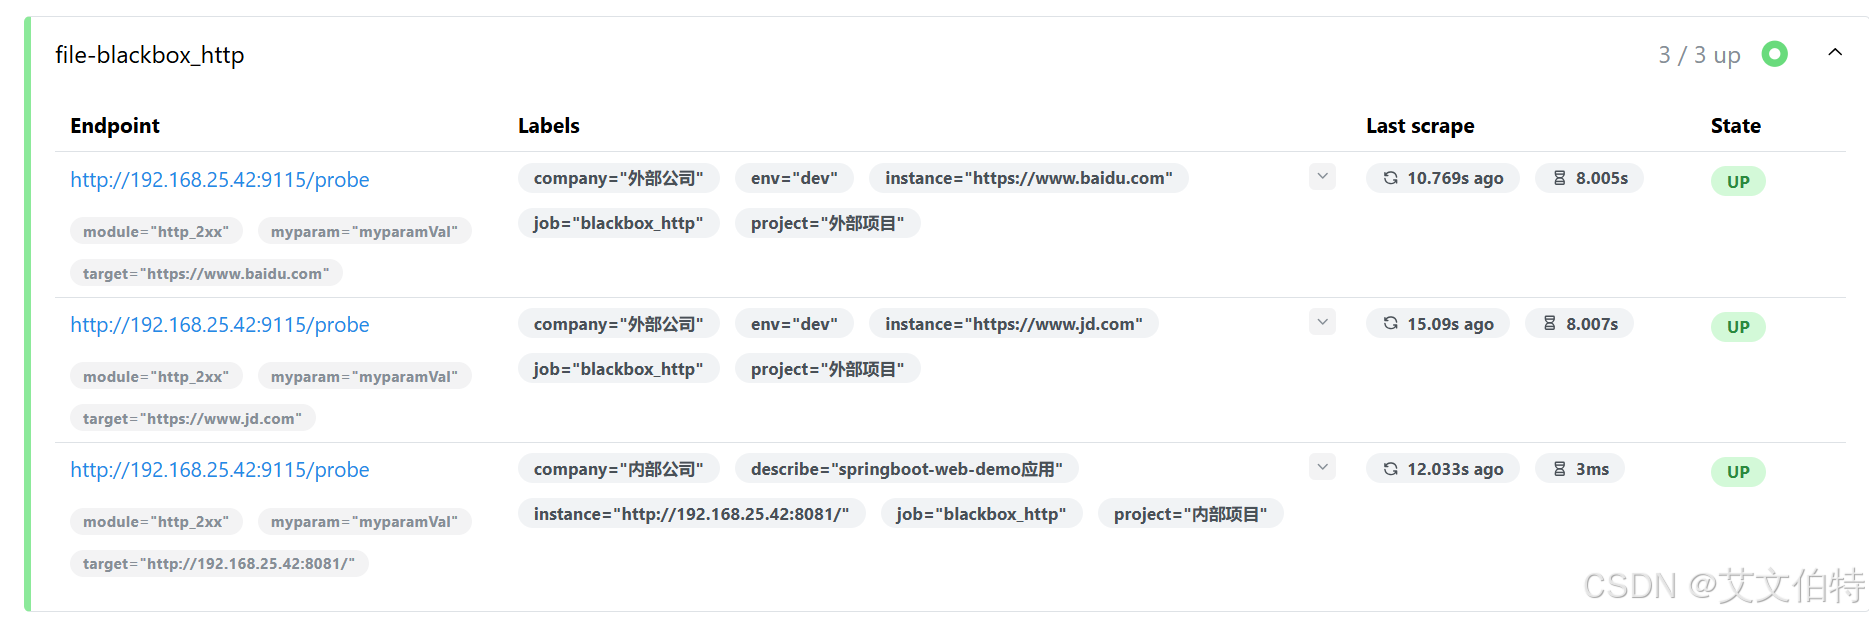
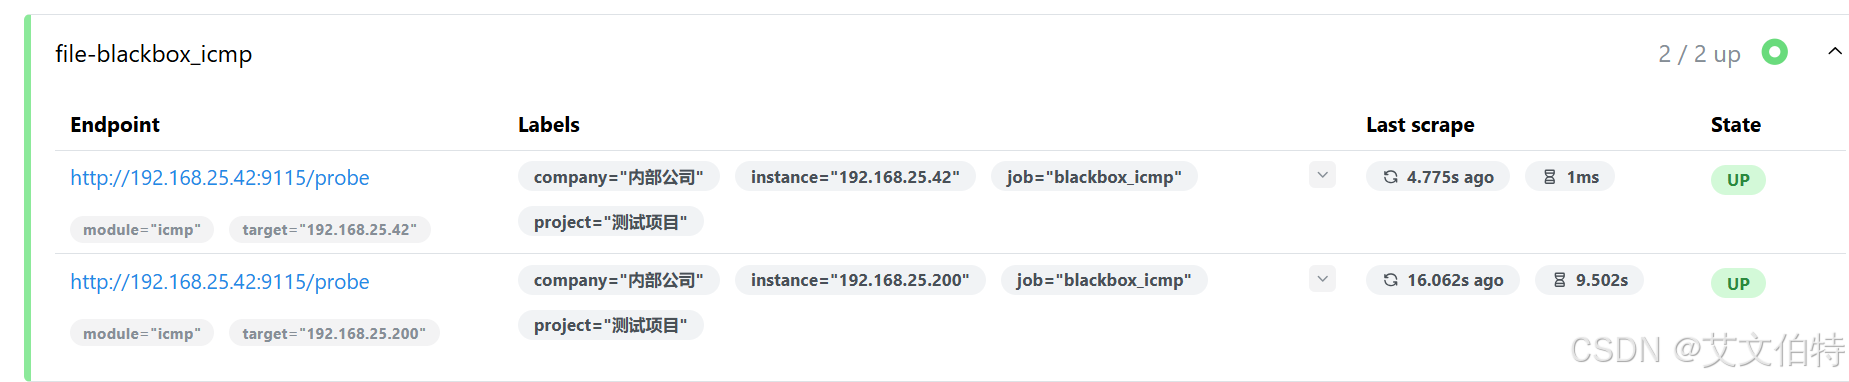
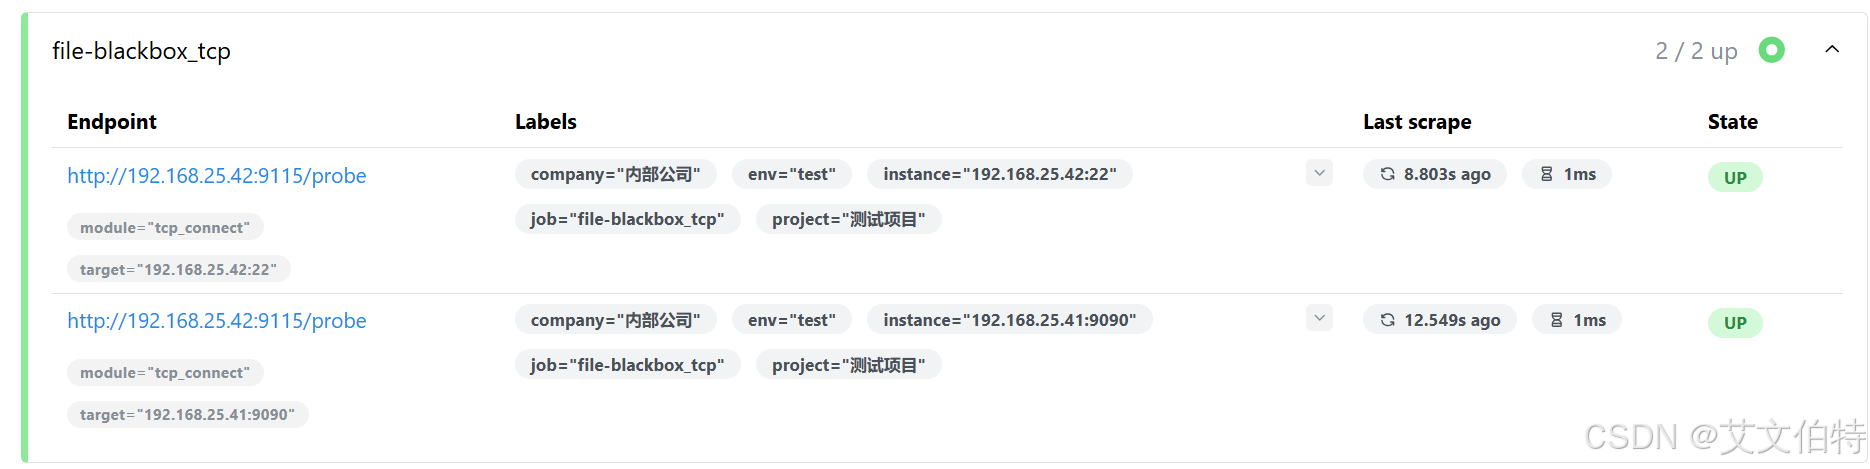
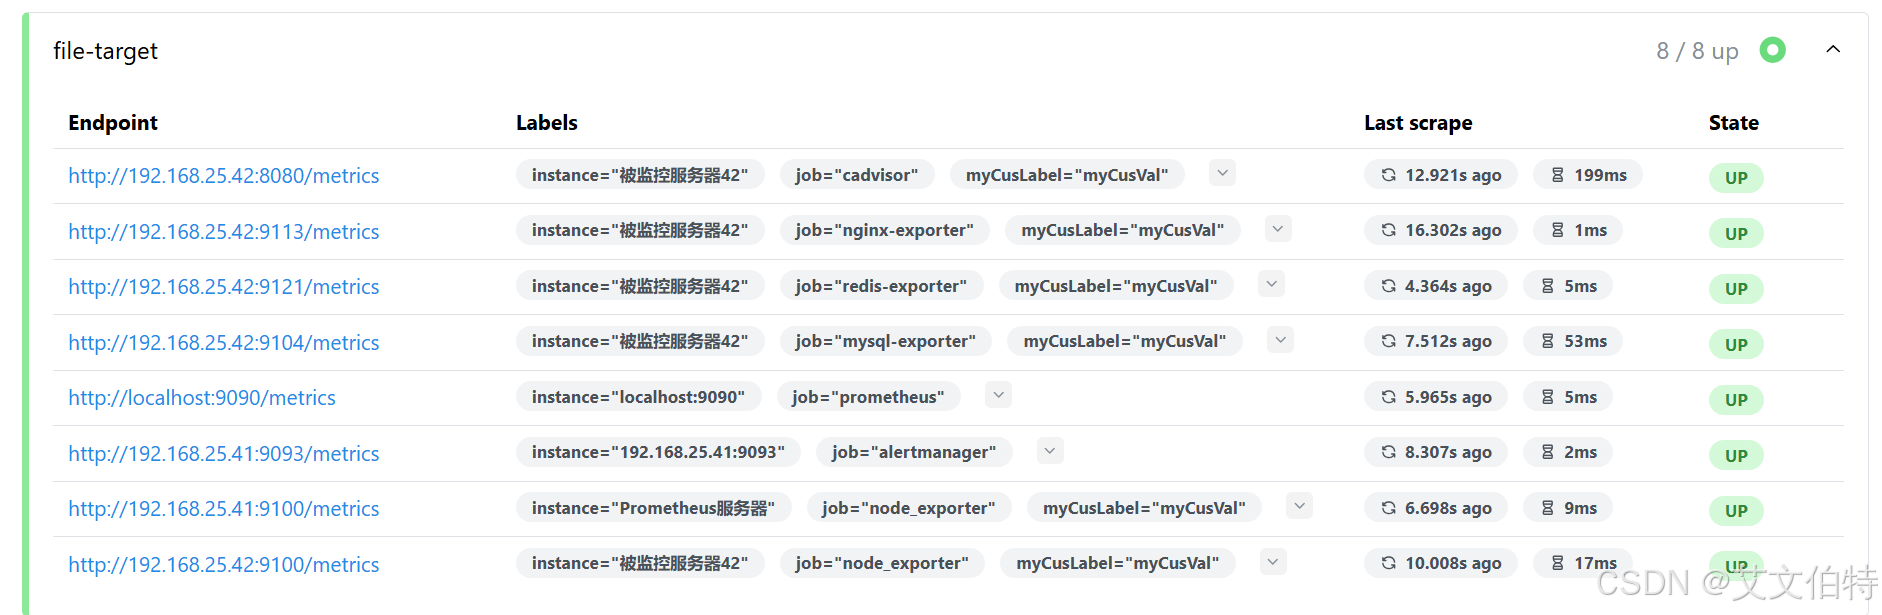
3.1.7 检查target是否已经加载
在这里插入图片描述
3.1.8 检查rules是否已经加载
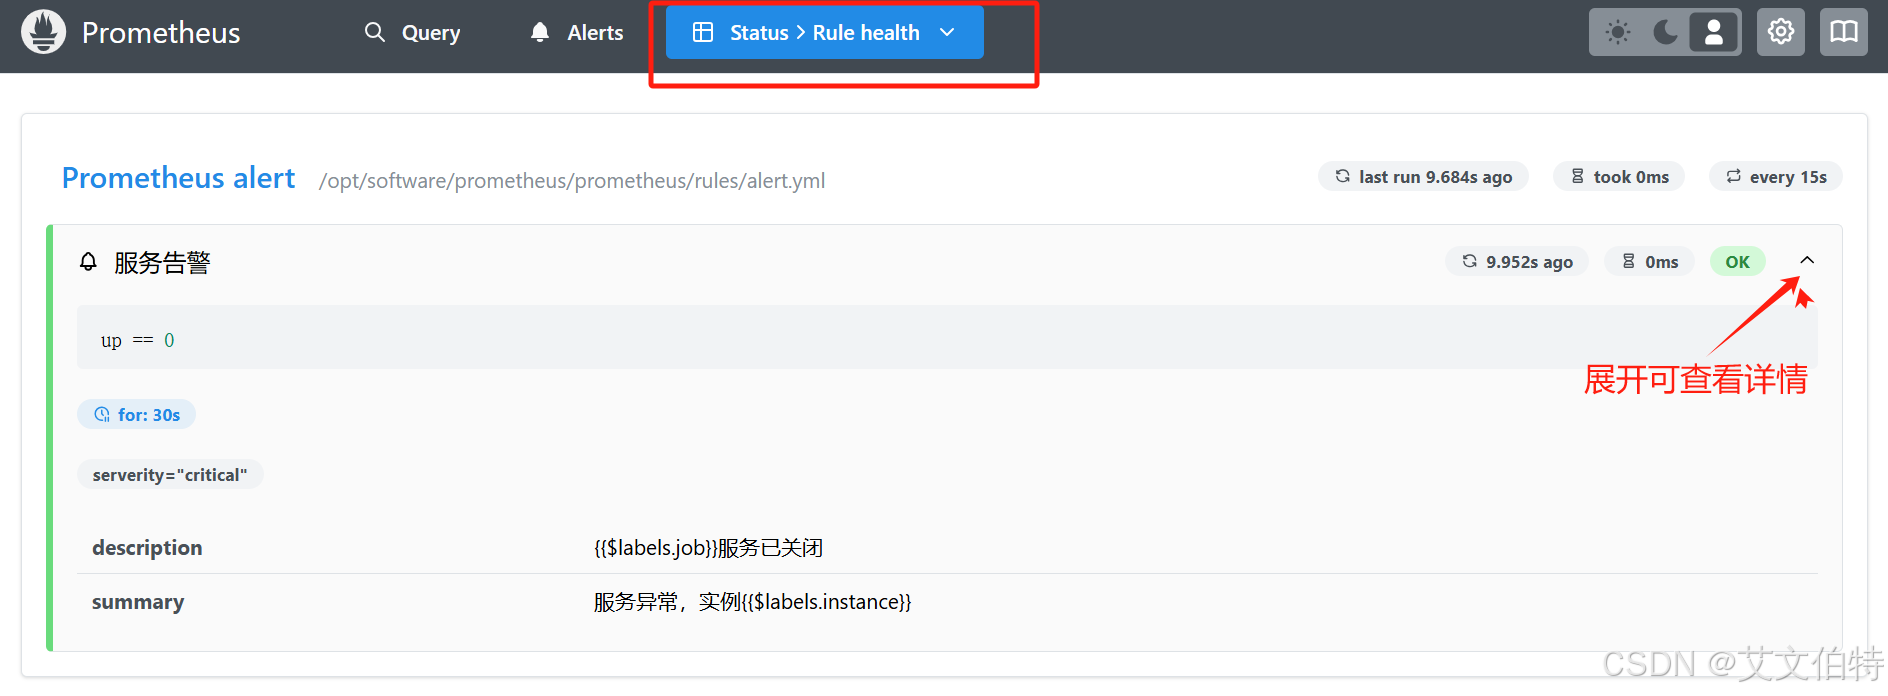
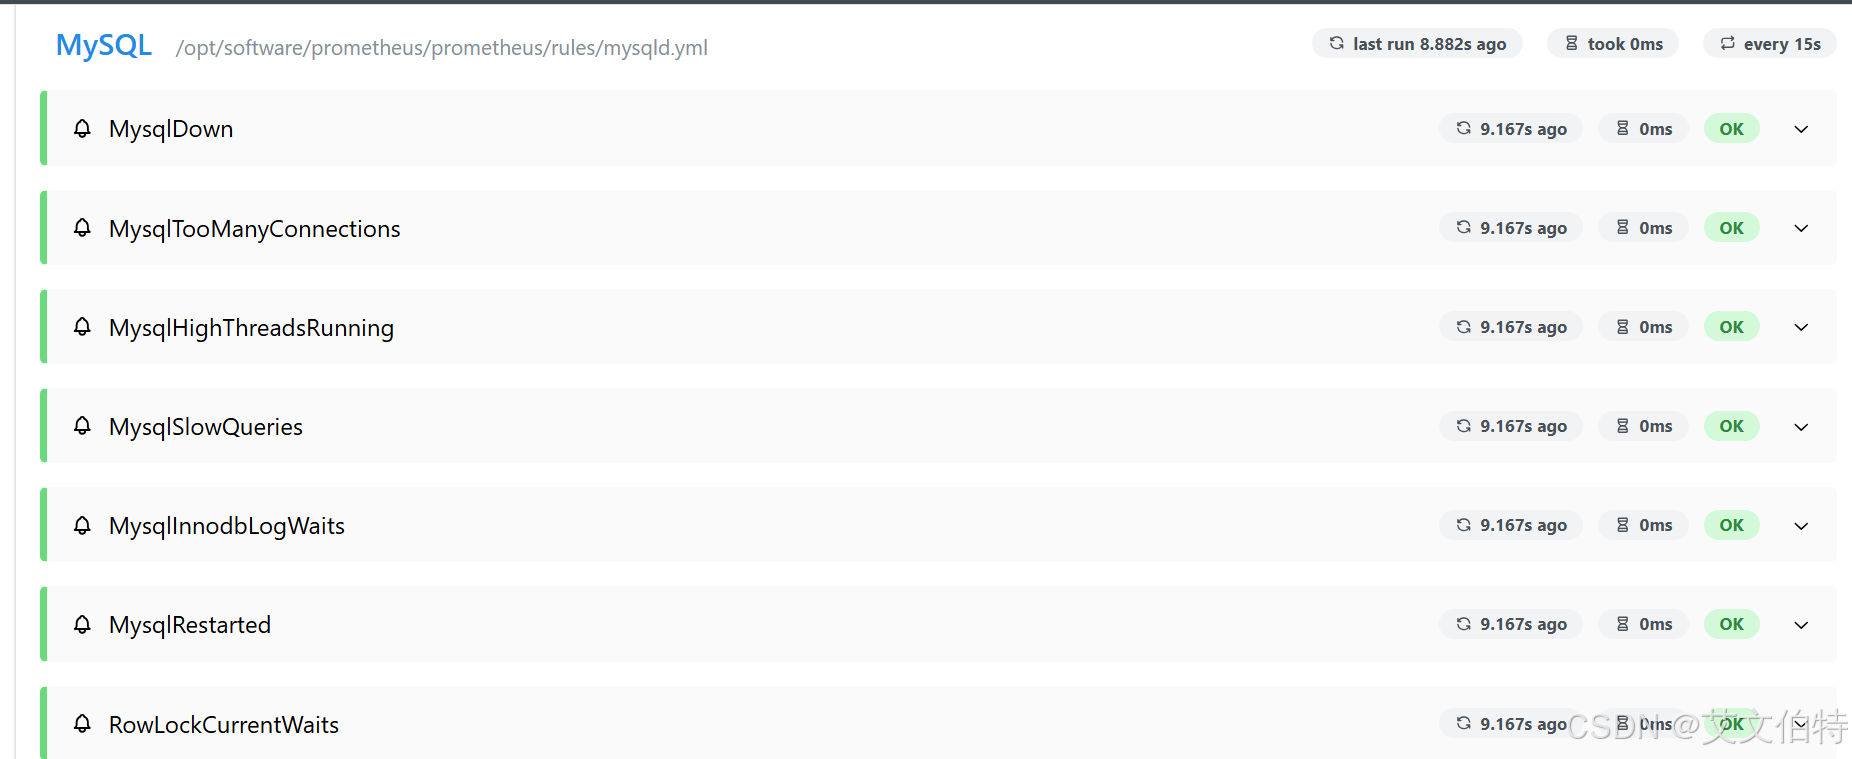
3.1.9.备注说明
注一 :curl -X POST http://192.168.25.41:9090/-/reload命令可在运行期间重新加载Prometheus配置文件
注二 :查看Prometheus运行日志:journalctl -u prometheus.service
注三 :Prometheus管理地址访问:http://192.168.25.41:9090/
注四:检查配置文件语法是否通过:./promtool check config prometheus.yml
3.2.Grafana安装
3.2.1.安装流程
Grafana下载地址:https://grafana.com/grafana/download/11.5.1?platform=linux:
bash
# 下载安装包
wget https://dl.grafana.com/enterprise/release/grafana-enterprise-11.5.1.linux-amd64.tar.gz
# 解压到特定目录
tar -zxvf grafana-enterprise-11.5.1.linux-amd64.tar.gz -C /opt/software/prometheus/
#重命名
mv /opt/software/prometheus/grafana-v11.5.1 /opt/software/prometheus/grafana
3.2.2 自定义Systemctl
bash
cat > /etc/systemd/system/grafana-server.service << 'EOF'
[Unit]
Description=Grafana server
Documentation=http://docs.grafana.org
[Service]
Type=simple
User=root
Group=root
Restart=on-failure
ExecStart=/opt/software/prometheus/grafana/bin/grafana-server \
  --config=/opt/software/prometheus/grafana/conf/defaults.ini \
  --homepath=/opt/software/prometheus/grafana
[Install]
WantedBy=multi-user.target

EOF
加载自定义的systemctl配置
bash
systemctl daemon-reload3.2.3 启动Grafana
bash
# 启动Prometheus
systemctl start grafana-server
# 开机自启动Prometheus
systemctl enable grafana-server
3.2.4 访问Grafana后台
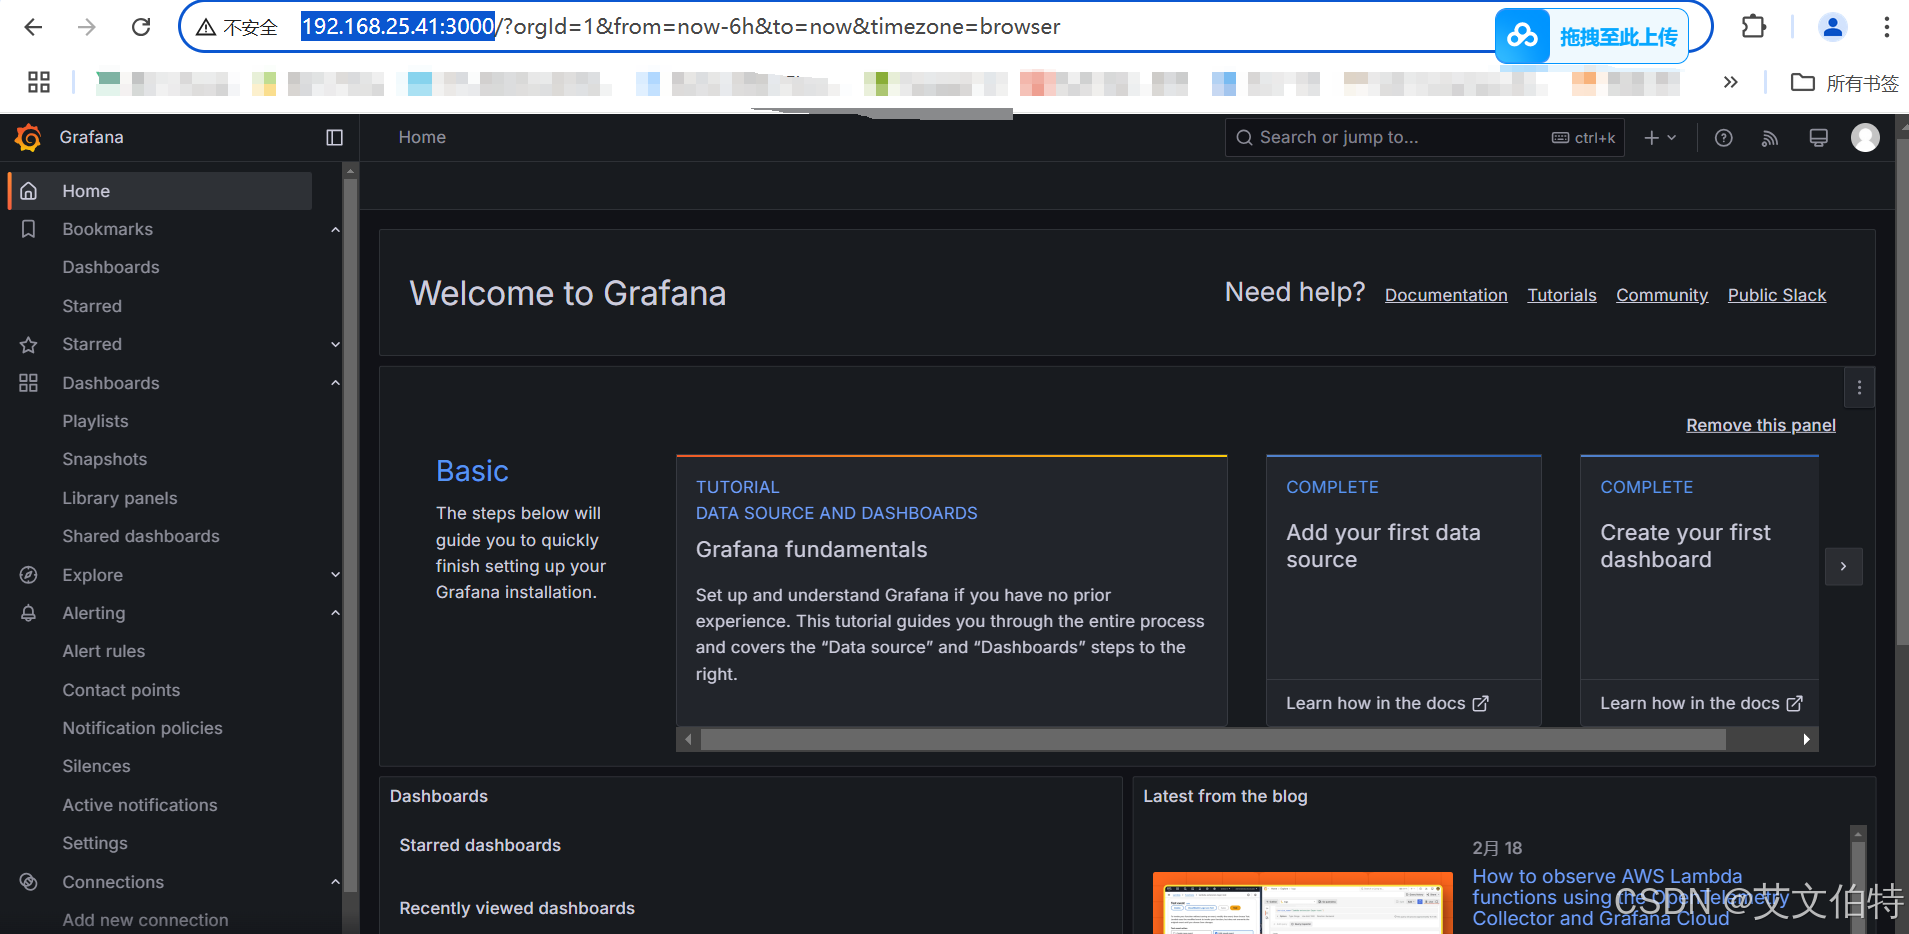
浏览器访问:http://192.168.25.41:3000/
默认账号/密码 :admin/admin
默认账号密码可详见:/opt/software/prometheus/grafana/conf/defaults.ini文件
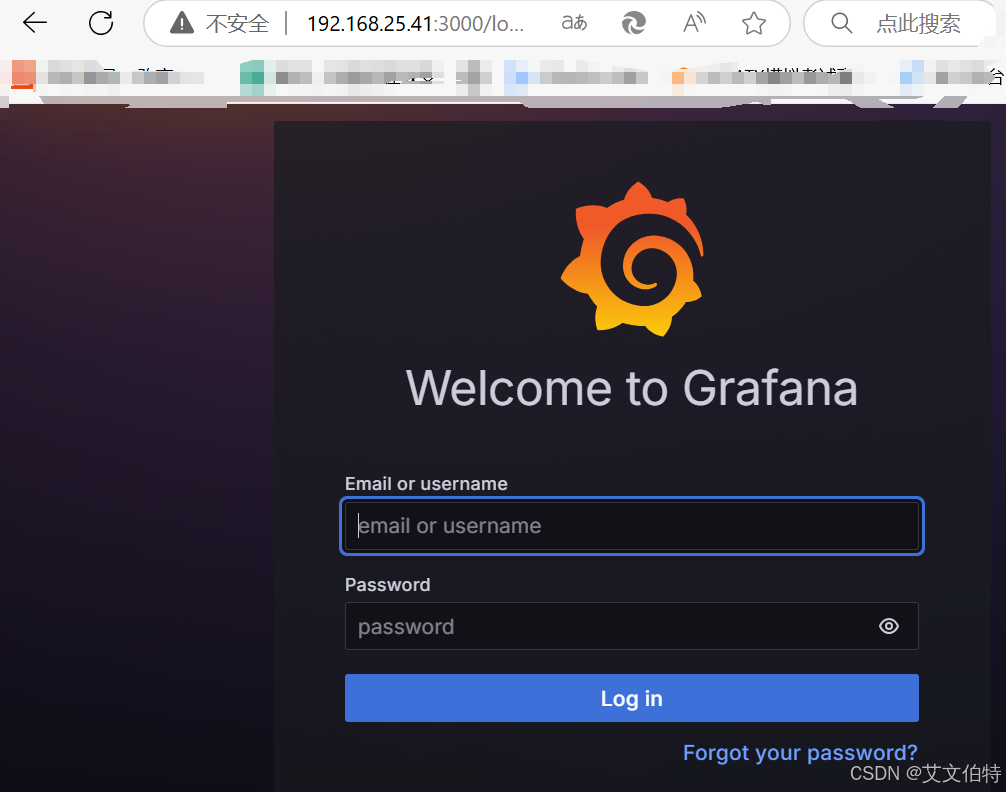
输入账号密码进行登陆...
3.2.5 添加Prometheus数据源
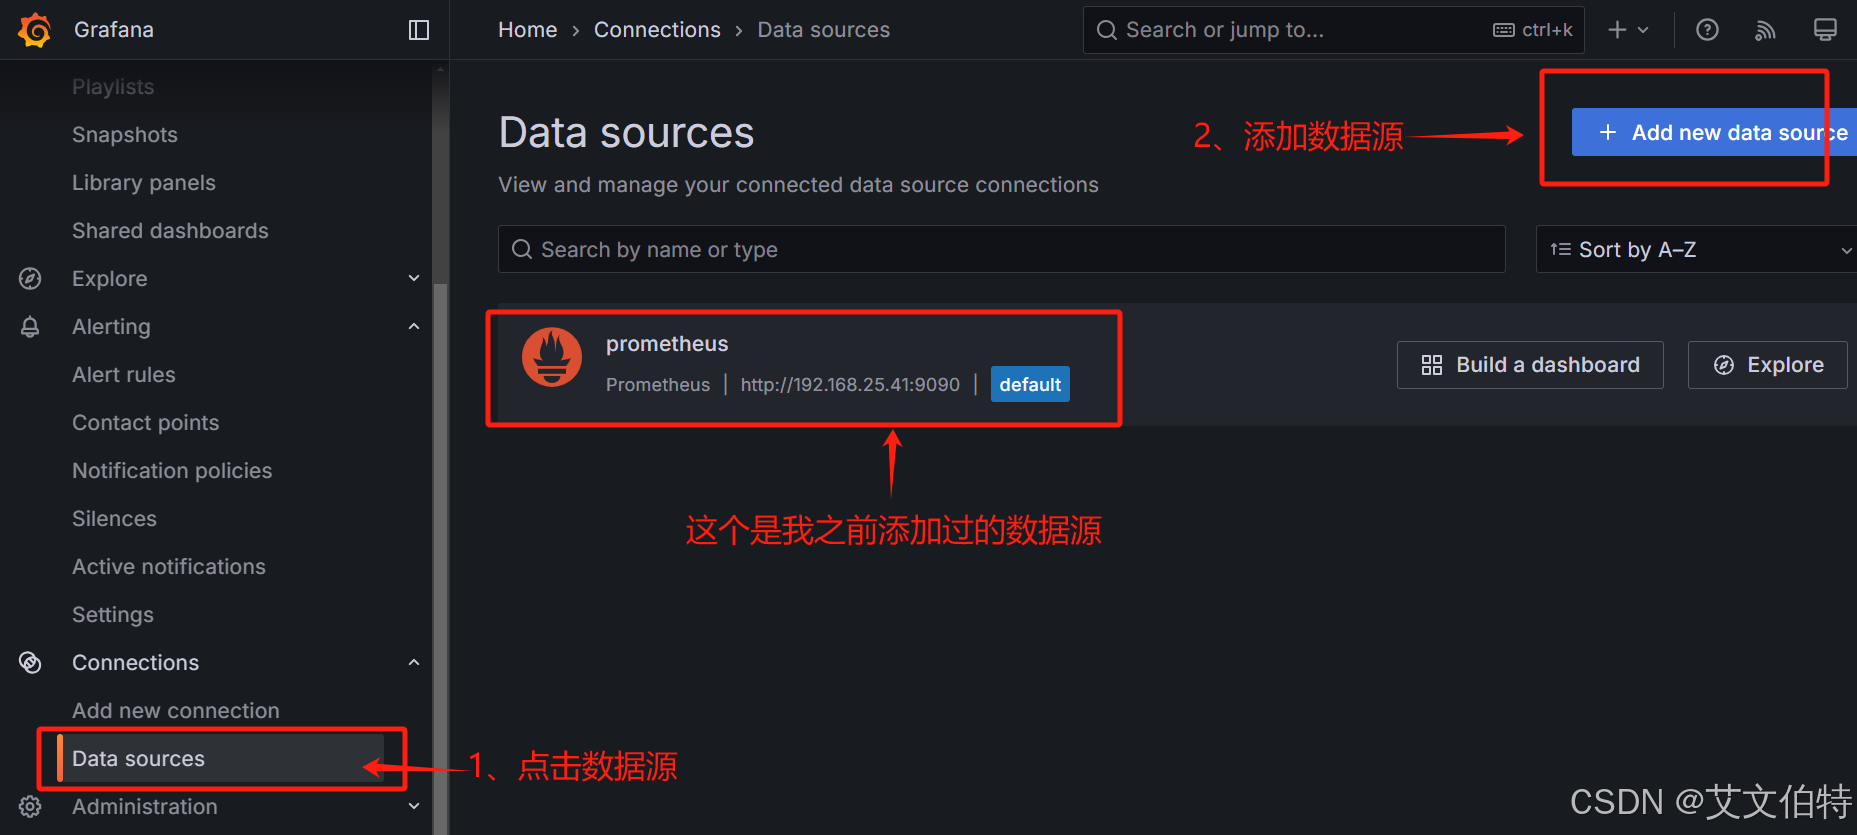
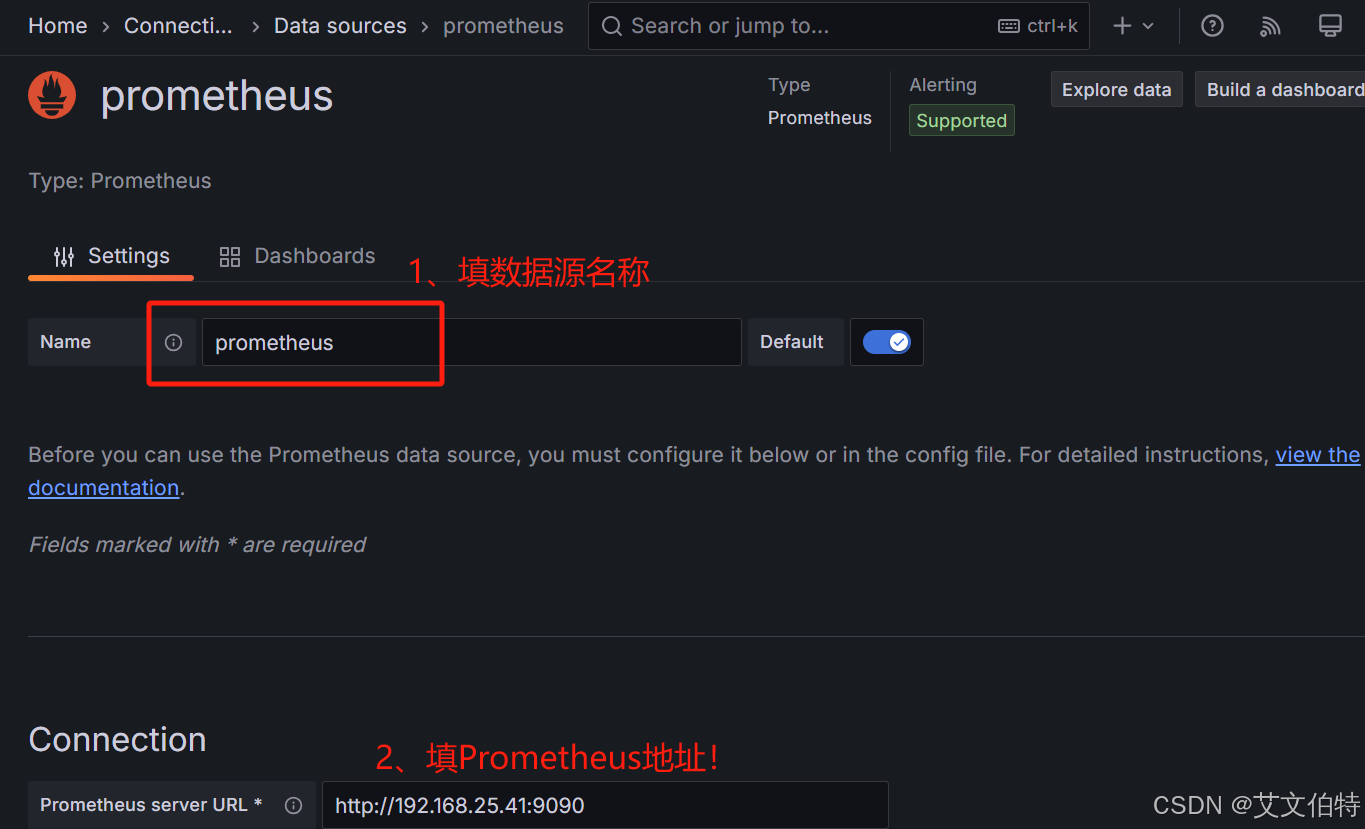
然后一直点下一步即可创建出数据源。
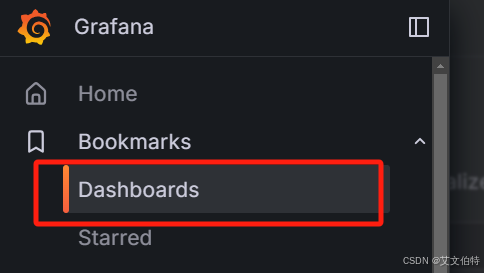
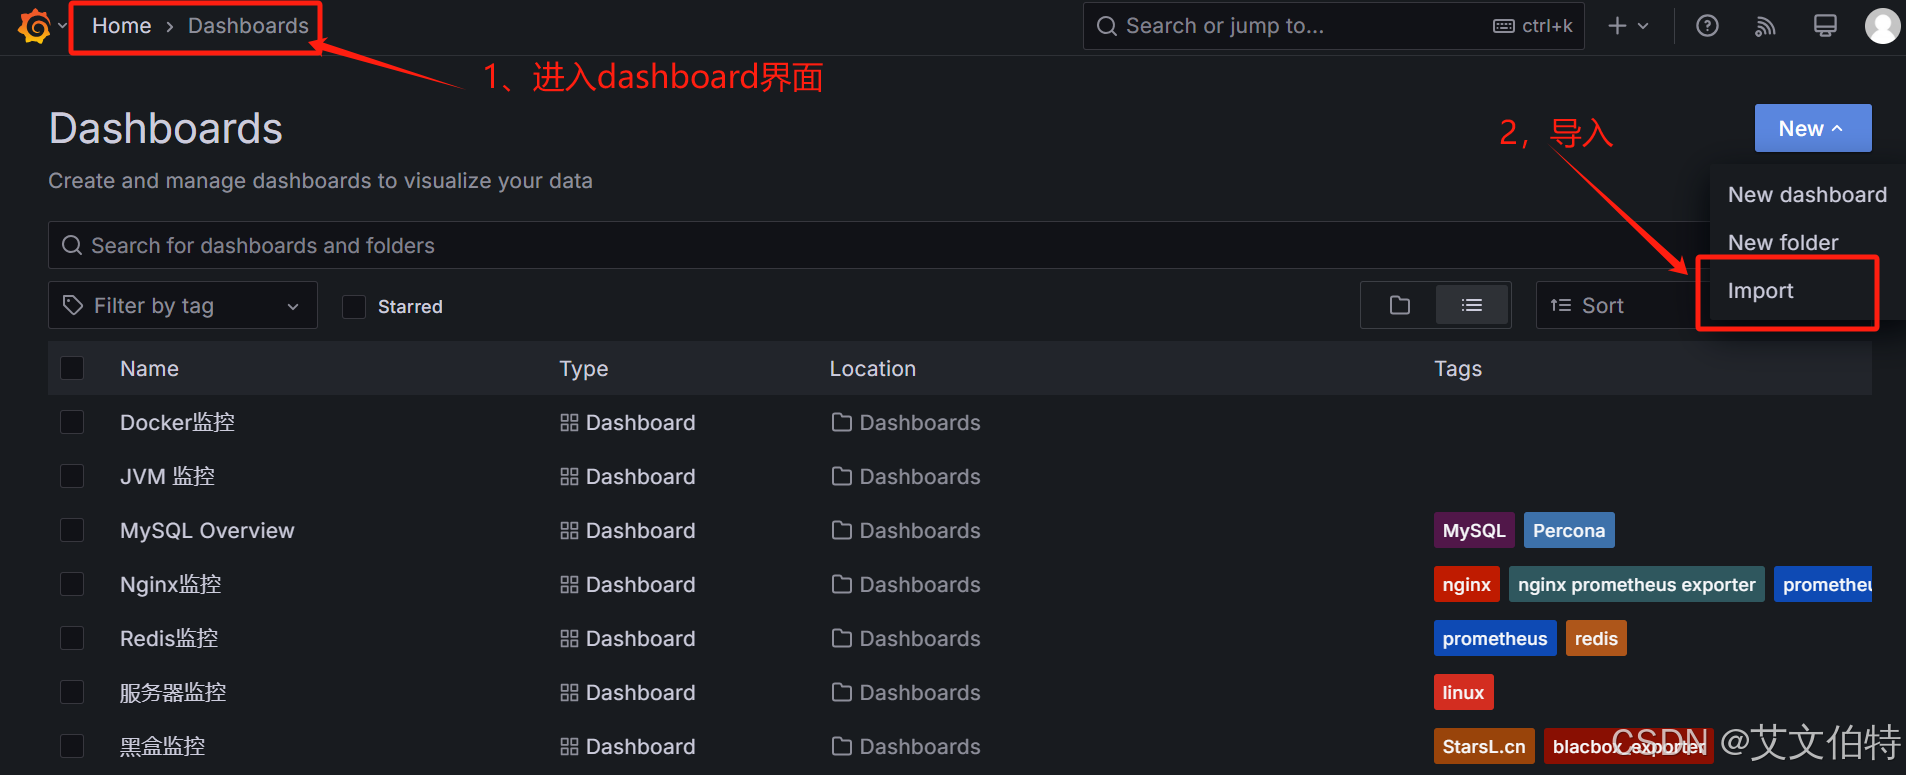
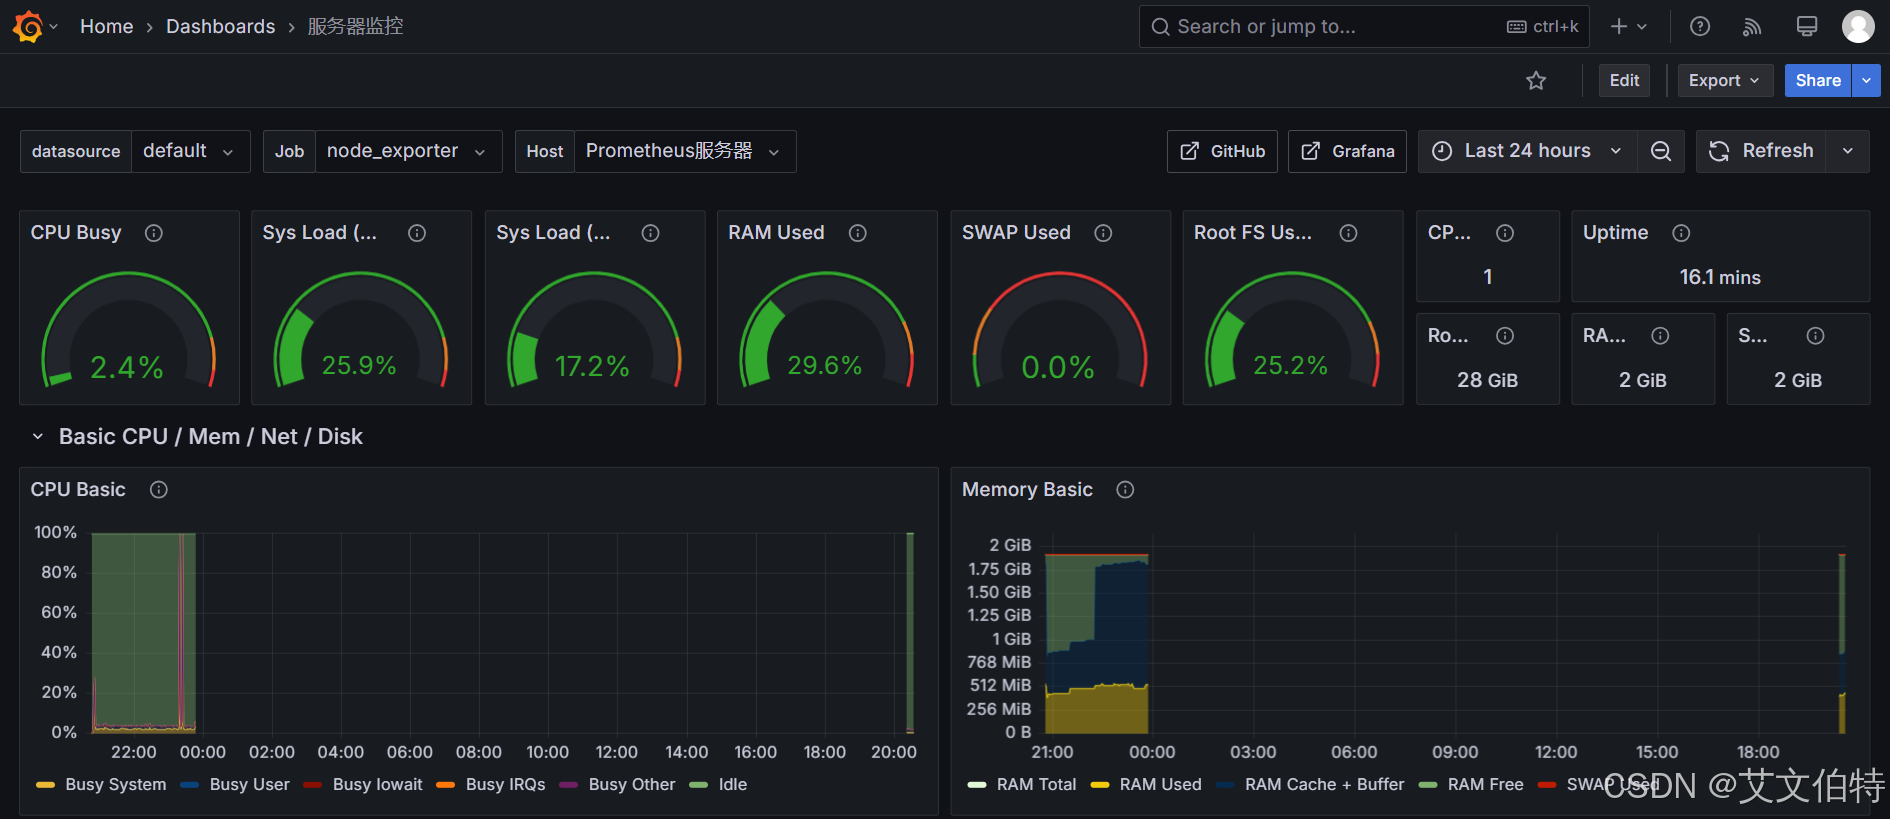
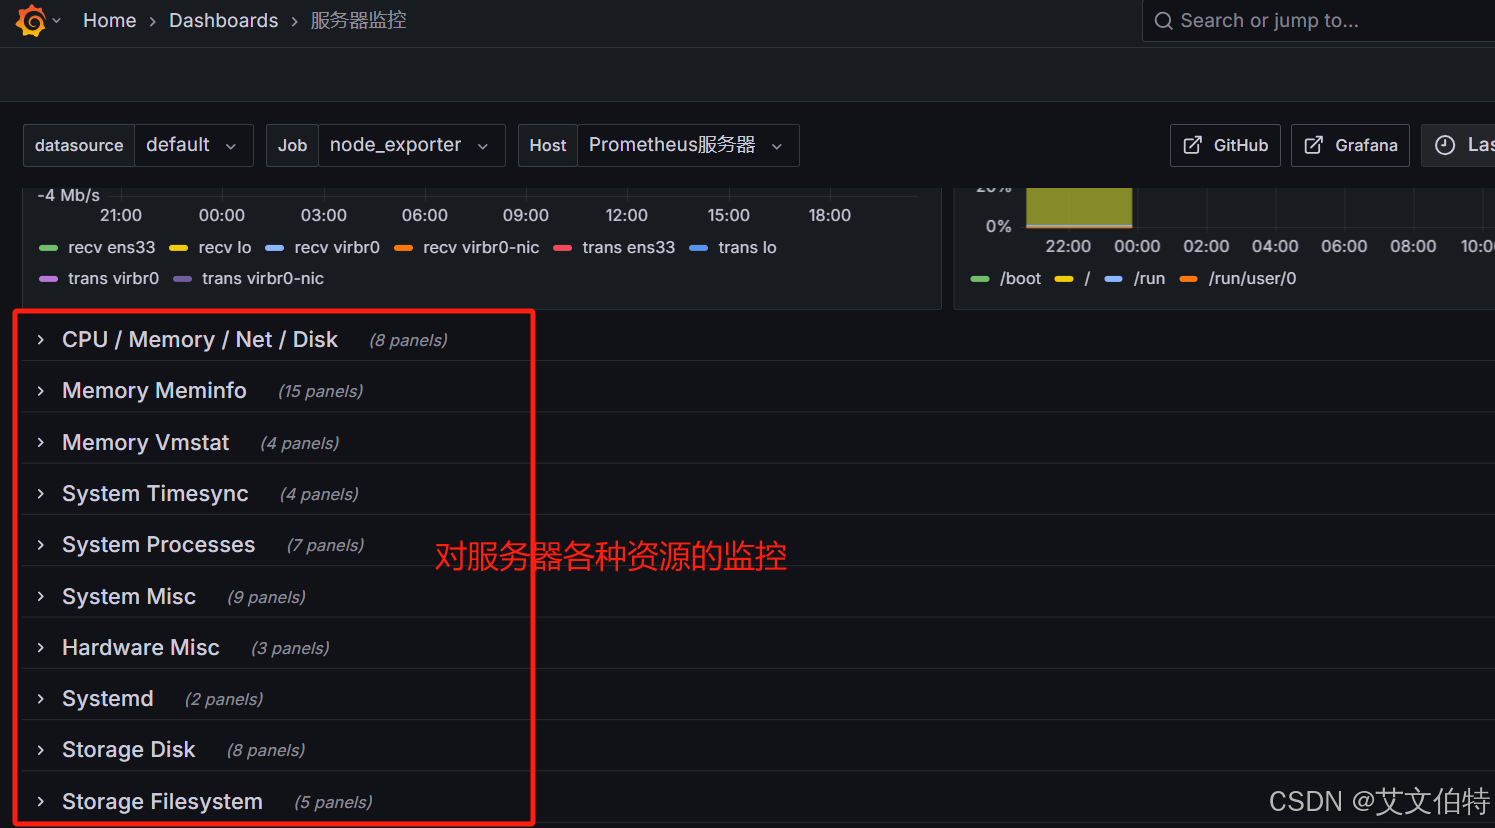
3.2.6 添加Dashboard(服务器监控仪表盘)
Grafana的node exporter full地址:https://grafana.com/grafana/dashboards/1860-node-exporter-full/
具体下载链接:https://grafana.com/api/dashboards/1860/revisions/33/download
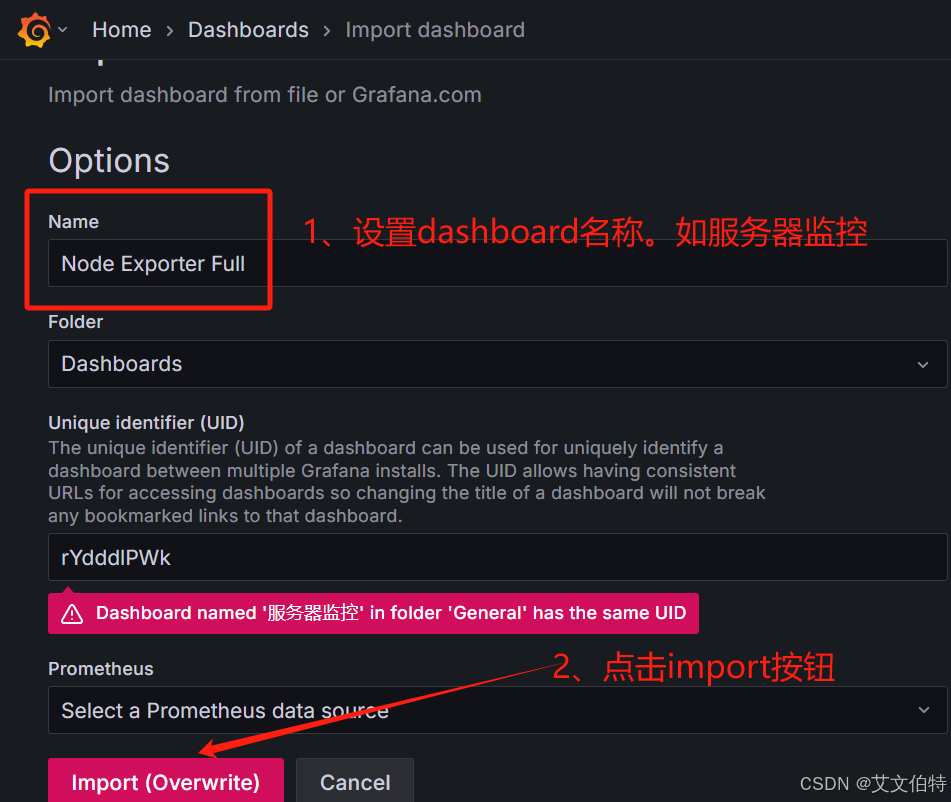
最终效果:
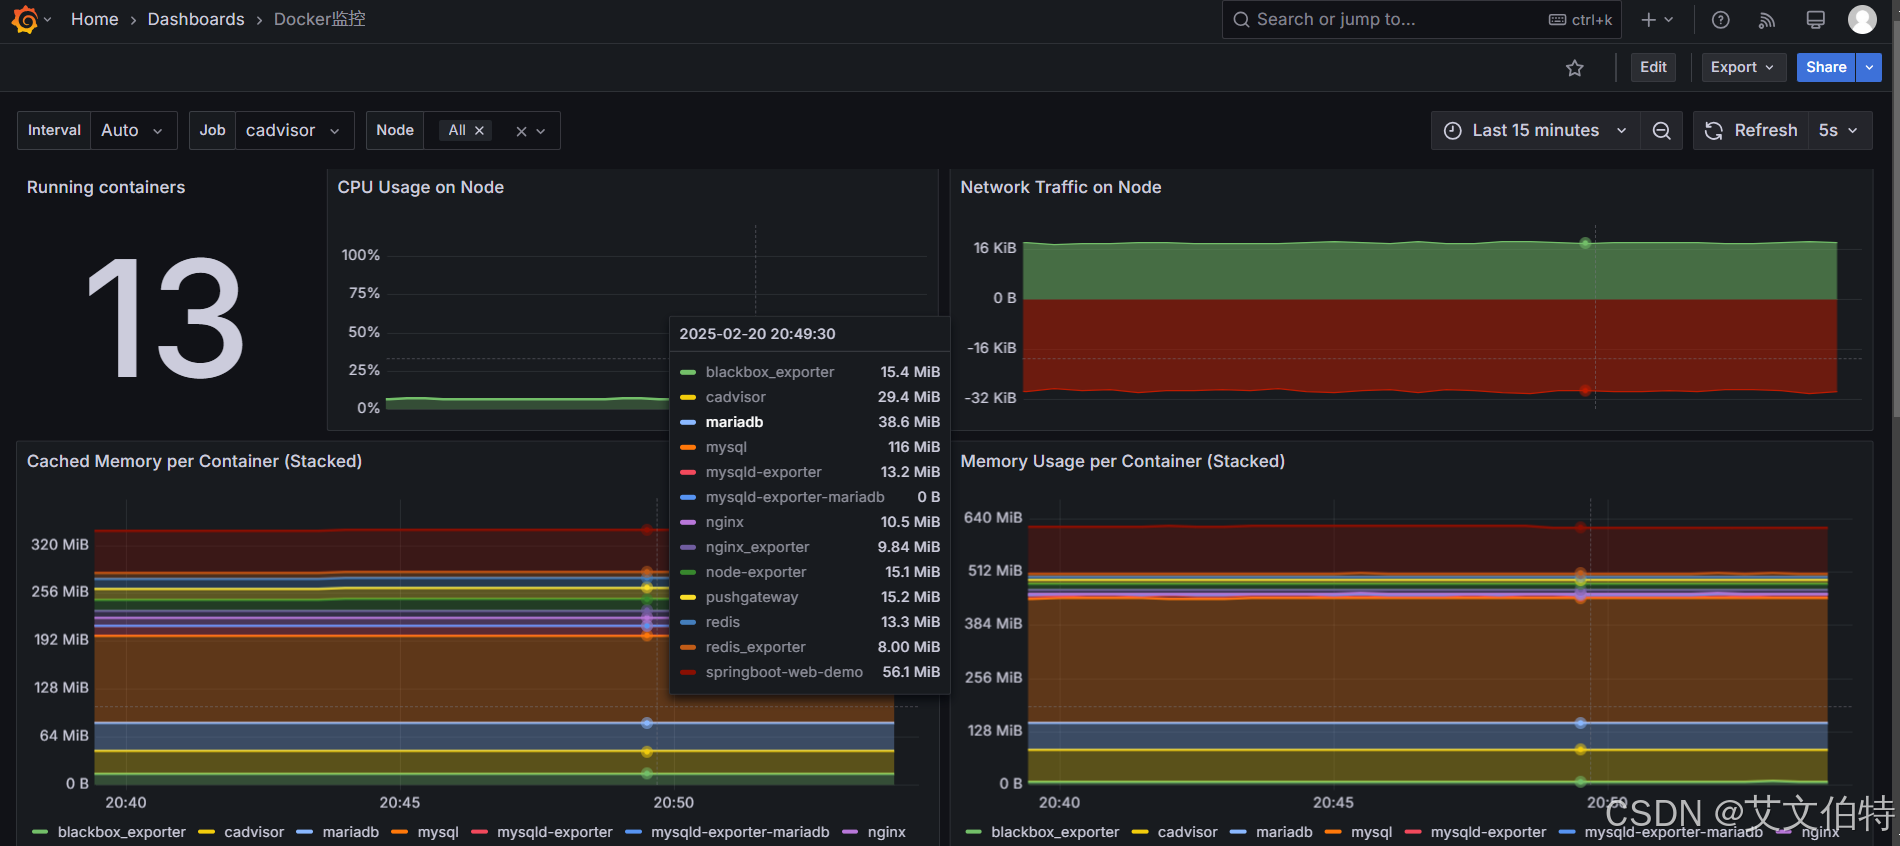
3.2.7 添加Dashboard(容器监控仪表盘)
Grafana的容器监控仪表盘地址:https://grafana.com/grafana/dashboards/11600-docker-container/
具体下载链接:https://grafana.com/api/dashboards/11600/revisions/1/download
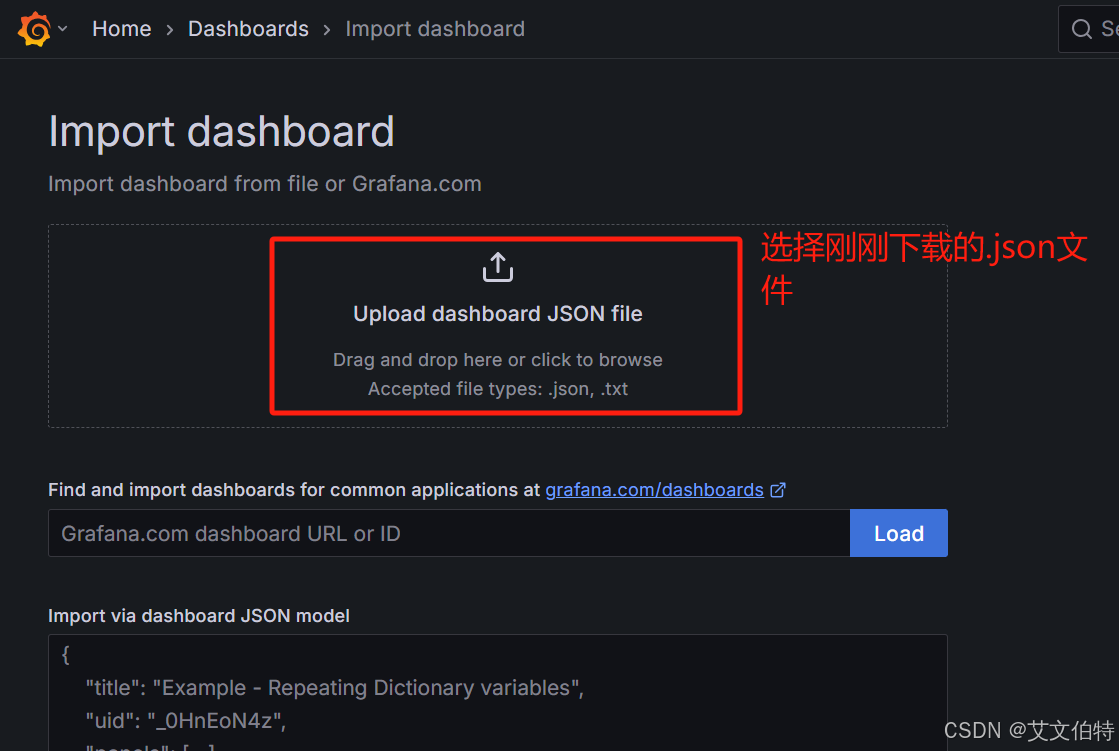
下载json文件后,将json文件导入dashboard。效果如下:
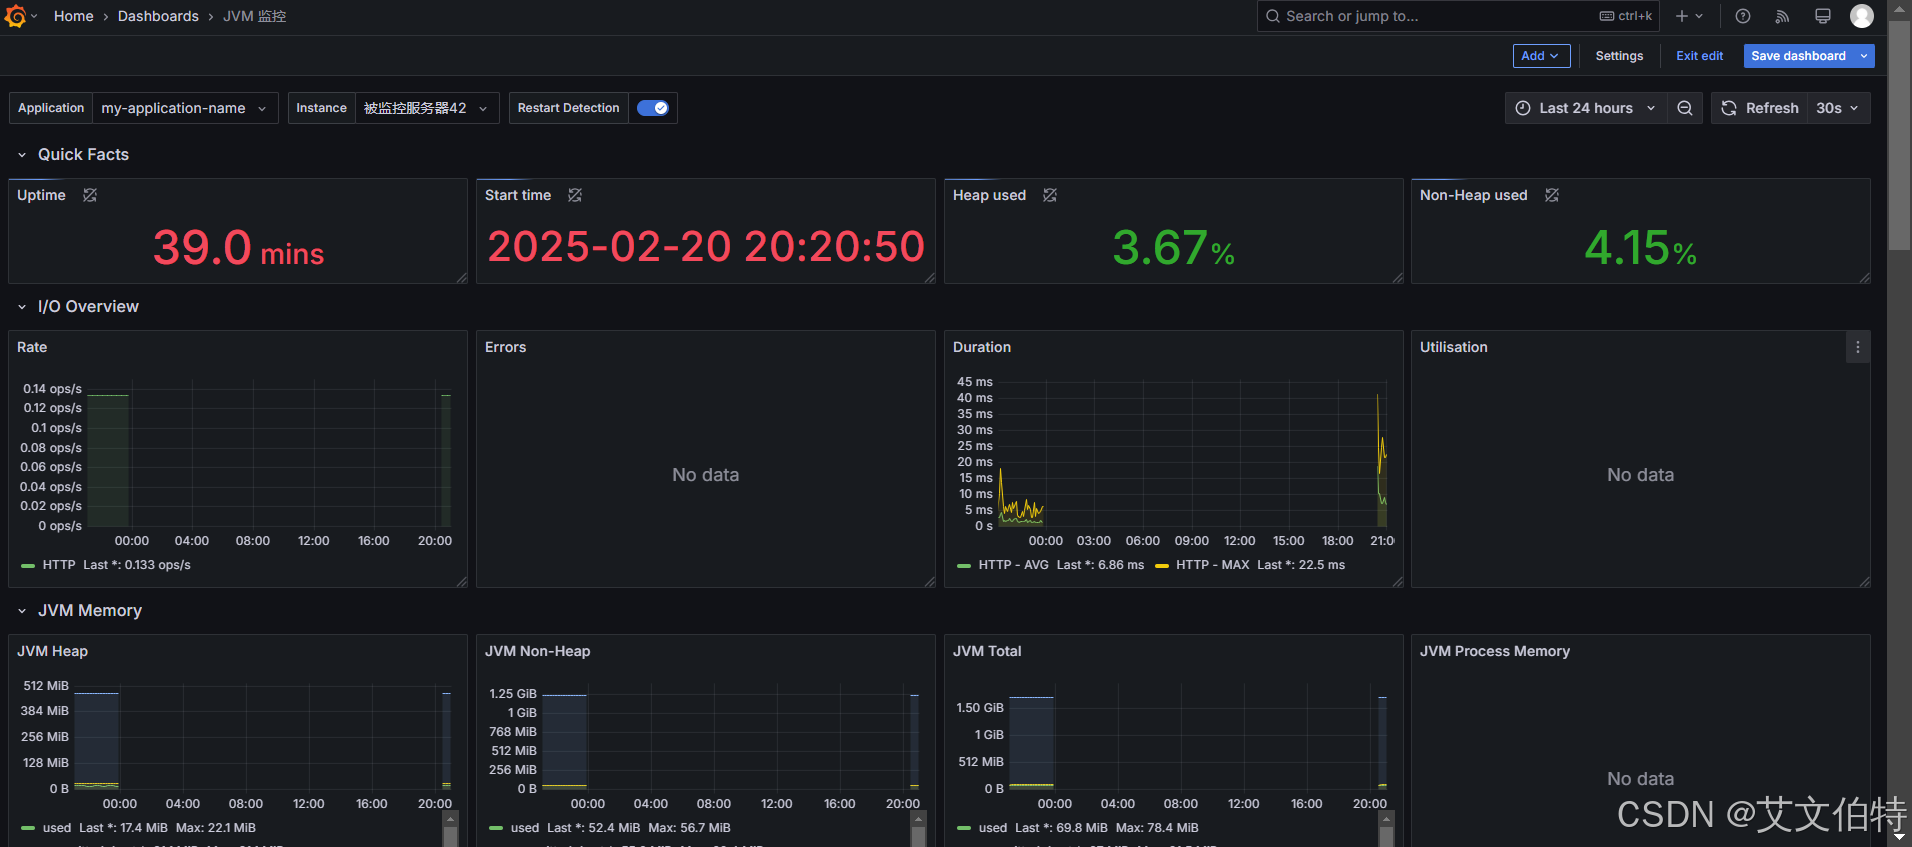
3.2.8 添加JAVA监控(JVM监控仪表盘)
Grafana的容器监控仪表盘地址:https://grafana.com/grafana/dashboards/4701-jvm-micrometer//
具体下载链接:https://grafana.com/api/dashboards/4701/revisions/10/download
下载json文件后,将json文件导入dashboard。效果如下:
3.2.9 添加Mysql监控(Mysql监控仪表盘)
Grafana的容器监控仪表盘地址:https://grafana.com/grafana/dashboards/7362-mysql-overview/
具体下载链接:https://grafana.com/api/dashboards/7362/revisions/5/download
下载json文件后,将json文件导入dashboard。效果如下:

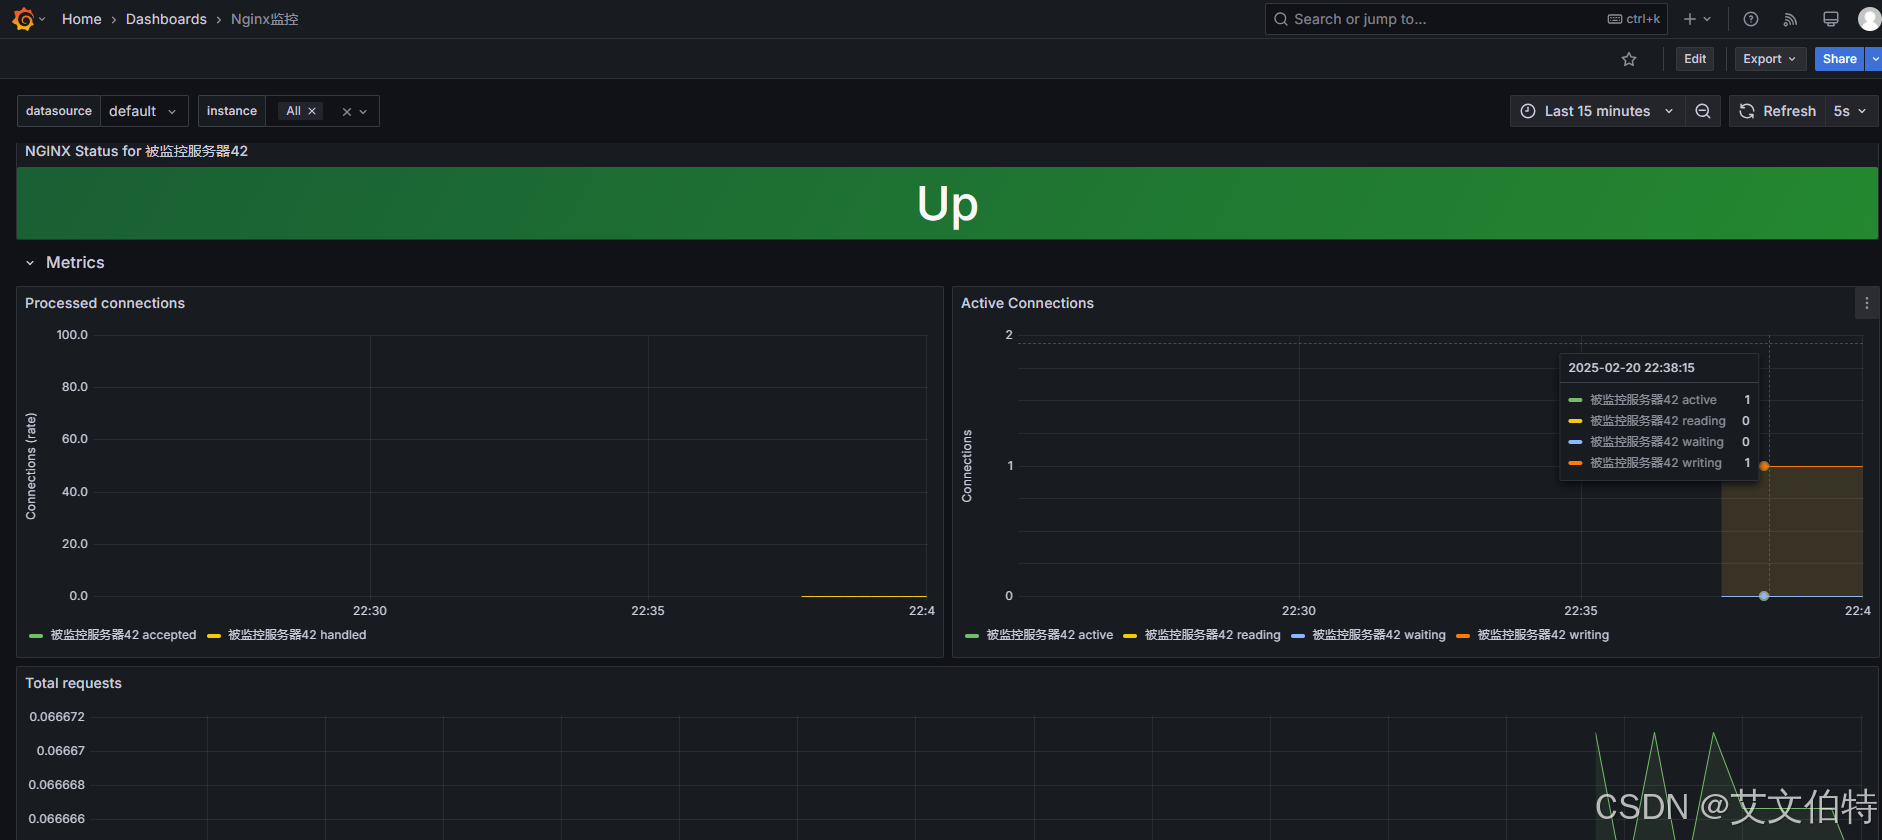
3.2.10 添加Nginx监控(Nginx监控仪表盘)
Grafana的容器监控仪表盘地址:https://grafana.com/grafana/dashboards/12708-nginx/
具体下载链接:https://grafana.com/api/dashboards/12708/revisions/1/download
下载json文件后,将json文件导入dashboard。效果如下:
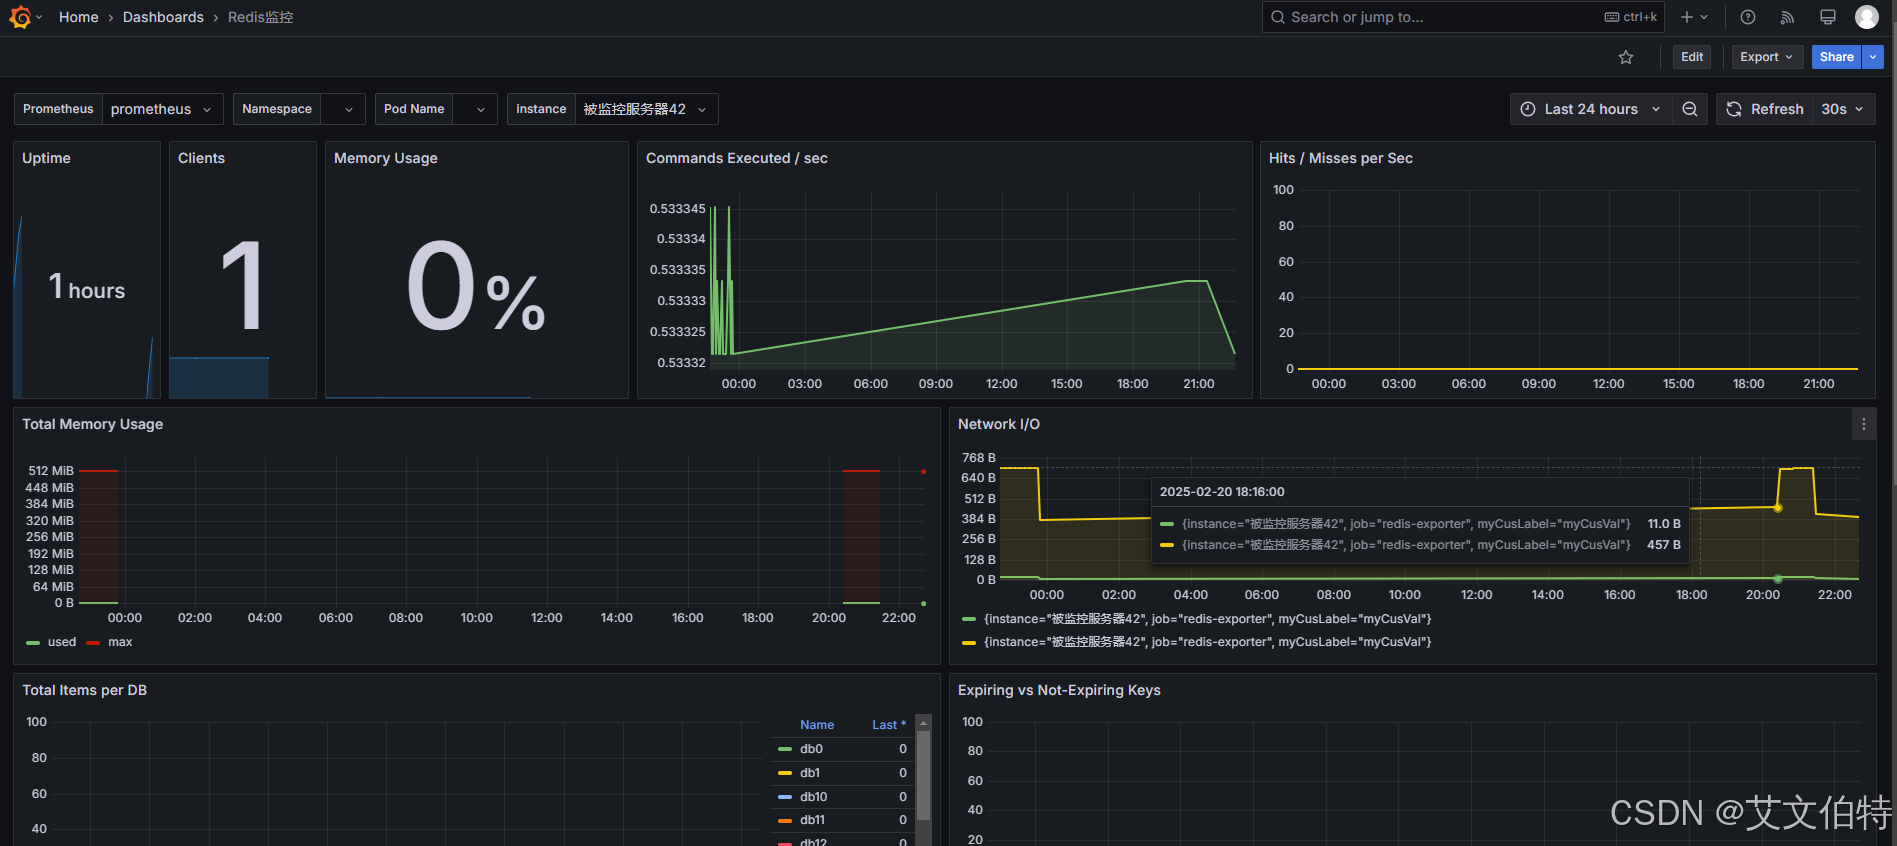
3.2.11 添加Redis监控(Redis监控仪表盘)
Grafana的容器监控仪表盘地址:https://grafana.com/grafana/dashboards/11835-redis-dashboard-for-prometheus-redis-exporter-helm-stable-redis-ha
具体下载链接:https://grafana.com/api/dashboards/11835/revisions/1/download
下载json文件后,将json文件导入dashboard。效果如下:
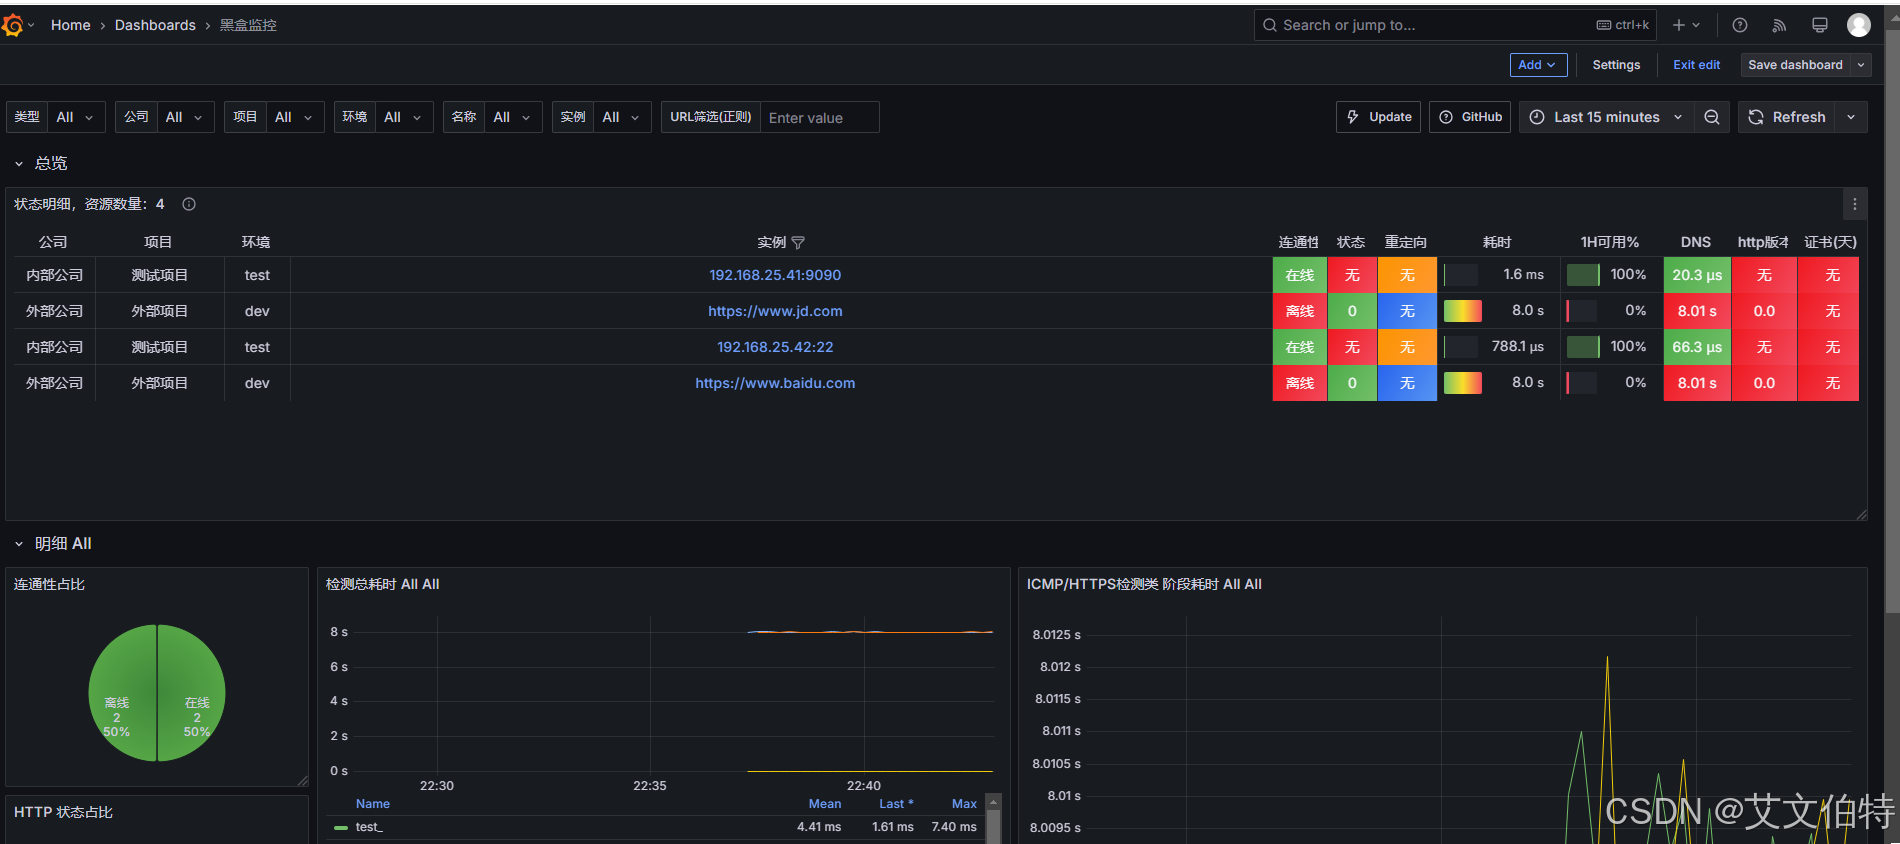
3.2.12 添加黑盒监控(黑盒监控仪表盘)
Grafana的容器监控仪表盘地址:https://grafana.com/grafana/dashboards/9965-1-blackbox-exporter-dashboard-20220412/
具体下载链接:https://grafana.com/api/dashboards/9965/revisions/3/download
下载json文件后,将json文件导入dashboard。效果如下:
3.3.AlertManager安装
3.3.1.安装流程
bash
# 下载安装包
wget https://github.com/prometheus/alertmanager/releases/download/v0.28.0/alertmanager-0.28.0.linux-amd64.tar.gz
# 解压到特定目录
tar -zxvf alertmanager-0.28.0.linux-amd64.tar.gz -C /opt/software/prometheus/
#重命名
mv /opt/software/prometheus/alertmanager-0.28.0.linux-amd64 /opt/software/prometheus/alertmanager
3.3.2.修改alertmanager.yml
bash
vim /opt/software/prometheus/alertmanager/alertmanager.yml完整内容如下:
bash
global:
  #163服务器
  smtp_smarthost: 'smtp.163.com:465'
  #发邮件的邮箱
  smtp_from: 'xxxxxx@163.com'
  #发邮件的邮箱用户名,也就是你的邮箱
  smtp_auth_username: 'xxxxxx@163.com'
  #发邮件的邮箱密码(授权码)
  smtp_auth_password: 'xxxxxxxxx'
  #tls验证配置,false为关闭
  smtp_require_tls: false

#模版配置
templates:
  - '/opt/software/prometheus/alertmanager/template/*.tmpl'

route:
  group_by: ['altername']
  # 当收到告警的时候,等待group_wait配置的时间10s,看是否还有告警,如果有就一起发出去
  group_wait: 10s
  # 如果上次告警信息发送成功,此时又来了一个新的告警数据,则需要等待group_interval配置的时间才可以发送出去
  group_interval: 10s
  # 如果上次告警信息发送成功,且问题没有解决,则等待 repeat_interval配置的时间再次发送告警数据
  repeat_interval: 1m
  # 全局报警组,这个参数是必选的,和下面报警组名要相同
  #receiver: 'email'	# 邮件通知
  #receiver: 'wechat'	# 企业微信通知
  receiver: 'web.hook'	# API接口通知

receivers:
  - name: 'email'
    email_configs:
      # 邮件通知人1
    - to: 'xxxx@163.com'
      # 报警修复时也发送通知
      send_resolved: true
      # 指定邮件模板
      html: '{{ template "email.html" .}}'
      # 邮件通知人2
    - to: 'jxf1905216170@foxmail.com'
      # 报警修复时也发送通知
      send_resolved: true
      # 指定邮件模板
      html: '{{ template "email.html" .}}'

  - name: "wechat"
    webhook_configs:
      # 企业微信通知服务暴露出来的URL,后面会讲。
      - url: 'http://192.168.25.41:8999/webhook?key=xxxxxx'
        send_resolved: true

  - name: 'web.hook'
    webhook_configs:
      # 能处理告警内容的服务暴露出来的API接口(用户自定义服务来处理告警信息)。
      - url: 'http://192.168.25.2:8080/webhook'

# 抑制规则。下面意思为:如果有一个严重程度为"critical"的告警(源告警),并且存在另一个严重程度为"warning"的告警(目标告警),且这两个告警的 alertname、dev 和 instance 标签值都相同,那么系统将不会发送或显示那个"warning"级别的告警。
inhibit_rules:
  - source_match:
      severity: 'critical'
    target_match:
      severity: 'warning'
    equal: ['alertname', 'dev', 'instance']
3.3.3.邮件通知相关配置
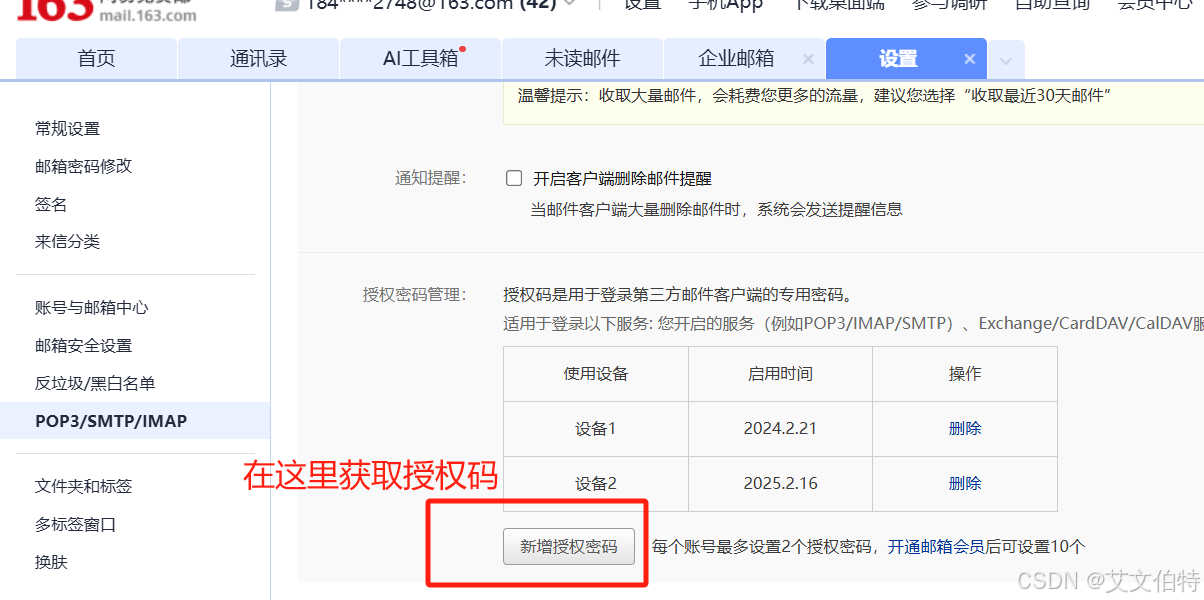
3.3.3.1 获取163邮件授权码
位置:设置 》POP3/SMTP /IMAP》新增授权码

3.3.3.2 编定义邮件模板(可选)
注:自定义邮件模板是可选的,你也可以不设置自定义邮件模板,此时用的就是默认邮件模板。
bash
mkdir /opt/software/prometheus/alertmanager/template/3.3.4.企业微信通知相关配置
3.3.4.1.获取企业微信机器人webhook
1、首先在企业微信里面创建一个 个人组织,然后在聊天群中创建一个机器人。

2、创建成功后,进入全员群(刚创建的那个群):

3、在全员群里面添加机器人:

添加成功后,会有一个机器人对应的Webhook地址,里面包含一个KEY。这KEY很重要,alertmanager.yml里面配置企业微信告警通知的时候会使用到这个KEY。具体配置查看上文章节3.3.2

3.3.4.2.配置企业微信机器人告警通知服务
下载地址:https://download.csdn.net/download/jianghuchuang/90415760
文件下载后打开,如下所示:
bash
[root@prometheus alertmanager-wechatrobot-webhook]# pwd
/opt/software/prometheus/alertmanager-wechatrobot-webhook

[root@prometheus alertmanager-wechatrobot-webhook]# ll
总用量 10700
-rwxr-xr-x 1 root root 10924527 2月  16 18:50 alertmanager-wechatrobot-webhook
-rw-r--r-- 1 root root      265 2月  16 18:51 alertmanager-wechatrobot-webhook.service
-rw-r--r-- 1 root root      554 2月  16 18:50 Dockerfile
-rw-r--r-- 1 root root    11558 2月  16 18:50 LICENSE
-rw-r--r-- 1 root root      684 2月  16 18:50 README.md
-rw-r--r-- 1 root root      164 2月  16 18:50 start.sh
自定义Systemctl:
bash
 cat > /etc/systemd/system/alertmanager-wechatrobot-webhook.service << 'EOF'
[Unit]
Description=alertmanager-wechatrobot-webhook

[Service]
User=root
Group=root
Restart=on-failure
ExecStart=/opt/software/prometheus/alertmanager-wechatrobot-webhook/alertmanager-wechatrobot-webhook

[Install]
WantedBy=multi-user.target

EOF
启动服务:
bash
#重新加载systemctl
systemctl daemon-reload
#启动服务
systemctl start alertmanager-wechatrobot-webhook
#开机自动
systemctl enable alertmanager-wechatrobot-webhook
注:启动后,当前会暴露一个接口:
http://192.168.25.41:8999/webhook?key=xxxxxx。这个地址配置在alertmanager.yml里面(具体配置查看上文章节3.3.2)。key是企业微信机器人Webhook里面的key
3.3.5 自定义服务通知相关配置(springboot为例)
自定义服务接收告警消息,以springboot2.6.2为例子。
3.3.5.1 修改pom.xml
xml
<!-- spring-boot-actuator依赖 -->
        <dependency>
            <groupId>org.springframework.boot</groupId>
            <artifactId>spring-boot-starter-actuator</artifactId>
            <version>2.6.2</version>
        </dependency>
        <!-- prometheus依赖!!!!这个千万不要加版本号,不然访问不到/actuator/prometheus接口 -->
        <!-- https://mvnrepository.com/artifact/io.micrometer/micrometer-registry-prometheus -->
        <dependency>
            <groupId>io.micrometer</groupId>
            <artifactId>micrometer-registry-prometheus</artifactId>
        </dependency>
3.3.5.2 修改application.yml
application.yml 完整配置如下
yaml
server:
  port: 8080
spring:
  application:
    name: my-application-name
#management:
#  endpoints:
#    web:
#      exposure:
#        include: "*"
#  metrics:
#    tags:
#      myApplication: ${spring.application.name}
#      myTag:  my-application-tag

management:
  metrics:
    tags:
      application: ${spring.application.name}
    export:
      prometheus:
        enabled: true
  #开启暴露web
  endpoints:
    web:
      exposure:
        include: prometheus
3.3.5.3 添加webhook接口
java
package com.jxf.controller;

import com.alibaba.fastjson.JSON;
import com.alibaba.fastjson.JSONArray;
import com.alibaba.fastjson.JSONObject;
import lombok.extern.slf4j.Slf4j;
import org.springframework.http.HttpStatus;
import org.springframework.http.ResponseEntity;
import org.springframework.web.bind.annotation.*;

import java.text.SimpleDateFormat;
import java.time.Instant;
import java.time.ZonedDateTime;
import java.time.format.DateTimeFormatter;
import java.util.Date;

@Slf4j
@RestController
@RequestMapping("")
public class WebController {

    /**
     * 处理alert manager传过来的告警消息
     * @param payload 告警内容示例:{"receiver":"web\\.hook","status":"firing","alerts":[{"status":"firing","labels":{"alertname":"http状态码检测失败","company":"外部公司","env":"dev","instance":"https://www.baidu.com","job":"blackbox_http","project":"外部项目","severity":"critical"},"annotations":{"description":"HTTP状态码非 200-399,当前状态码为:0","summary":"http状态码检测失败https://www.baidu.com"},"startsAt":"2025-02-16T13:44:39.052Z","endsAt":"0001-01-01T00:00:00Z","generatorURL":"http://prometheus:9090/graph?g0.expr=probe_http_status_code+%3C%3D+199+or+probe_http_status_code+%3E%3D+400\u0026g0.tab=1","fingerprint":"43644ea5fd1763ae"},{"status":"firing","labels":{"alertname":"请求慢告警","company":"外部公司","env":"dev","instance":"https://www.baidu.com","job":"blackbox_http","project":"外部项目","severity":"warning"},"annotations":{"description":"请求时间超过1秒,值为:8.00394340575","summary":"请求慢https://www.baidu.com"},"startsAt":"2025-02-16T13:46:24.052Z","endsAt":"0001-01-01T00:00:00Z","generatorURL":"http://prometheus:9090/graph?g0.expr=avg_over_time%28probe_duration_seconds%5B1m%5D%29+%3E+1\u0026g0.tab=1","fingerprint":"8e7993450dd4f17a"},{"status":"firing","labels":{"alertname":"黑盒子探测失败告警","company":"外部公司","env":"dev","instance":"https://www.baidu.com","job":"blackbox_http","project":"外部项目","severity":"critical"},"annotations":{"description":"黑盒子检测失败,当前值:0","summary":"黑盒子探测失败https://www.baidu.com"},"startsAt":"2025-02-16T13:44:39.052Z","endsAt":"0001-01-01T00:00:00Z","generatorURL":"http://prometheus:9090/graph?g0.expr=probe_success+%3D%3D+0\u0026g0.tab=1","fingerprint":"62e21997d2d79e55"},{"status":"firing","labels":{"alertname":"http状态码检测失败","company":"外部公司","env":"dev","instance":"https://www.jd.com","job":"blackbox_http","project":"外部项目","severity":"critical"},"annotations":{"description":"HTTP状态码非 200-399,当前状态码为:0","summary":"http状态码检测失败https://www.jd.com"},"startsAt":"2025-02-16T13:44:54.052Z","endsAt":"0001-01-01T00:00:00Z","generatorURL":"http://prometheus:9090/graph?g0.expr=probe_http_status_code+%3C%3D+199+or+probe_http_status_code+%3E%3D+400\u0026g0.tab=1","fingerprint":"9760f8b330d656e7"},{"status":"firing","labels":{"alertname":"请求慢告警","company":"外部公司","env":"dev","instance":"https://www.jd.com","job":"blackbox_http","project":"外部项目","severity":"warning"},"annotations":{"description":"请求时间超过1秒,值为:8.003534726249999","summary":"请求慢https://www.jd.com"},"startsAt":"2025-02-16T13:44:39.052Z","endsAt":"0001-01-01T00:00:00Z","generatorURL":"http://prometheus:9090/graph?g0.expr=avg_over_time%28probe_duration_seconds%5B1m%5D%29+%3E+1\u0026g0.tab=1","fingerprint":"a5440fd5910568ef"},{"status":"firing","labels":{"alertname":"黑盒子探测失败告警","company":"外部公司","env":"dev","instance":"https://www.jd.com","job":"blackbox_http","project":"外部项目","severity":"critical"},"annotations":{"description":"黑盒子检测失败,当前值:0","summary":"黑盒子探测失败https://www.jd.com"},"startsAt":"2025-02-16T13:44:54.052Z","endsAt":"0001-01-01T00:00:00Z","generatorURL":"http://prometheus:9090/graph?g0.expr=probe_success+%3D%3D+0\u0026g0.tab=1","fingerprint":"d18163c9f43b4cba"},{"status":"firing","labels":{"alertname":"请求慢告警","company":"内部公司","instance":"192.168.25.200","job":"blackbox_icmp","project":"测试项目","severity":"warning"},"annotations":{"description":"请求时间超过1秒,值为:9.50104220425","summary":"请求慢192.168.25.200"},"startsAt":"2025-02-16T13:44:39.052Z","endsAt":"0001-01-01T00:00:00Z","generatorURL":"http://prometheus:9090/graph?g0.expr=avg_over_time%28probe_duration_seconds%5B1m%5D%29+%3E+1\u0026g0.tab=1","fingerprint":"f952edd5054e1767"},{"status":"firing","labels":{"alertname":"黑盒子探测失败告警","company":"内部公司","instance":"192.168.25.200","job":"blackbox_icmp","project":"测试项目","severity":"critical"},"annotations":{"description":"黑盒子检测失败,当前值:0","summary":"黑盒子探测失败192.168.25.200"},"startsAt":"2025-02-16T13:44:54.052Z","endsAt":"0001-01-01T00:00:00Z","generatorURL":"http://prometheus:9090/graph?g0.expr=probe_success+%3D%3D+0\u0026g0.tab=1","fingerprint":"e79230366cea2dc2"}],"groupLabels":{},"commonLabels":{},"commonAnnotations":{},"externalURL":"http://prometheus:9093","version":"4","groupKey":"{}:{}","truncatedAlerts":0}
     * @return
     */
    @PostMapping("/webhook")
    public ResponseEntity<String> receiveAlert(@RequestBody String payload) {
        JSONObject data = JSON.parseObject(payload);
        JSONArray alerts = JSON.parseArray(data.getString("alerts"));
        log.error("======================收到告警消息({}条)========================", alerts.size());
        for (int i = 0; i < alerts.size(); i++) {
            JSONObject alert = alerts.getJSONObject(i);
            String status = alert.getString("status");
            String startsAt = new SimpleDateFormat("YYYY-MM-dd HH:mm:ss").format(Date.from(Instant.parse(alert.getString("startsAt"))));
            String endsAt = new SimpleDateFormat("YYYY-MM-dd HH:mm:ss").format(Date.from(Instant.parse(alert.getString("endsAt"))));

            JSONObject annotations = alert.getJSONObject("annotations");
            String summary = annotations.getString("summary");
            String description = annotations.getString("description");
            log.error("收到告警消息:类型{}, 开始时间:{}, 结束时间:{}, 主题:{}, 详情:{}", status, startsAt, endsAt, summary, description);
        }
        log("====================================================");

        // 返回响应,表示已成功接收告警
        return new ResponseEntity<>("Alerts received", HttpStatus.OK);
    }

}
3.3.6 自定义Systemctl
bash
cat > /etc/systemd/system/alertmanager.service << 'EOF'
[Unit]
Description=Alert Manager
Wants=network-online.target
After=network-online.target

[Service]
Type=simple
User=root
Group=root
ExecStart=/opt/software/prometheus/alertmanager/alertmanager \
  --config.file=/opt/software/prometheus/alertmanager/alertmanager.yml \
  --storage.path=/opt/software/prometheus/alertmanager/data

Restart=always

[Install]
WantedBy=multi-user.target

EOF
加载自定义的systemctl配置
bash
systemctl daemon-reload3.3.7 启动AlertManager
bash
# 启动alertmanager
systemctl start alertmanager
# 开机自启动alertmanager
systemctl enable alertmanager
3.3.8 告警效果展示
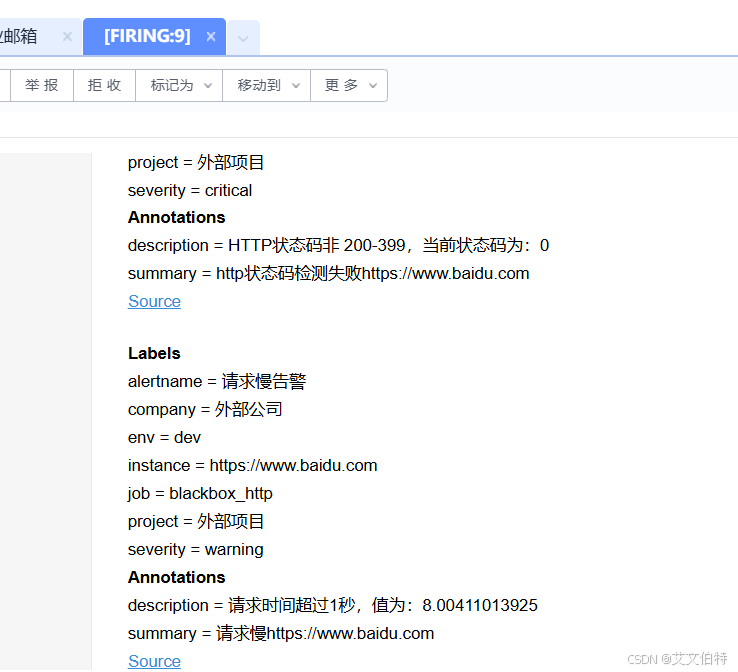
3.3.8.1 邮件告警效果展示
注:首先确保你的服务
默认使用的邮件告警模板如下 :

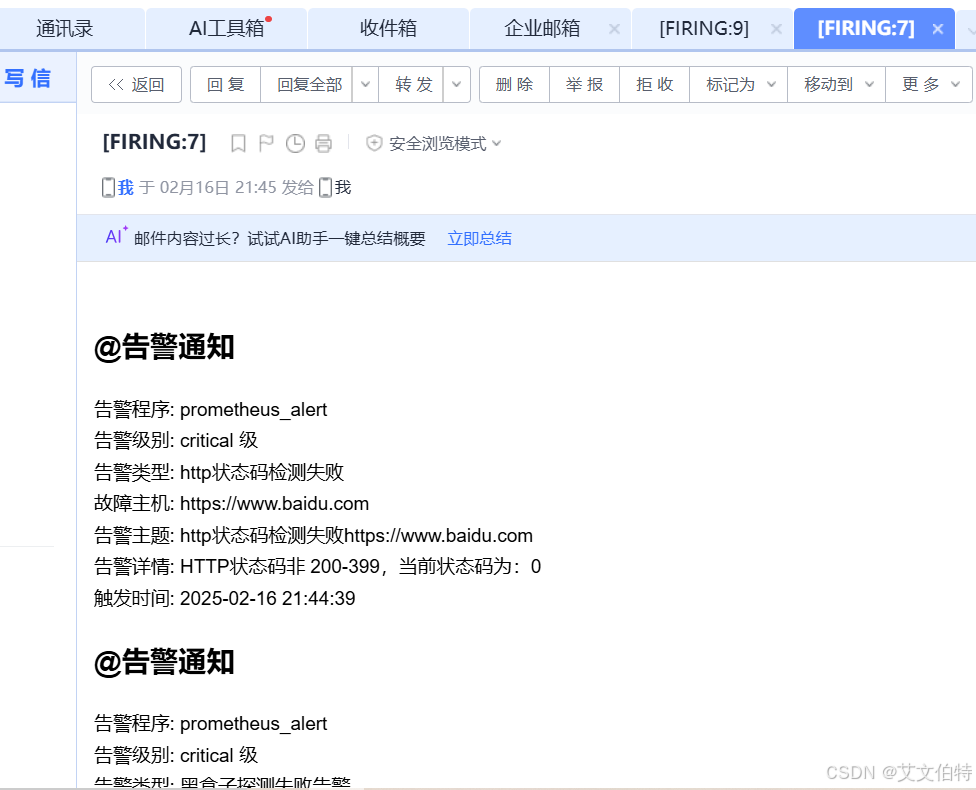
使用自定义的邮件告警模板后,效果如下 :
3.3.8.2 企业微信告警效果展示