import numpy as np
import pandas as pd
from sklearn.neighbors import NearestNeighbors
import matplotlib.pyplot as plt
from matplotlib.colors import get_named_colors_mapping
class ChargingPileMatcher:
def __init__(self, num_piles=20, lat_range=(30, 32), lon_range=(120, 122)):
self.num_piles = num_piles # 充电桩数量改为20
self.lat_range = lat_range
self.lon_range = lon_range
self.pile_coords = None
self.vehicle_coords = None
# 使用Matplotlib推荐的颜色映射方式(修复弃用警告)
self.colors = plt.colormaps['tab20'].colors[:num_piles] # 取前20种颜色
def generate_pile_locations(self, random_seed=42):
np.random.seed(random_seed)
lats = np.random.uniform(self.lat_range[0], self.lat_range[1], self.num_piles)
lons = np.random.uniform(self.lon_range[0], self.lon_range[1], self.num_piles)
self.pile_coords = np.column_stack((lats, lons))
return self.pile_coords
def generate_vehicle_data(self, num_vehicles=3000, random_seed=42):
np.random.seed(random_seed)
# 80%车辆集中在中心区域,20%分散在周边
main_lats = np.random.normal(loc=31, scale=0.2, size=int(num_vehicles * 0.8))
main_lons = np.random.normal(loc=121, scale=0.2, size=int(num_vehicles * 0.8))
sub_lats = np.random.uniform(self.lat_range[0], self.lat_range[1], int(num_vehicles * 0.2))
sub_lons = np.random.uniform(self.lon_range[0], self.lon_range[1], int(num_vehicles * 0.2))
lats = np.concatenate([main_lats, sub_lats])
lons = np.concatenate([main_lons, sub_lons])
self.vehicle_coords = np.column_stack((lats, lons))
return self.vehicle_coords
def match_nearest_pile(self):
if self.pile_coords is None or self.vehicle_coords is None:
raise ValueError("请先生成充电桩和车辆位置")
knn = NearestNeighbors(n_neighbors=1)
knn.fit(self.pile_coords)
distances, indices = knn.kneighbors(self.vehicle_coords)
self.match_results = {
'pile_index': indices.flatten(),
'distance': distances.flatten()
}
return self.match_results
def visualize_matching(self, show_pile_labels=False):
plt.figure(figsize=(12, 8))
# 绘制充电桩(大尺寸五星,颜色区分)
plt.scatter(
self.pile_coords[:, 1], self.pile_coords[:, 0], # 经度为X轴,纬度为Y轴
c=self.colors,
marker='*',
s=300,
label='充电桩',
edgecolor='black',
zorder=3
)
# 绘制车辆并按匹配充电桩染色(使用对应颜色,半透明显示)
for idx, (lat, lon) in enumerate(self.vehicle_coords):
pile_idx = self.match_results['pile_index'][idx]
plt.scatter(
lon, lat,
c=self.colors[pile_idx], # 直接使用对应索引颜色
alpha=0.3,
edgecolor='white',
s=20
)
# 显示前10个充电桩标签
if show_pile_labels and idx < 10:
plt.text(lon, lat, f'P{pile_idx}', fontsize=8, color='black', ha='right')
# 地理信息标注
plt.xlabel('经度 (°E)', fontsize=12)
plt.ylabel('纬度 (°N)', fontsize=12)
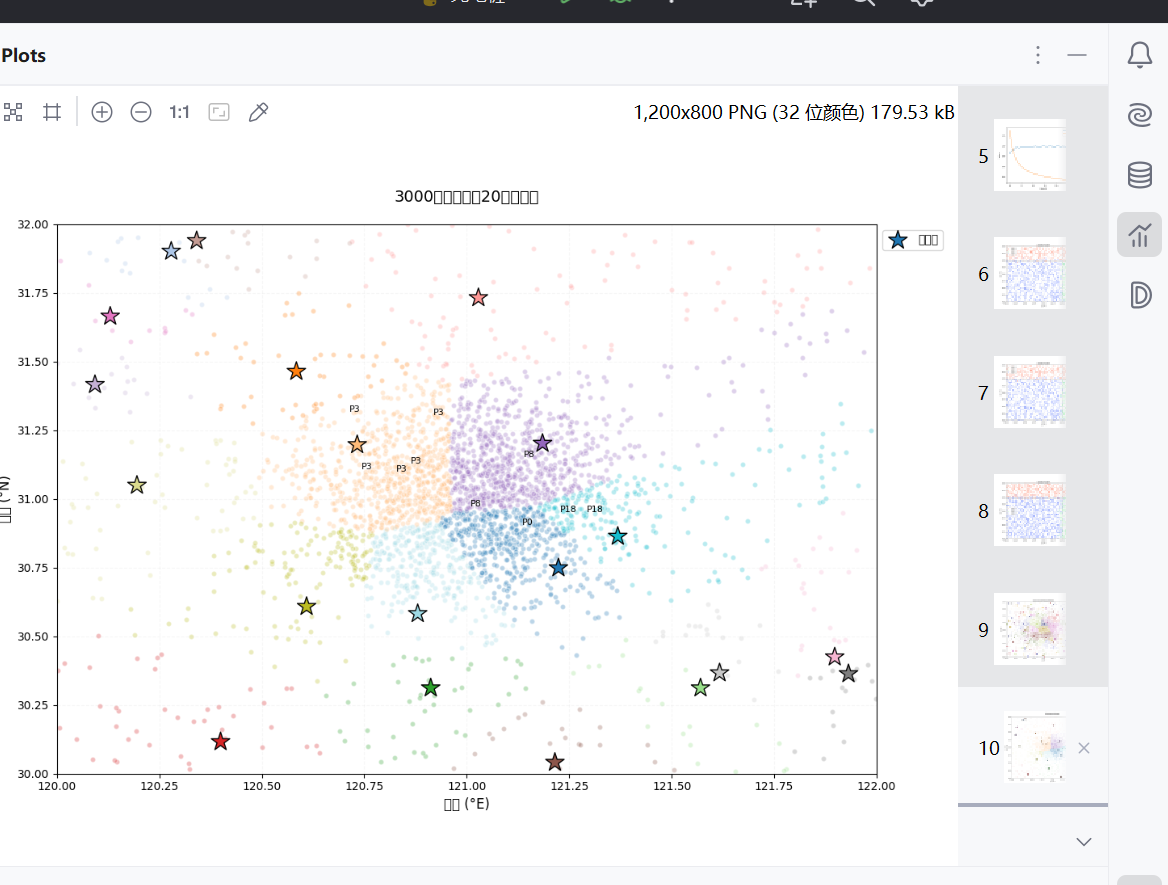
plt.title(f'3000辆汽车匹配{self.num_piles}个充电桩', fontsize=14, pad=20)
plt.xlim(self.lon_range)
plt.ylim(self.lat_range)
plt.grid(True, alpha=0.1, linestyle='--')
plt.legend(bbox_to_anchor=(1, 1), loc='upper left')
plt.tight_layout()
plt.show()
if __name__ == "__main__":
matcher = ChargingPileMatcher(num_piles=20) # 设置为20个充电桩
# 生成数据
matcher.generate_pile_locations()
matcher.generate_vehicle_data()
# 执行匹配
matcher.match_nearest_pile()
# 输出统计信息
avg_distance = np.mean(matcher.match_results['distance'])
print(f"平均匹配距离:{avg_distance:.2f} 度(约{avg_distance * 111:.0f}公里)")
# 可视化结果
matcher.visualize_matching(show_pile_labels=True)