卷积是将两个函数生成第三个函数。记这两个函数为 fff 和 ggg,则它们的卷积 f∗gf*gf∗g 定义为
若 fff 和 ggg 都是连续函数:
(f∗g)(t)=∫−∞+∞f(x)g(t−x)dx (f*g)(t)=\int_{-\infty}^{+\infty}f(x)g(t-x)dx (f∗g)(t)=∫−∞+∞f(x)g(t−x)dx
若 fff 和 ggg 都是离散函数:
(f∗g)(n)=∑k=−∞+∞f(k)g(n−k) (f*g)(n)=\sum_{k=-\infty}^{+\infty}f(k)g(n-k) (f∗g)(n)=k=−∞∑+∞f(k)g(n−k)
卷积的几何意义为:
- 将一个函数转化为它的镜像 (即 g(−t)g(-t)g(−t)),然后平移 (即 g(x−t)g(x-t)g(x−t)),与另外一个函数 fff 乘积,最后在定义域内积分
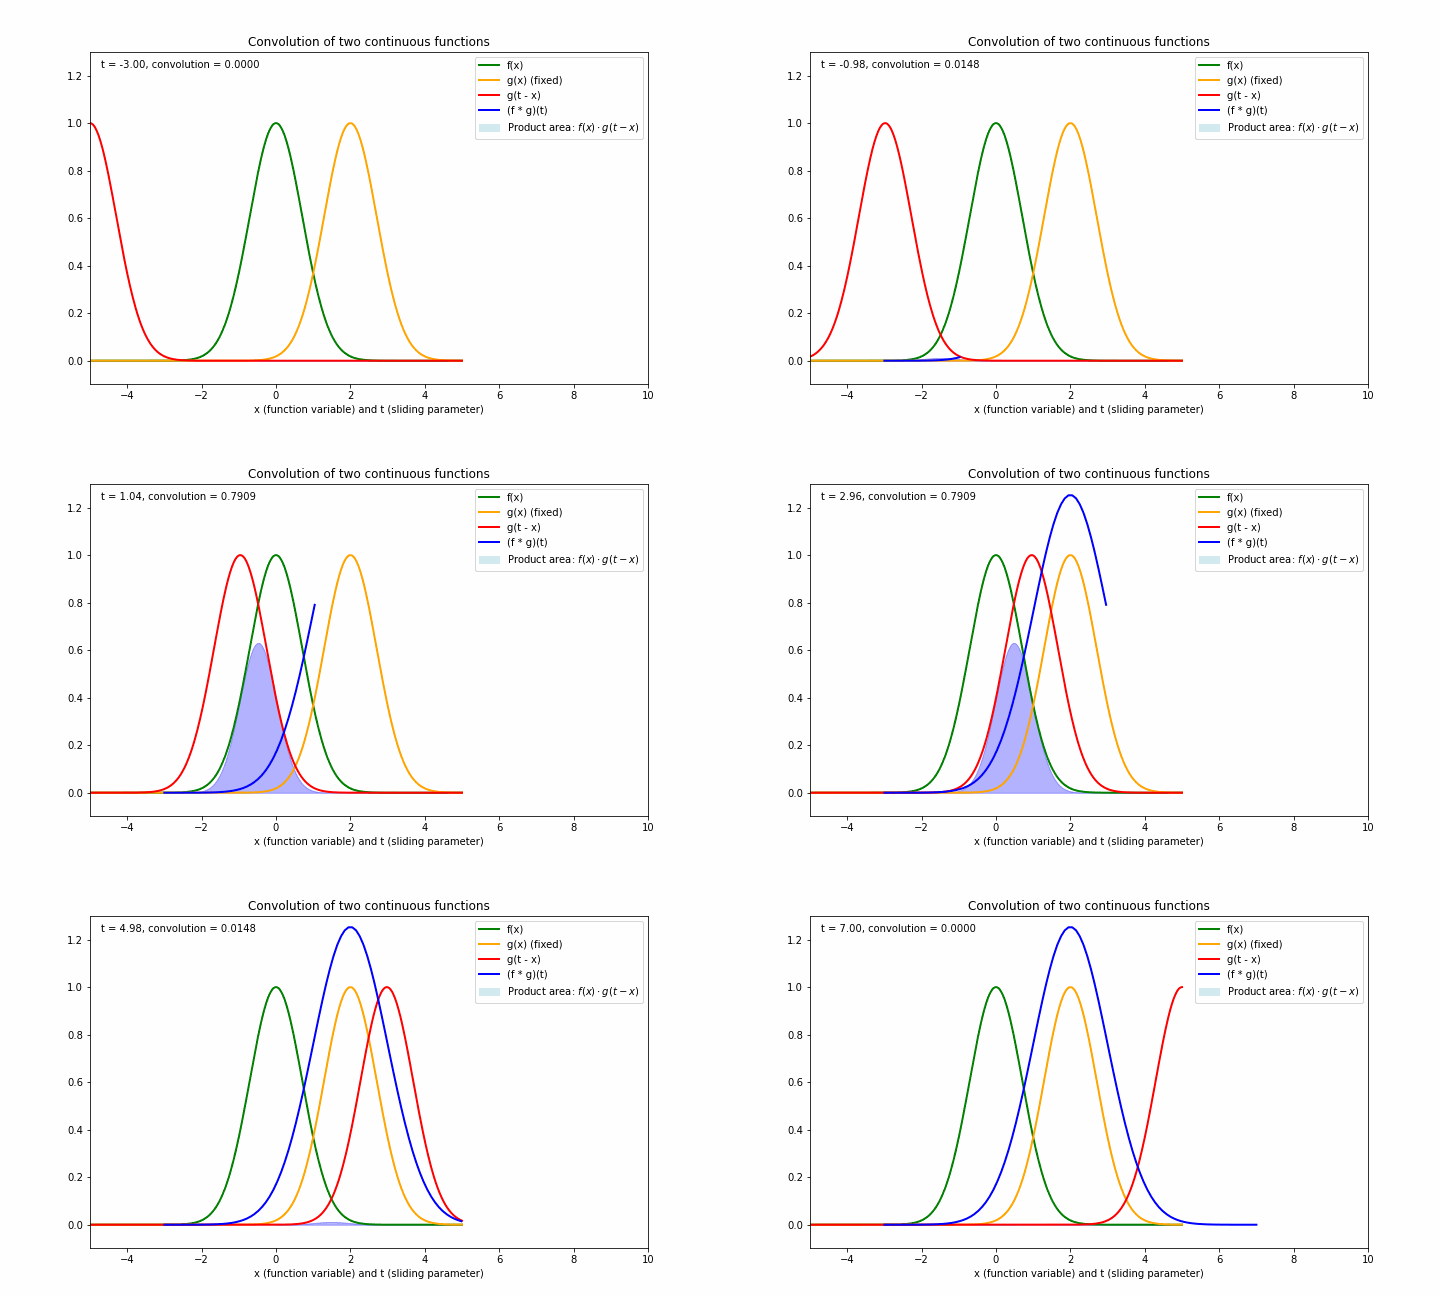
下面的图形展示了两个函数 f=e−x2f=e^{-x^2}f=e−x2 与 g=e−(x−2)2g=e^{-(x-2)^2}g=e−(x−2)2 生成卷积的过程:

其中:
- 绿色是第一个函数 fff
- 橙色是第二个函数 ggg
- 蓝色为两个函数的卷积函数
- 淡蓝色区域的面积为 ttt 固定一个值时,两个函数的卷积值,即 (f∗g)(t)(f*g)(t)(f∗g)(t)(因为固定 t 时,卷积值本质上是关于x的一个积分,所以对应的是面积)
- 这个横坐标轴根据所表示的函数的定义域,既可以表示 xxx ,也可以表示 ttt
让 AI 帮助生成的画图代码如下:
python
"""
@Python version : 3.12
@Author  : Zhen Chen
@Email   : chen.zhen5526@gmail.com
@Time    : 27/07/2025, 12:11
@Desc    :

"""
import numpy as np
import matplotlib.pyplot as plt
from matplotlib.animation import FuncAnimation
from scipy.integrate import simps


# 定义函数
def f(x):
    return np.exp(-x ** 2)


def g(x):
    return np.exp(-(x - 2) ** 2)


x = np.linspace(-5, 5, 400)
t_vals = np.linspace(-3, 7, 100)

fx = f(x)
gx = g(x)  # 原始g(x)

fig, ax = plt.subplots(figsize=(10, 6))
ax.set_xlim(-5, 10)
ax.set_ylim(-0.1, 1.3)
ax.set_xlabel('x / t')
ax.set_title('Convolution of two continuous functions')

line_f, = ax.plot(x, fx, 'g-', lw=2, label='f(x)')
line_g_fixed, = ax.plot(x, gx, 'orange', lw=2, label='g(x) (fixed)')
line_g_slide, = ax.plot([], [], 'r-', lw=2, label='g(t - x)')
line_conv, = ax.plot([], [], 'b-', lw=2, label='(f * g)(t)')

fill = ax.fill_between(x, 0, 0, color='b', alpha=0.3)
text = ax.text(0.02, 0.95, '', transform=ax.transAxes)

ax.legend(loc='upper right')

conv_x, conv_y = [], []


def init():
    global conv_x, conv_y, fill
    conv_x, conv_y = [], []  # 清空旧数据
    line_conv.set_data([], [])
    line_g_slide.set_data([], [])
    text.set_text('')
    if fill is not None:
        fill.remove()
        fill = ax.fill_between(x, 0, 0, color='b', alpha=0.3)  # 重设为透明
    return line_conv, line_g_slide, fill, text


def update(i):
    global fill, conv_x, conv_y
    t = t_vals[i]

    gx_slide = g(t - x)
    prod = fx * gx_slide
    conv_val = simps(prod, x)

    line_g_slide.set_data(x, gx_slide)

    if fill is not None:
        fill.remove()
    fill = ax.fill_between(x, 0, prod, color='b', alpha=0.3)

    conv_x.append(t)
    conv_y.append(conv_val)
    line_conv.set_data(conv_x, conv_y)

    text.set_text(f't = {t:.2f}, convolution = {conv_val:.4f}')

    return line_g_slide, fill, line_conv, text


import matplotlib.patches as mpatches

# 之前已有的图例句柄
handles, labels = ax.get_legend_handles_labels()

# 新增一个 Patch,代表填充区域
fill_patch = mpatches.Patch(color='lightblue', alpha=0.5, label=r'Product area: $f(x) \cdot g(t - x)$')

# 添加到图例句柄和标签中
handles.append(fill_patch)
labels.append(r'Product area: $f(x) \cdot g(t - x)$')

ax.legend(handles, labels, loc='upper right')
ax.set_xlabel('x (function variable) and t (sliding parameter)')

ani = FuncAnimation(fig, update, frames=len(t_vals), interval=100, blit=True, repeat=True, init_func=init)
# ani.save('convolution.gif', dpi=72)
plt.show()