目录
[1. 概述](#1. 概述)
[1.1 系统架构](#1.1 系统架构)
[1.1.1 架构图](#1.1.1 架构图)
[1.2 环境准备](#1.2 环境准备)
[2. 部署prometheus](#2. 部署prometheus)
[2.1 创建Namespace](#2.1 创建Namespace)
[2.2 创建ConfigMap资源](#2.2 创建ConfigMap资源)
[2.3 创建ServiceAccount,Clusterrole,Clusterrolebinding,Service,Deployment,ingress,persistentVolumeClaim](#2.3 创建ServiceAccount,Clusterrole,Clusterrolebinding,Service,Deployment,ingress,persistentVolumeClaim)
[3. 部署Node_exporter组件](#3. 部署Node_exporter组件)
[3.1 创建Daemonsets资源](#3.1 创建Daemonsets资源)
[4. 部署Kube_state_metrics组件](#4. 部署Kube_state_metrics组件)
[4.1 创建ServiceAccount,ClusterRole,ClusterRoleBinding,Deployment,Service](#4.1 创建ServiceAccount,ClusterRole,ClusterRoleBinding,Deployment,Service)
[5. 部署Grafana可视化平台](#5. 部署Grafana可视化平台)
[5.1 创建PersistentVolumeClaim,Deployment,Service](#5.1 创建PersistentVolumeClaim,Deployment,Service)
[6. 部署命令](#6. 部署命令)
[7. 访问服务](#7. 访问服务)
[8. grafana仪表盘展示](#8. grafana仪表盘展示)
[8.1 为grafana配置数据源](#8.1 为grafana配置数据源)
[8.2 导入仪表盘](#8.2 导入仪表盘)
[8.3 仪表盘展示](#8.3 仪表盘展示)
1. 概述
Prometheus是一个开源的监控和告警系统,特别适合云原生环境。本文将详细介绍如何在Kubernetes集群中部署一个完整的Prometheus监控系统,包括Prometheus Server、Node Exporter、Kube-state-metrics和Grafana等组件。
1.1 系统架构
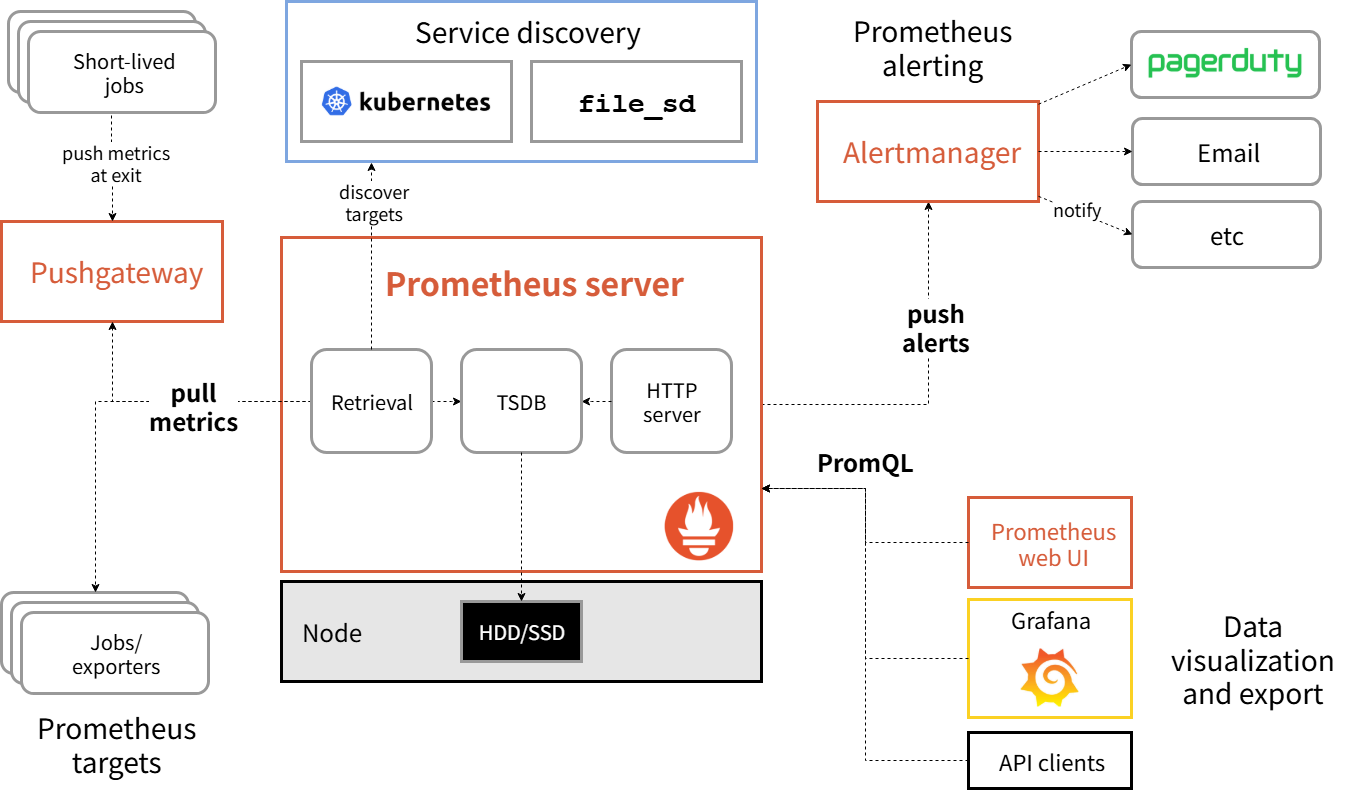
Prometheus监控系统包含以下组件:
-
Prometheus Server: 核心监控服务器,负责数据采集和存储
-
Node Exporter: 节点级指标收集器
-
Kube-state-metrics: Kubernetes集群状态指标收集器
-
Grafana: 数据可视化和仪表板
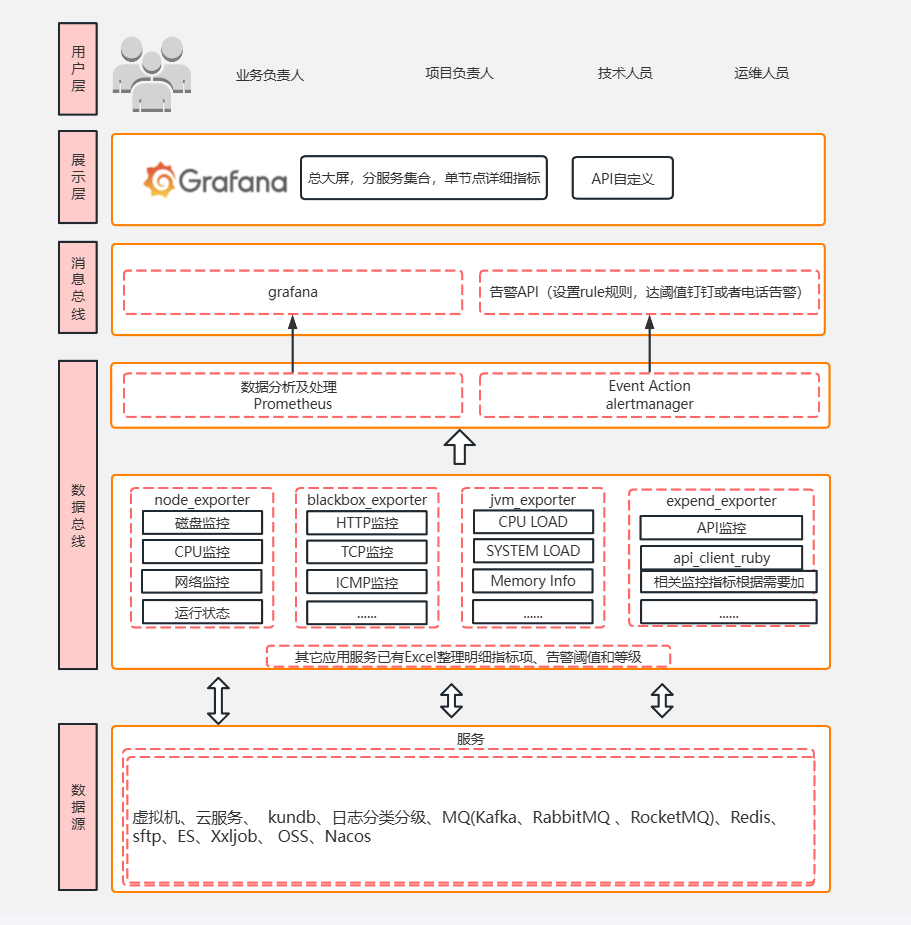
1.1.1 架构图
1.2 环境准备
| IP | 主机名 | 备注 |
|---|---|---|
| 192.168.48.11 | master1 | master节点,k8s1.32.7 |
| 192.168.48.12 | master2 | master节点,k8s1.32.7 |
| 192.168.48.13 | master3 | master节点,k8s1.32.7 |
| 192.168.48.14 | node01 | node节点,k8s1.32.7 |
| 192.168.48.15 | node02 | noder节点,k8s1.32.7 |
| 192.168.48.16 | node03 | node节点,k8s1.32.7 |
| 192.168.48.19 | database | harbor仓库,nfs服务器 |
本次使用k8s高可用集群,且部署均采用国内镜像,即使没有harbor仓库也能正常部署,如果镜像拉取超时,请在评论区留言,博主一定及时补。nfs服务器一定要有,如果其他存储方案如ceph,hostpath等自行更改yaml文件配置。
k8s搭建nfs共享存储参考往期博客:
k8s集群搭建参考往期博客:
openeuler24.03部署k8s1.32.7集群(一主两从)
k8s高可用集群搭建参考往期博客:
openeuler24.03部署k8s1.32.7高可用集群(三主三从)
2. 部署prometheus
2.1 创建Namespace
vim prometheus-namespace.yamlapiVersion: v1
kind: Namespace
metadata:
name: monitor
labels:
name: monitor
purpose: monitoring2.2 创建ConfigMap资源
vim prometheus-configmap.yamlapiVersion: v1
kind: ConfigMap
metadata:
name: prometheus-config
namespace: monitor
data:
prometheus.yml: |
global:
scrape_interval: 15s
evaluation_interval: 15s
scrape_configs:
# 采集 Prometheus 自身
- job_name: 'prometheus'
kubernetes_sd_configs:
- role: endpoints
namespaces:
names: [monitor]
relabel_configs:
- source_labels: [__meta_kubernetes_service_name]
regex: prometheus-svc
action: keep
- source_labels: [__meta_kubernetes_endpoint_port_name]
regex: web
action: keep
# 采集 CoreDNS
- job_name: 'coredns'
kubernetes_sd_configs:
- role: endpoints
namespaces:
names: [kube-system]
relabel_configs:
- source_labels: [__meta_kubernetes_service_name]
regex: kube-dns
action: keep
- source_labels: [__meta_kubernetes_endpoint_port_name]
regex: metrics
action: keep
# 采集 kube-apiserver
- job_name: 'kube-apiserver'
scheme: https
tls_config:
ca_file: /var/run/secrets/kubernetes.io/serviceaccount/ca.crt
insecure_skip_verify: false
bearer_token_file: /var/run/secrets/kubernetes.io/serviceaccount/token
kubernetes_sd_configs:
- role: endpoints
namespaces:
names: [default, kube-system]
relabel_configs:
- source_labels: [__meta_kubernetes_service_name]
regex: kubernetes
action: keep
- source_labels: [__meta_kubernetes_endpoint_port_name]
regex: https
action: keep
# 采集 node-exporter
- job_name: 'node-exporter'
kubernetes_sd_configs:
- role: node
relabel_configs:
- source_labels: [__address__]
regex: '(.*):10250'
replacement: '${1}:9100'
target_label: __address__
action: replace
# 采集 cadvisor
- job_name: 'cadvisor'
kubernetes_sd_configs:
- role: node
scheme: https
tls_config:
insecure_skip_verify: true
ca_file: '/var/run/secrets/kubernetes.io/serviceaccount/ca.crt'
bearer_token_file: '/var/run/secrets/kubernetes.io/serviceaccount/token'
relabel_configs:
- target_label: __metrics_path__
replacement: /metrics/cadvisor2.3 创建ServiceAccount,Clusterrole,Clusterrolebinding,Service,Deployment,ingress,persistentVolumeClaim
vim prometheus.yaml#创建SA
apiVersion: v1
kind: ServiceAccount
metadata:
name: prometheus
namespace: monitor
---
#创建clusterrole
apiVersion: rbac.authorization.k8s.io/v1
kind: ClusterRole
metadata:
name: prometheus
rules:
- apiGroups:
- ""
resources:
- nodes
- services
- endpoints
- pods
- nodes/proxy
- nodes/proxy
verbs:
- get
- list
- watch
- apiGroups:
- "extenstions"
resources:
- ingresses
verbs:
- get
- list
- watch
- apiGroups:
- ""
resources:
- configmaps
- nodes/metrics
verbs:
- get
- nonResourceURLs:
- /metrics
verbs:
- get
---
#创建clusterrolebinding
apiVersion: rbac.authorization.k8s.io/v1
kind: ClusterRoleBinding
metadata:
name: prometheus
roleRef:
apiGroup: rbac.authorization.k8s.io
kind: ClusterRole
name: prometheus
subjects:
- kind: ServiceAccount
name: prometheus
namespace: monitor
---
#创建svc
apiVersion: v1
kind: Service
metadata:
name: prometheus-svc
namespace: monitor
labels:
app: prometheus
annotations:
prometheus_io_scrape: "true" # 注解,有这个才可以被Prometheus发现
spec:
selector:
app: prometheus
type: NodePort
ports:
- name: web
nodePort: 32224
port: 9090
targetPort: http
---
#创建ingress
apiVersion: networking.k8s.io/v1
kind: Ingress
metadata:
name: prometheus-ingress
namespace: monitor
spec:
ingressClassName: nginx
rules:
- host: www.myprometheus.com
http:
paths:
- path: /
pathType: Prefix
backend:
service:
name: prometheus-svc
port:
number: 9090
---
apiVersion: v1
kind: PersistentVolumeClaim
metadata:
name: prometheus-pvc # PVC 名称
namespace: monitor
spec:
accessModes:
- ReadWriteOnce # 访问模式(可选:ReadWriteOnce/ReadOnlyMany/ReadWriteMany)
resources:
requests:
storage: 2Gi # 请求的存储容量
storageClassName: nfs-client # 指定 StorageClass(根据集群环境调整)
---
#创建deployment
apiVersion: apps/v1
kind: Deployment
metadata:
name: prometheus
namespace: monitor
labels:
app: prometheus
spec:
selector:
matchLabels:
app: prometheus
replicas: 1
template:
metadata:
labels:
app: prometheus
spec:
serviceAccountName: prometheus
initContainers:
- name: "change-permission-of-directory"
image: swr.cn-north-4.myhuaweicloud.com/ddn-k8s/quay.io/prometheus/busybox:latest
command: ["/bin/sh"]
args: ["-c","chown -R 65534:65534 /prometheus"]
securityContext:
privileged: true
volumeMounts:
- mountPath: "/etc/prometheus"
name: config-volume
- mountPath: "/prometheus"
name: data
containers:
- image: swr.cn-north-4.myhuaweicloud.com/ddn-k8s/docker.io/prom/prometheus:latest
name: prometheus
args:
- "--config.file=/etc/prometheus/prometheus.yml"#指定prometheus配置文件路径
- "--storage.tsdb.path=/prometheus"#指定tsdb数据库存储路径
- "--web.enable-lifecycle"#允许热更新,curl localhost:9090/-/reload 进行热更新
- "--web.console.libraries=/usr/share/prometheus/console_libraries"
- "--web.console.templates=/usr/share/prometheus/consoles"
ports:
- containerPort: 9090
name: http
volumeMounts:
- mountPath: "/etc/prometheus"
name: config-volume
- mountPath: "/prometheus"
name: data
resources:
requests:
cpu: 100m
memory: 512Mi
limits:
cpu: 100m
memory: 512Mi
volumes:
- name: data
persistentVolumeClaim:
claimName: prometheus-pvc
- configMap:
name: prometheus-config
name: config-volume
3. 部署Node_exporter组件
3.1 创建Daemonsets资源
vim node-exportet-daemonset.yamlapiVersion: apps/v1
kind: DaemonSet
metadata:
name: node-exporter
namespace: monitor
labels:
app: node-exporter
spec:
selector:
matchLabels:
app: node-exporter
template:
metadata:
labels:
app: node-exporter
spec:
hostPID: true
hostIPC: true
hostNetwork: true
nodeSelector:
kubernetes.io/os: linux
containers:
- name: node-exporter
image: docker.io/prom/node-exporter:latest
args:
- --web.listen-address=$(HOSTIP):9100
- --path.procfs=/host/proc
- --path.sysfs=/host/sys
- --path.rootfs=/host/root
- --collector.filesystem.ignored-mount-points=^/(dev|proc|sys|var/lib/docker/.+)($|/)
- --collector.filesystem.ignored-fs-types=^(autofs|binfmt_misc|cgroup|configfs|debugfs|devpts|devtmpfs|fusectl|hugetlbfs|mqueue|overlay|proc|procfs|pstore|rpc_pipefs|securityfs|sysfs|tracefs)$
ports:
- containerPort: 9100
env:
- name: HOSTIP
valueFrom:
fieldRef:
fieldPath: status.hostIP
resources:
requests:
cpu: 150m
memory: 180Mi
limits:
cpu: 150m
memory: 180Mi
securityContext:
runAsNonRoot: true
runAsUser: 65534
volumeMounts:
- name: proc
mountPath: /host/proc
- name: sys
mountPath: /host/sys
- name: root
mountPath: /host/root
mountPropagation: HostToContainer
readOnly: true
tolerations:
- operator: "Exists"
volumes:
- name: proc
hostPath:
path: /proc
- name: dev
hostPath:
path: /dev
- name: sys
hostPath:
path: /sys
- name: root
hostPath:
path: /
创建Service
vim node-exportet-svc.yamlapiVersion: v1
kind: Service
metadata:
name: node-exporter
namespace: monitor
labels:
app: node-exporter
spec:
selector:
app: node-exporter
ports:
- name: metrics
port: 9100
targetPort: 9100
clusterIP: None # Headless Service(直接通过 Pod IP 访问)4. 部署Kube_state_metrics组件
4.1 创建ServiceAccount,ClusterRole,ClusterRoleBinding,Deployment,Service
kube-state-metrics.yaml---
apiVersion: v1
kind: ServiceAccount
metadata:
name: kube-state-metrics
namespace: monitor
---
apiVersion: rbac.authorization.k8s.io/v1
kind: ClusterRole
metadata:
name: kube-state-metrics
rules:
- apiGroups: [""]
resources: ["nodes", "pods", "services", "resourcequotas", "replicationcontrollers", "limitranges", "persistentvolumeclaims", "persistentvolumes", "namespaces", "endpoints"]
verbs: ["list", "watch"]
- apiGroups: ["extensions"]
resources: ["daemonsets", "deployments", "replicasets"]
verbs: ["list", "watch"]
- apiGroups: ["apps"]
resources: ["statefulsets"]
verbs: ["list", "watch"]
- apiGroups: ["batch"]
resources: ["cronjobs", "jobs"]
verbs: ["list", "watch"]
- apiGroups: ["autoscaling"]
resources: ["horizontalpodautoscalers"]
verbs: ["list", "watch"]
- apiGroups: ["networking.k8s.io"]
resources: ["ingresses"]
verbs: ["list", "watch"]
---
apiVersion: rbac.authorization.k8s.io/v1
kind: ClusterRoleBinding
metadata:
name: kube-state-metrics
roleRef:
apiGroup: rbac.authorization.k8s.io
kind: ClusterRole
name: kube-state-metrics
subjects:
- kind: ServiceAccount
name: kube-state-metrics
namespace: monitor
---
apiVersion: apps/v1
kind: Deployment
metadata:
name: kube-state-metrics
namespace: monitor
spec:
replicas: 1
selector:
matchLabels:
app: kube-state-metrics
template:
metadata:
labels:
app: kube-state-metrics
spec:
serviceAccountName: kube-state-metrics
containers:
- name: kube-state-metrics
image: swr.cn-north-4.myhuaweicloud.com/ddn-k8s/registry.k8s.io/kube-state-metrics/kube-state-metrics:v2.9.2
imagePullPolicy: IfNotPresent
ports:
- containerPort: 8080
---
apiVersion: v1
kind: Service
metadata:
annotations:
prometheus.io/scrape: 'true'
name: kube-state-metrics
namespace: monitor
labels:
app: kube-state-metrics
spec:
ports:
- name: kube-state-metrics
port: 8080
protocol: TCP
selector:
app: kube-state-metrics5. 部署Grafana可视化平台
5.1 创建PersistentVolumeClaim,Deployment,Service
vim grafana.yaml---
apiVersion: v1
kind: PersistentVolumeClaim
metadata:
name: grafana-pvc # PVC 名称
namespace: monitor
spec:
accessModes:
- ReadWriteOnce # 访问模式(可选:ReadWriteOnce/ReadOnlyMany/ReadWriteMany)
resources:
requests:
storage: 2Gi # 请求的存储容量
storageClassName: nfs-client # 指定 StorageClass(根据集群环境调整)
---
apiVersion: apps/v1
kind: Deployment
metadata:
name: grafana-server
namespace: monitor
spec:
replicas: 1
selector:
matchLabels:
task: monitoring
k8s-app: grafana
template:
metadata:
labels:
task: monitoring
k8s-app: grafana
spec:
containers:
- name: grafana
image: grafana/grafana:latest
imagePullPolicy: IfNotPresent
ports:
- containerPort: 3000
protocol: TCP
volumeMounts:
- mountPath: /var/lib/grafana/
name: grafana-data
env:
- name: INFLUXDB_HOST
value: monitoring-influxdb
- name: GF_SERVER_HTTP_PORT
value: "3000"
- name: GF_AUTH_BASIC_ENABLED
value: "false"
- name: GF_AUTH_ANONYMOUS_ENABLED
value: "true"
- name: GF_AUTH_ANONYMOUS_ORG_ROLE
value: Admin
- name: GF_SERVER_ROOT_URL
value: /
volumes:
- name: grafana-data
persistentVolumeClaim:
claimName: grafana-pvc
affinity: # 调度优化(可选)
nodeAffinity:
preferredDuringSchedulingIgnoredDuringExecution:
- weight: 1
preference:
matchExpressions:
- key: node-role.kubernetes.io/monitoring
operator: Exists
---
apiVersion: v1
kind: Service
metadata:
labels:
kubernetes.io/cluster-service: 'true'
kubernetes.io/name: monitoring-grafana
name: grafana-svc
namespace: monitor
spec:
ports:
- port: 80
targetPort: 3000
nodePort: 31091
selector:
k8s-app: grafana
type: NodePort6. 部署命令
按照以下顺序部署各个组件:
# 1. 创建命名空间
kubectl apply -f prometheus-namespace.yaml
# 2. 部署Prometheus配置
kubectl apply -f prometheus-configmap.yaml
# 3. 部署Prometheus主服务
kubectl apply -f prometheus.yaml
# 4. 部署Kube-state-metrics
kubectl apply -f kube-state-metrics.yaml
# 5. 部署Node Exporter
kubectl apply -f node-exportet-daemonset.yaml
kubectl apply -f node-exportet-svc.yaml
# 6. 部署Grafana
kubectl apply -f grafana.yaml检查pod状态:
[root@master1 prometheus]# kubectl get pod -n monitor
NAME                                 READY   STATUS    RESTARTS   AGE
grafana-server-64c9777c7b-drgdd      1/1     Running   0          110m
kube-state-metrics-6db447664-6r2wp   1/1     Running   0          110m
node-exporter-ccwk8                  1/1     Running   0          110m
node-exporter-fbq22                  1/1     Running   0          110m
node-exporter-hbtm6                  1/1     Running   0          110m
node-exporter-ndbhh                  1/1     Running   0          110m
node-exporter-sbb4p                  1/1     Running   0          110m
node-exporter-xd467                  1/1     Running   0          110m
prometheus-7cd9944dc4-lbjwx          1/1     Running   0          110m
7. 访问服务
部署完成后,可以通过以下方式访问服务:
-
Prometheus :
http://<node-ip>:32224或http://www.myprometheus.com(需要配置域名解析) -
Grafana :
http://<node-ip>:31091
前排提示:192.168.48.10是我的k8s集群高可用的vip,如果不是高可用,输入Pod所在的主机IP即可。
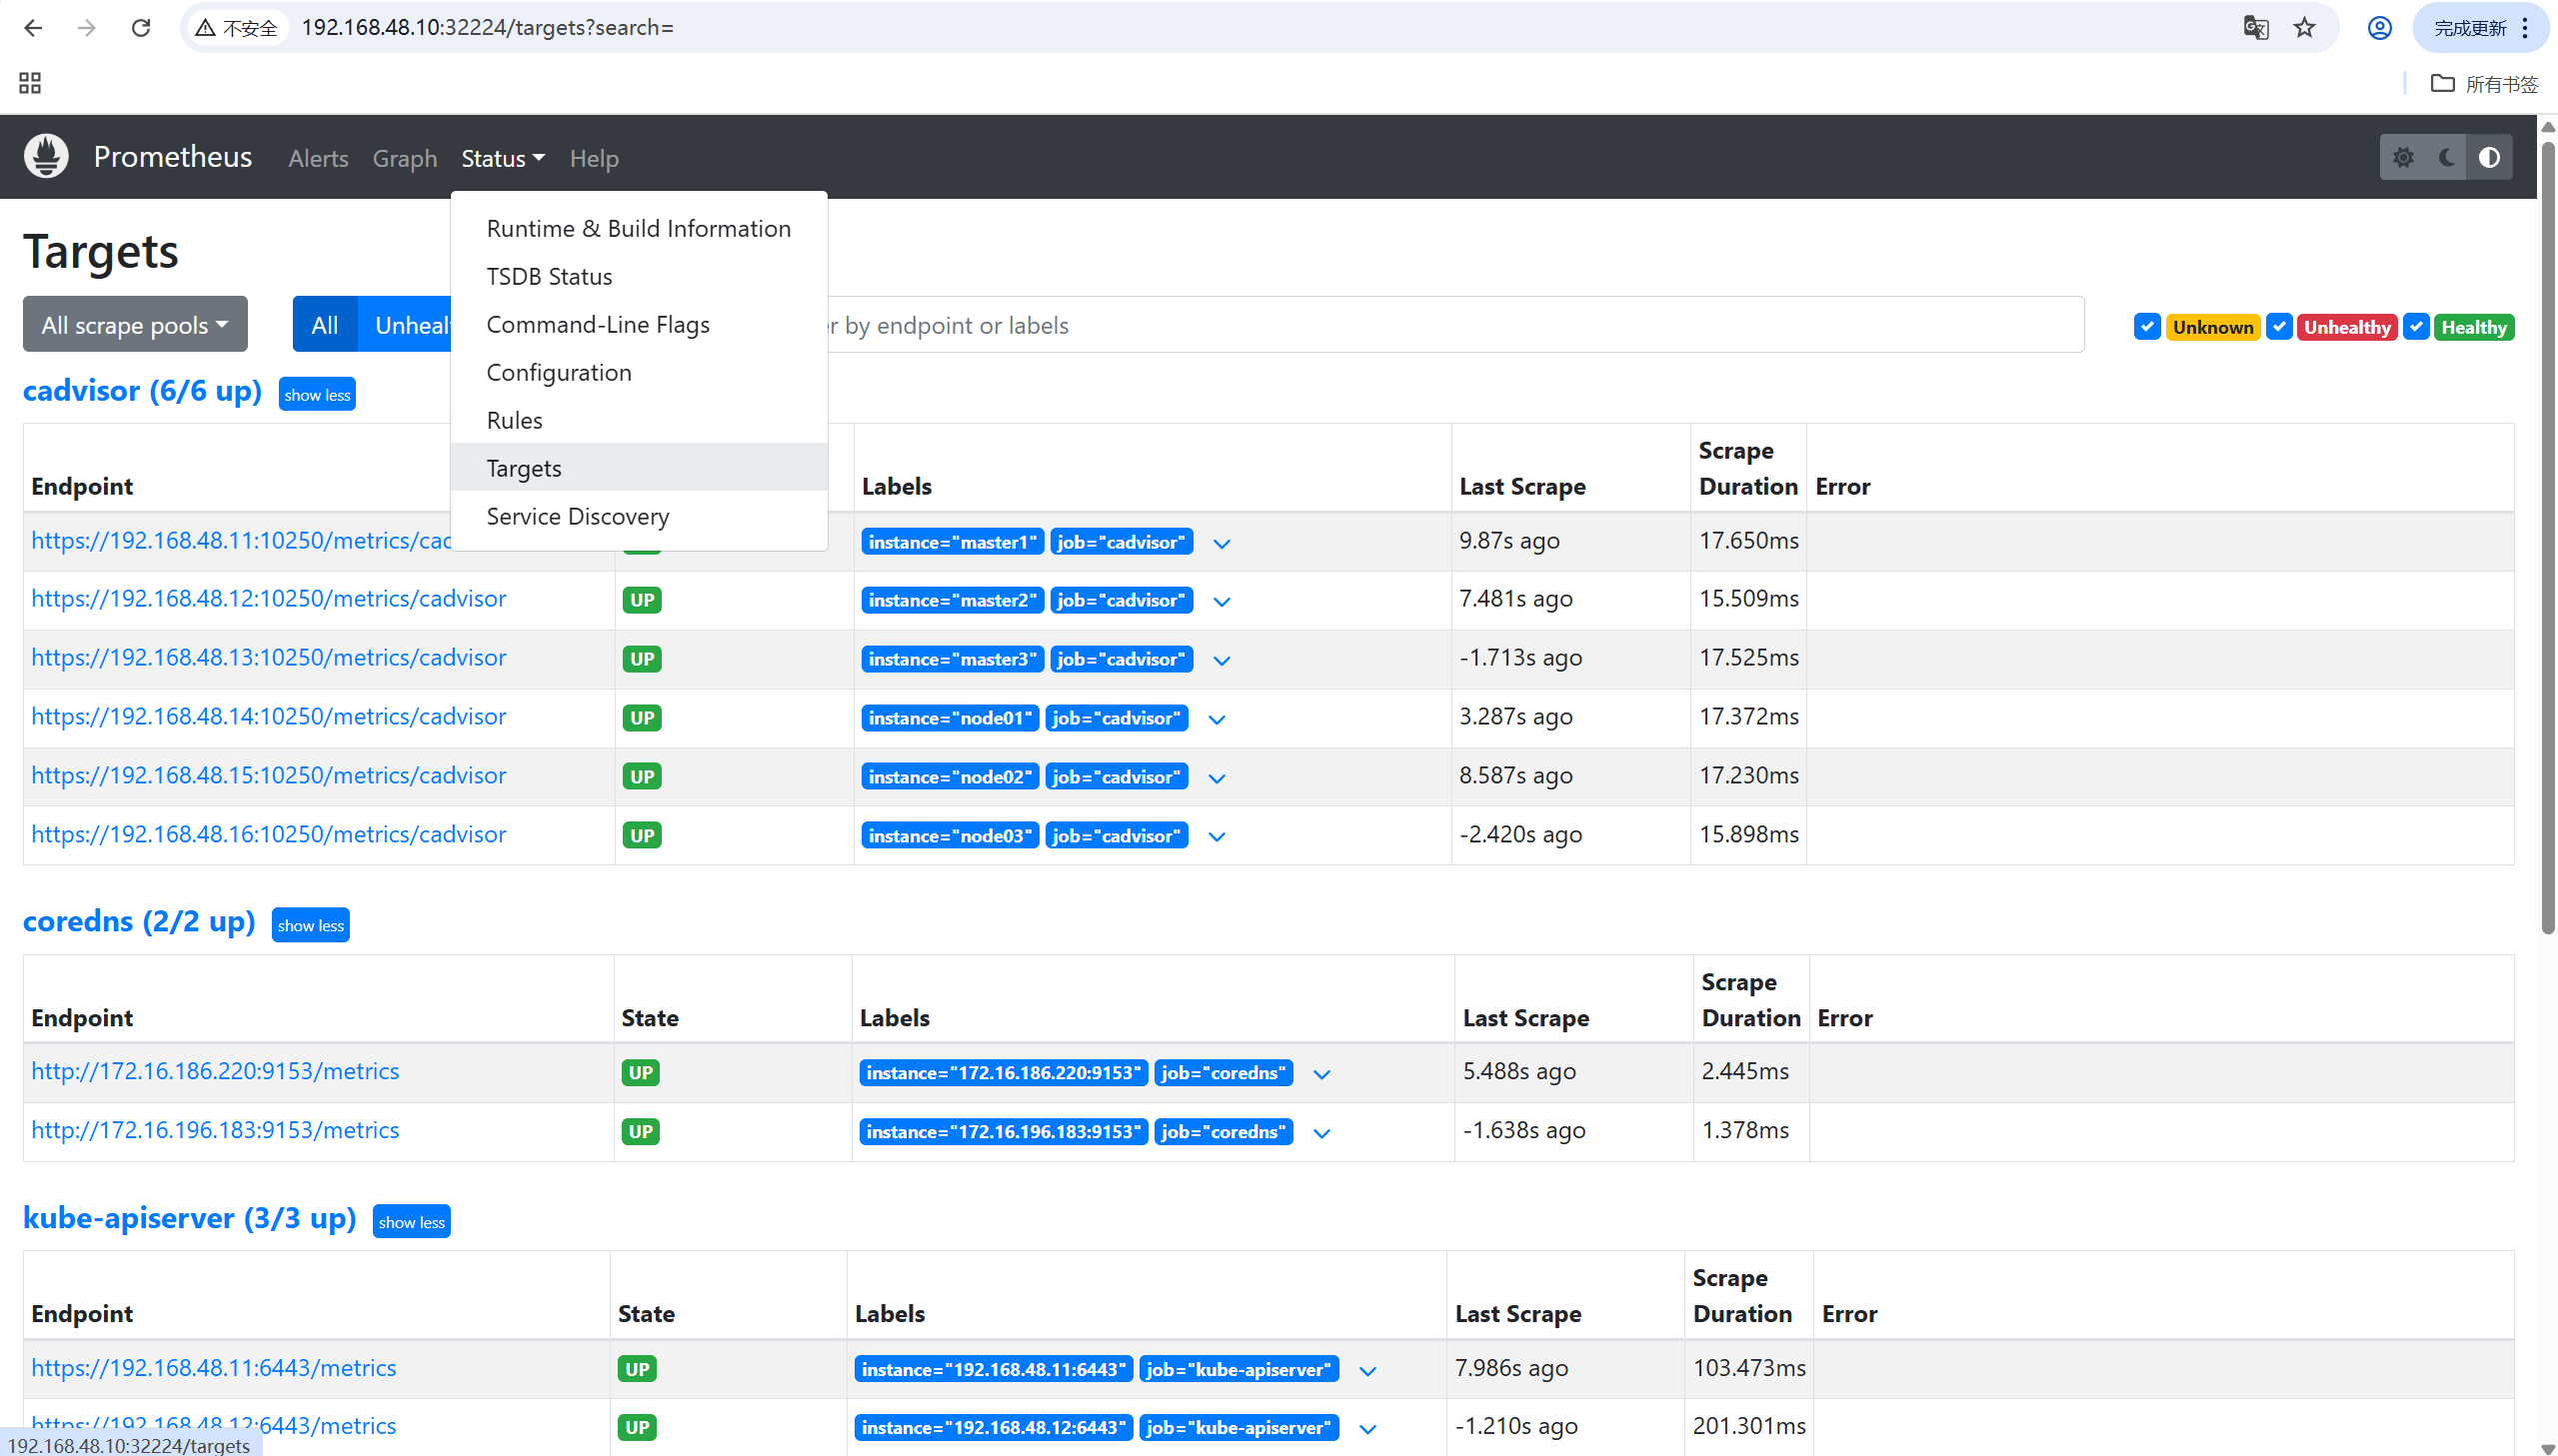
访问Prometheus:http://192.168.48.10:32224
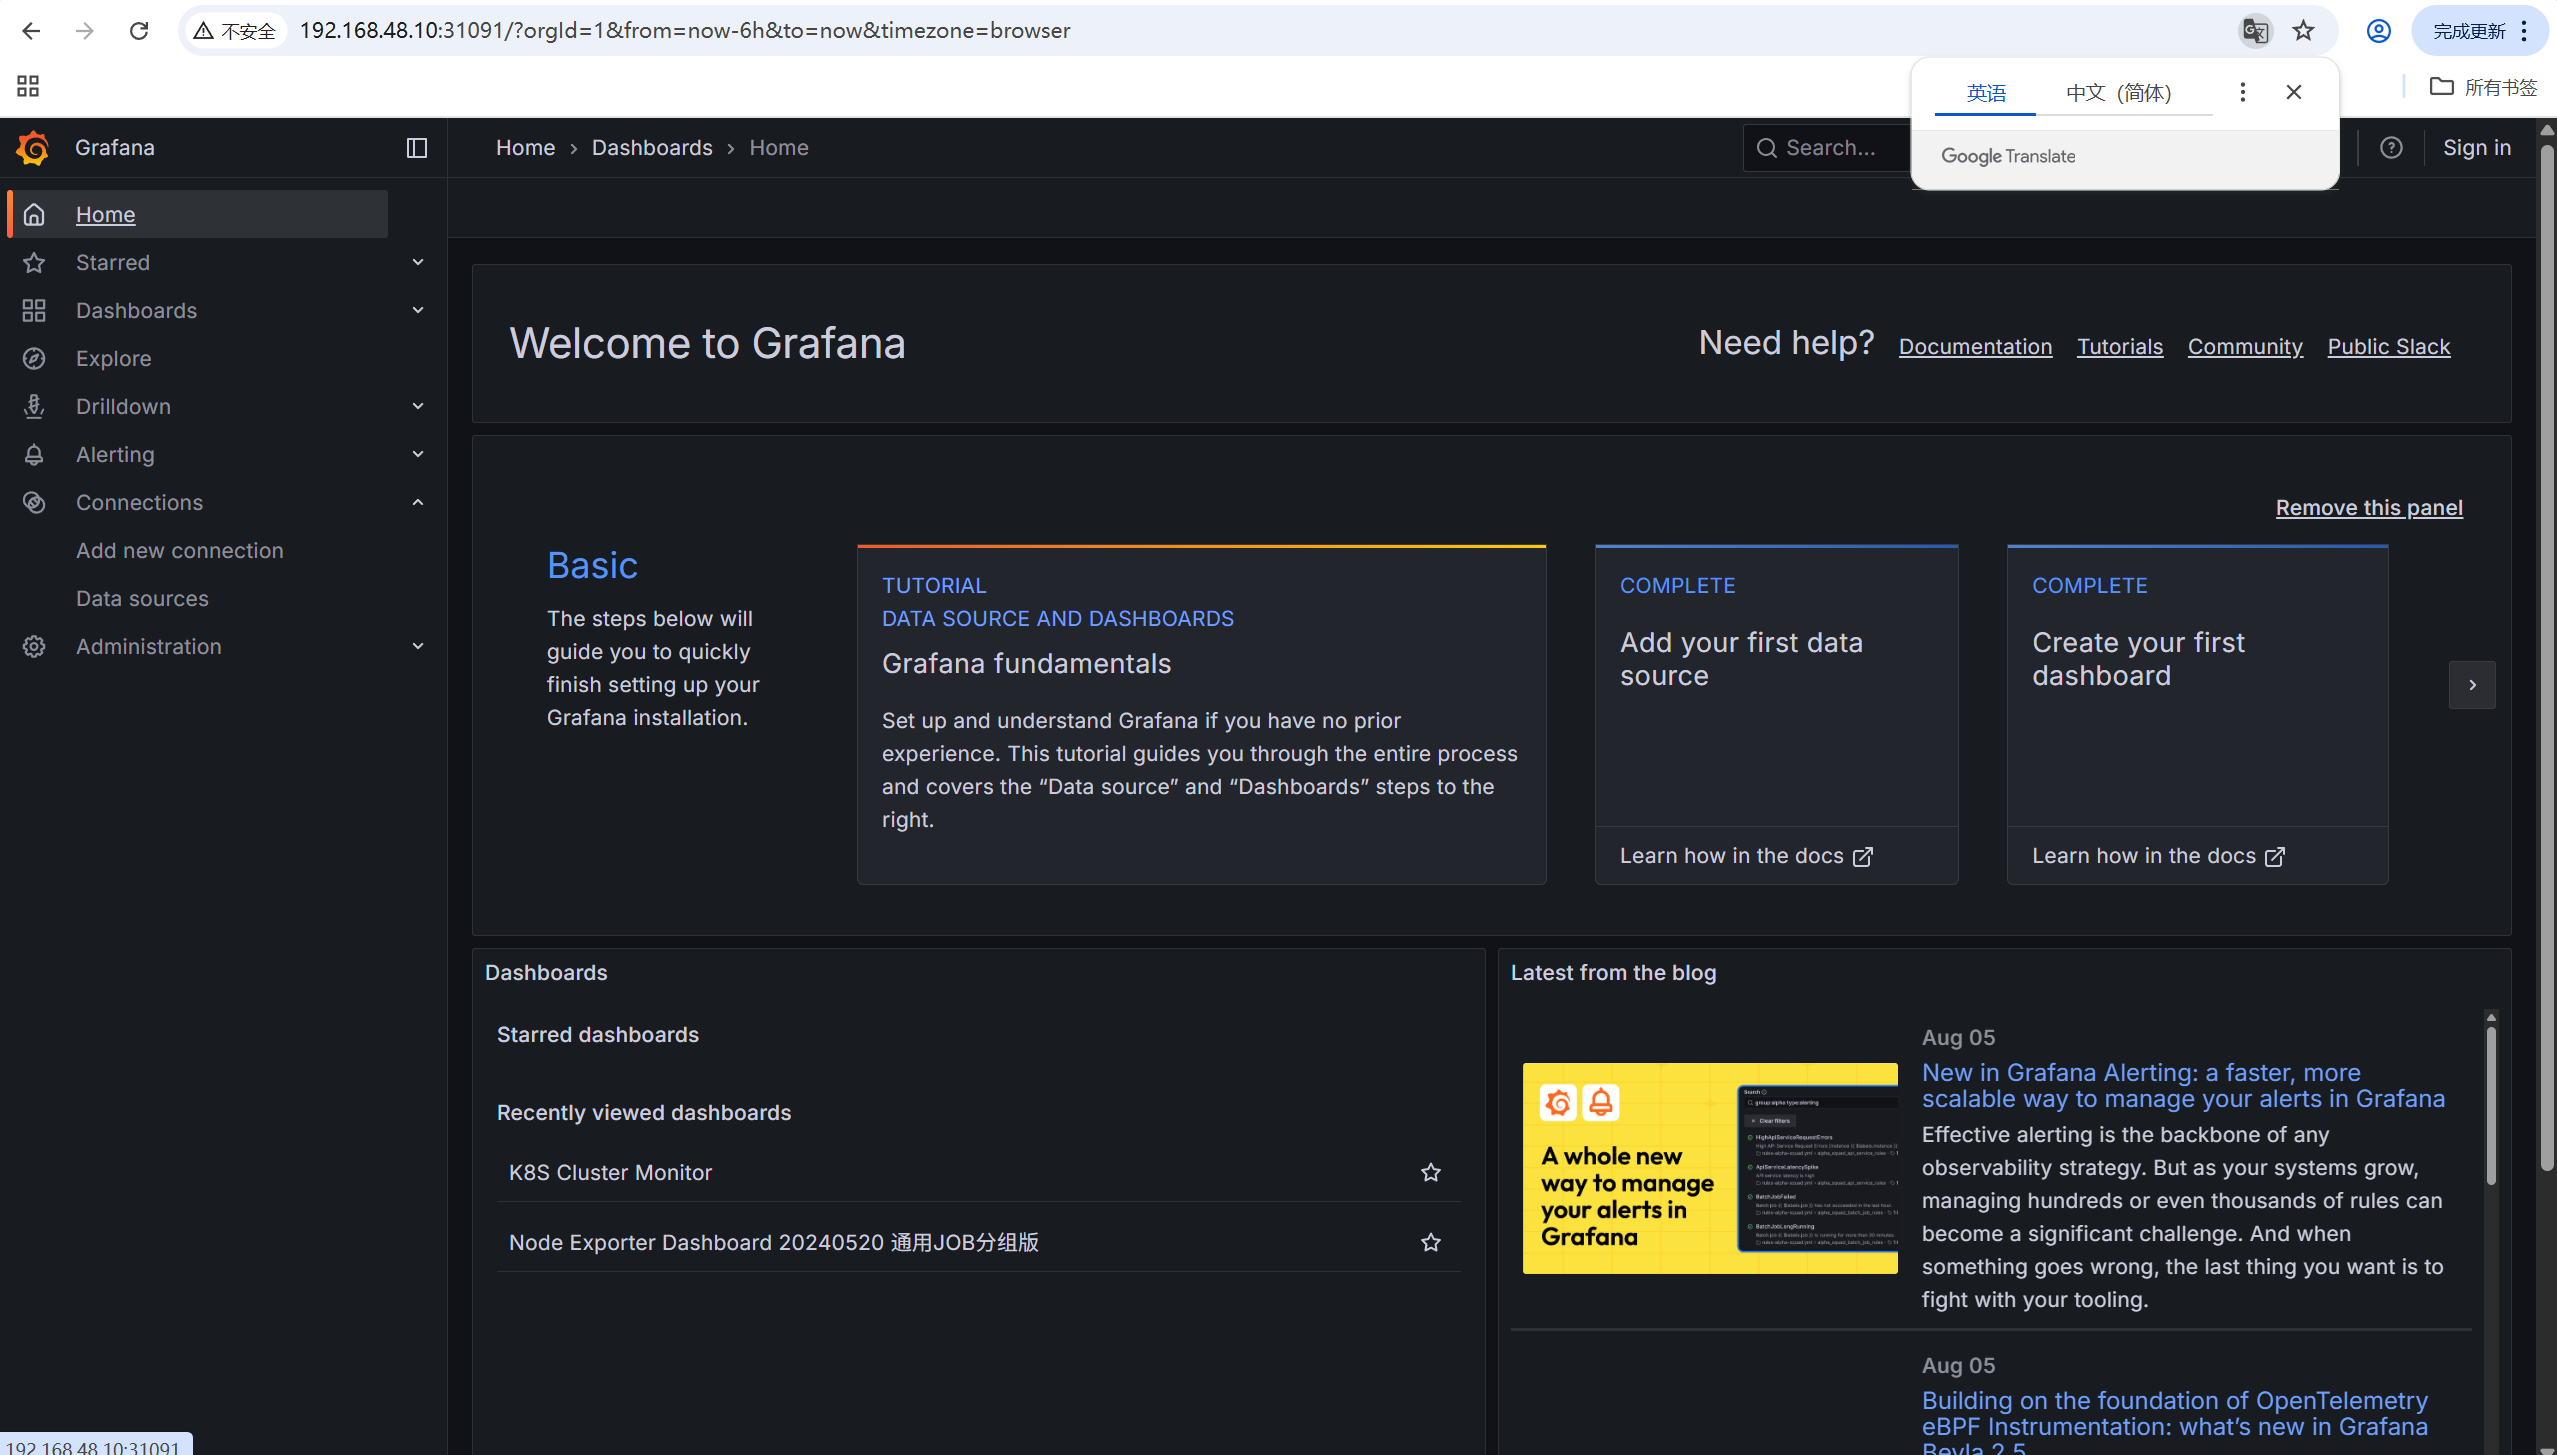
访问grafana:http://192.168.48.10:31091/
8. grafana仪表盘展示
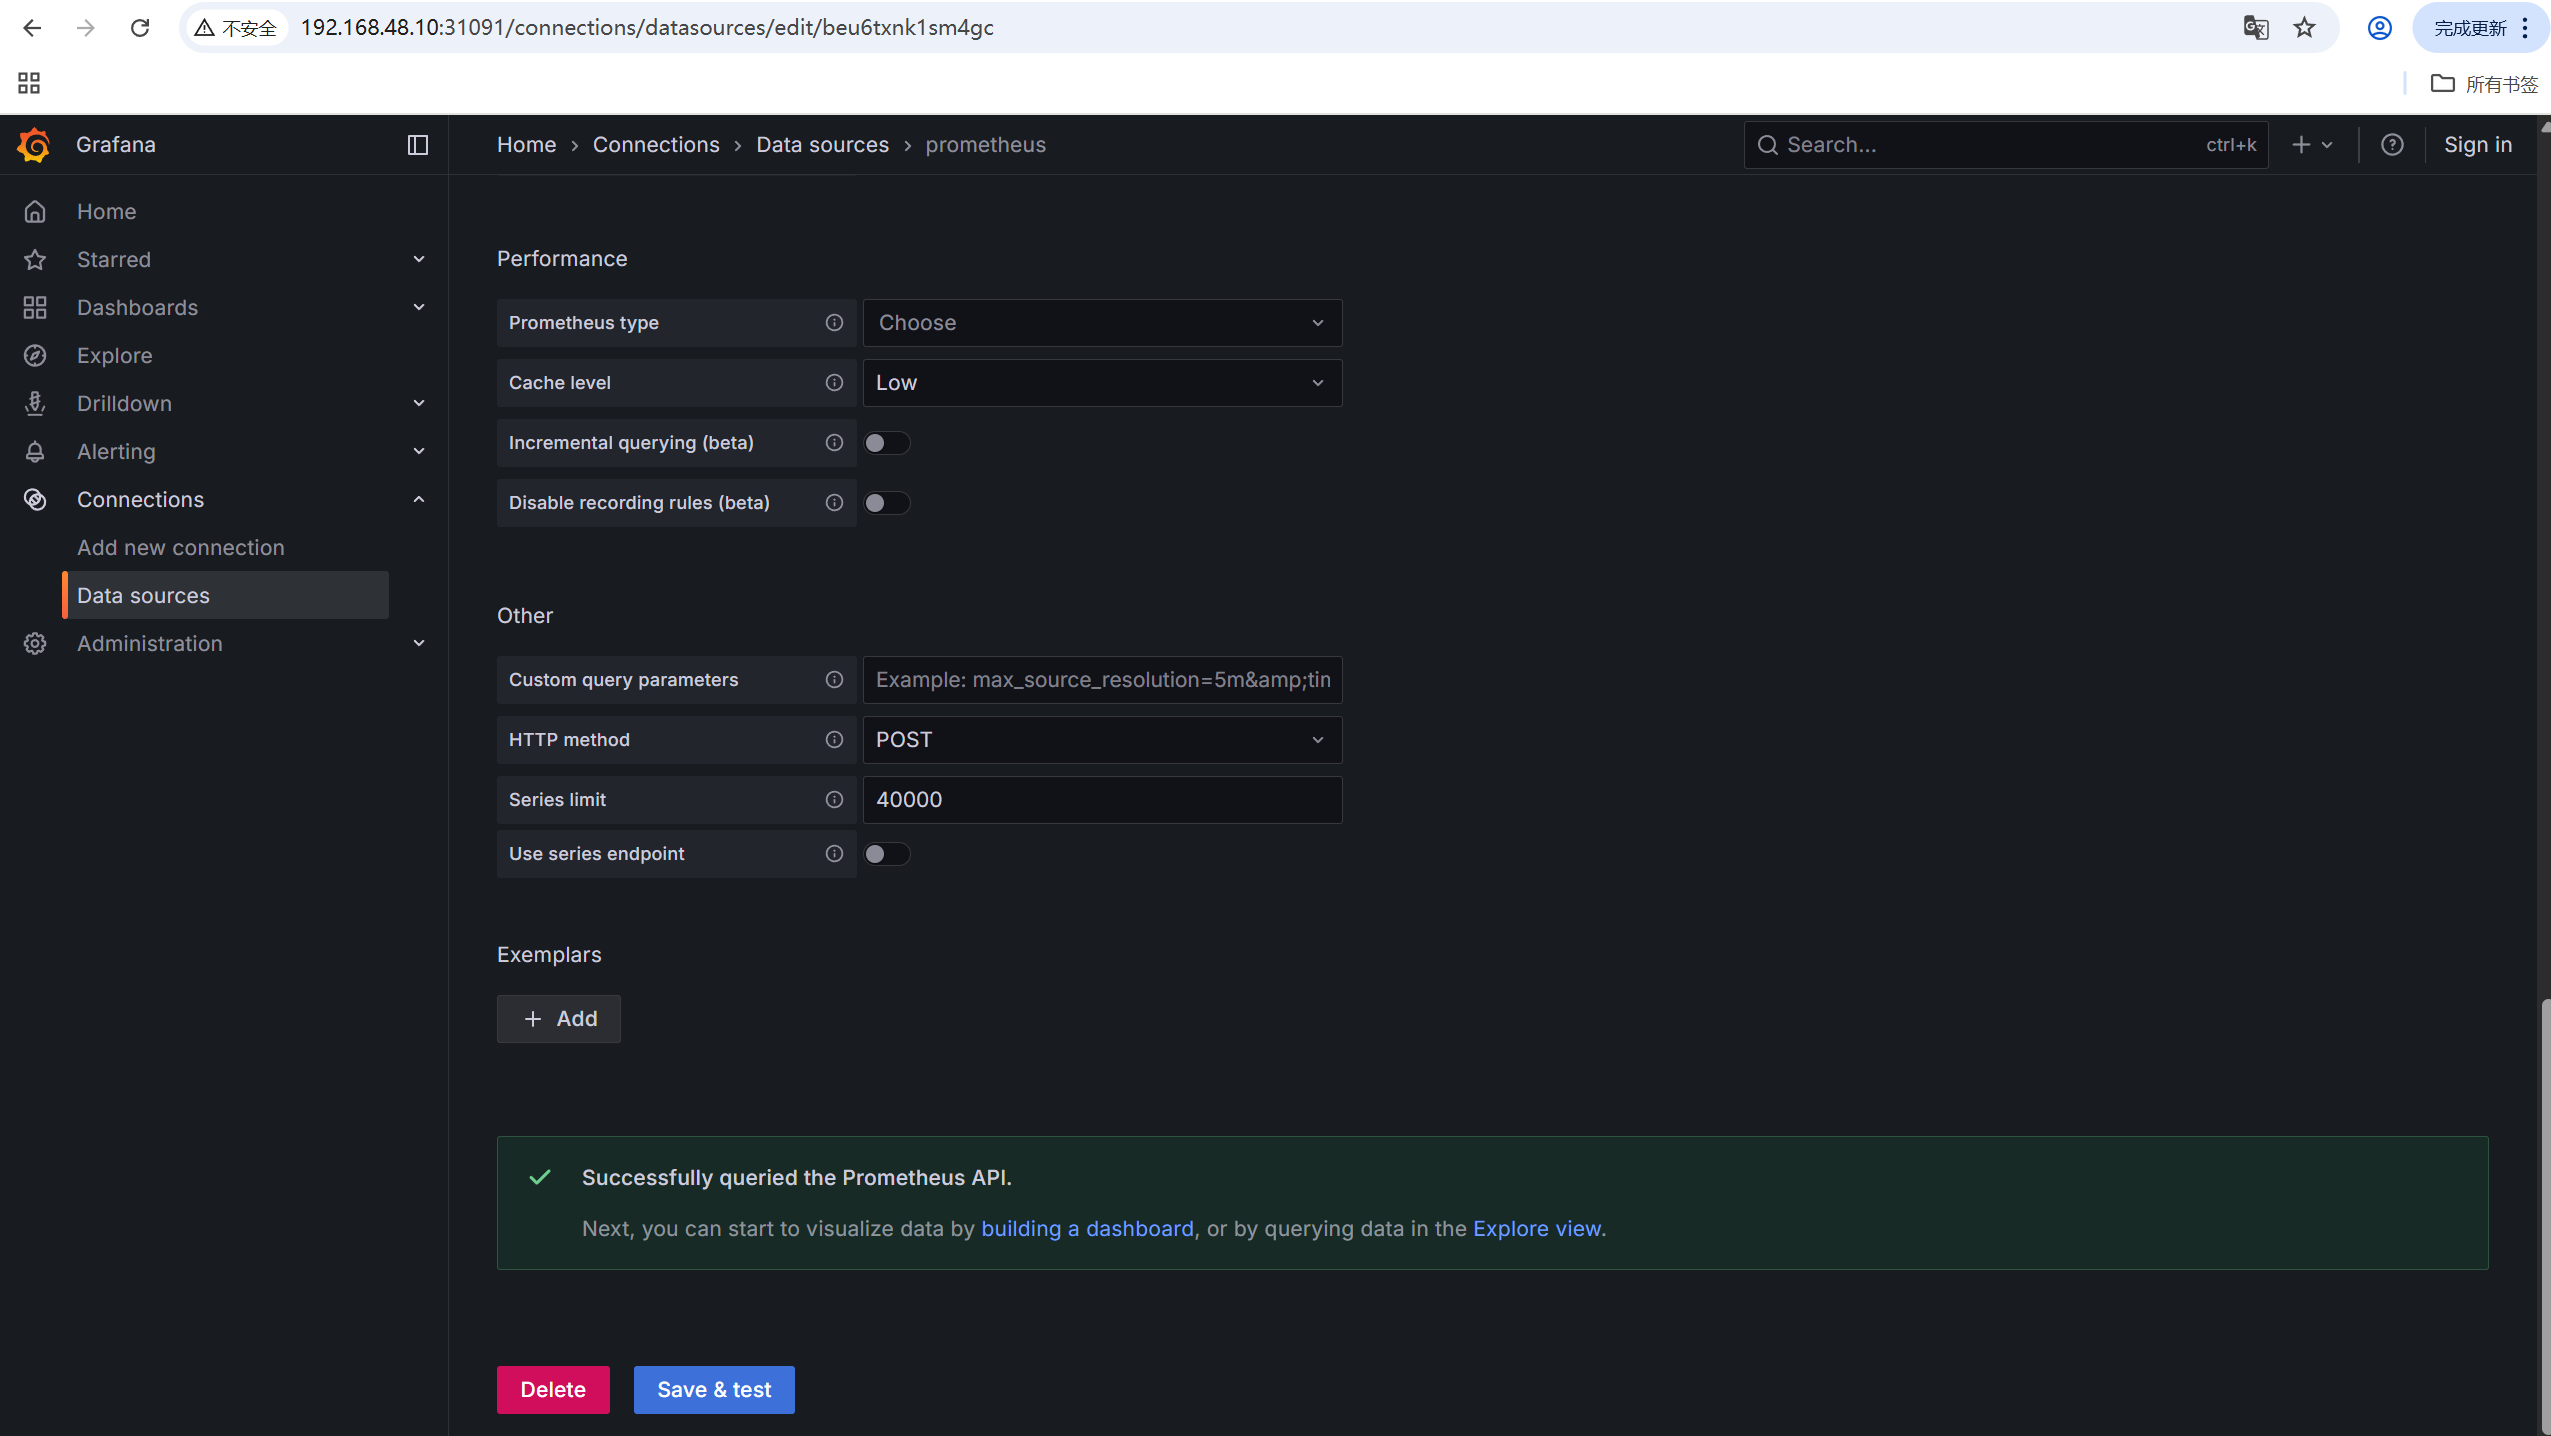
8.1 为grafana配置数据源
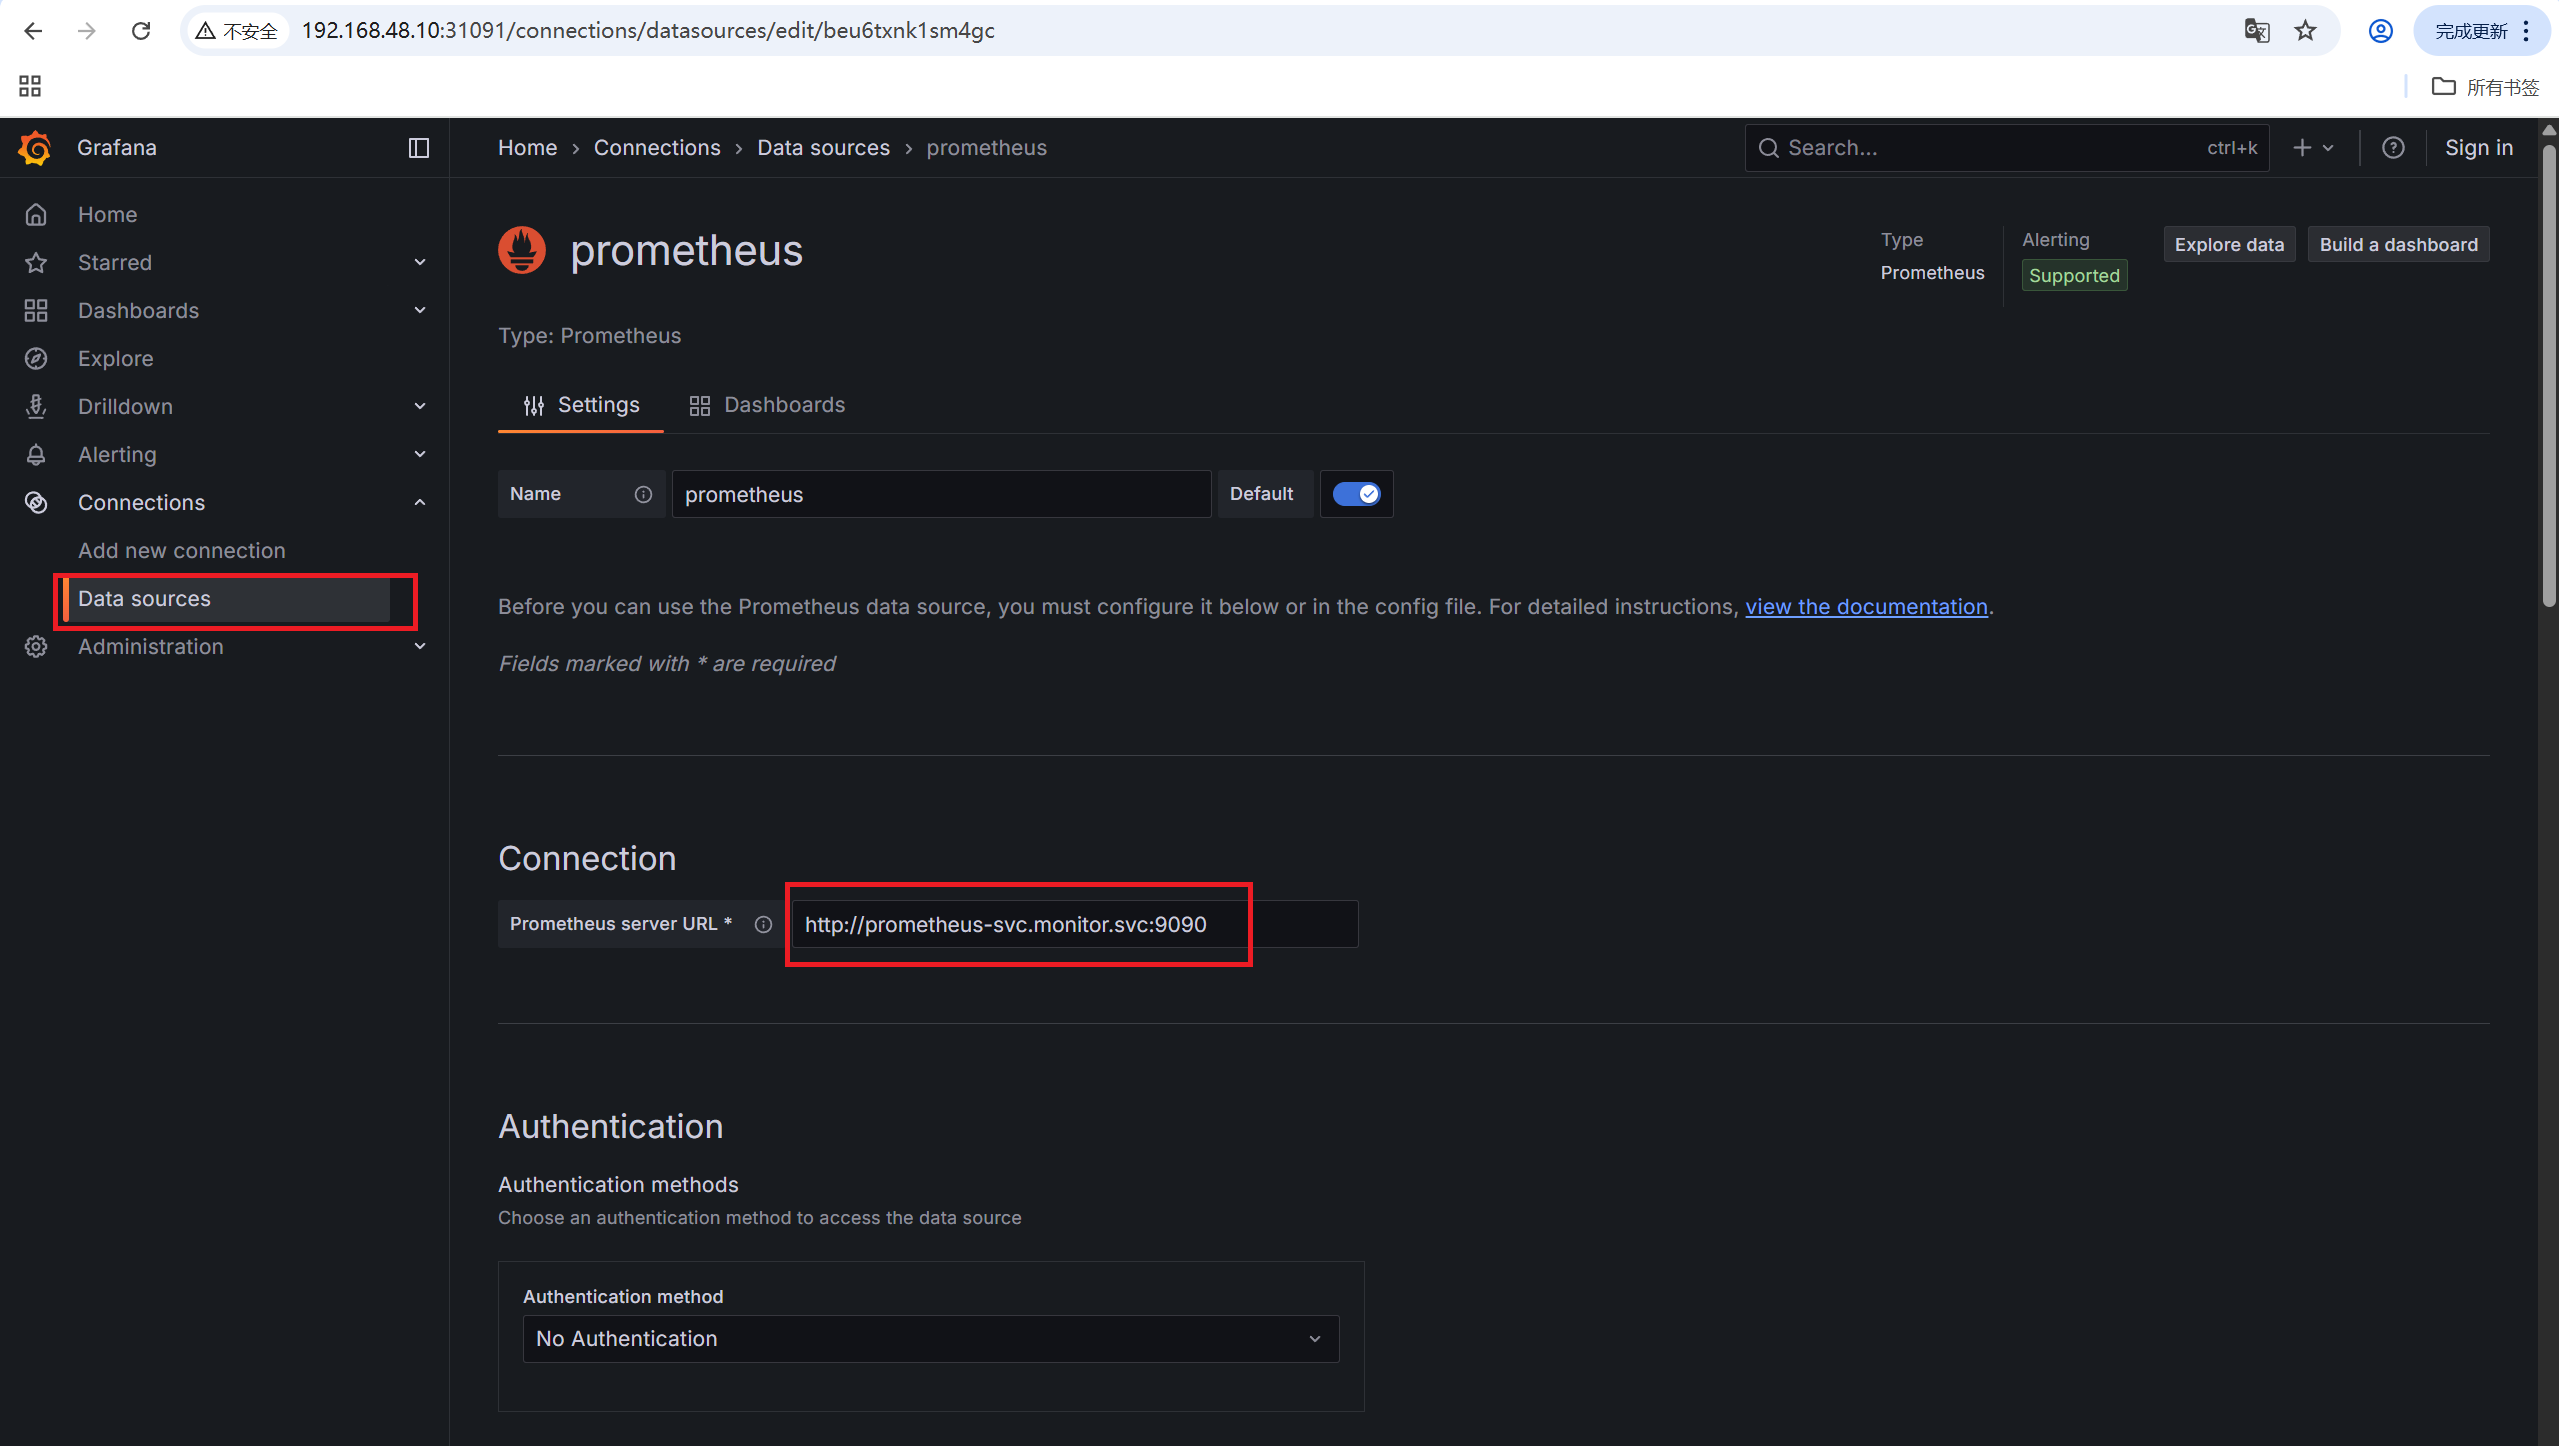
点击最下方save & test,出现Successfully queried the Prometheus API.则为成功。
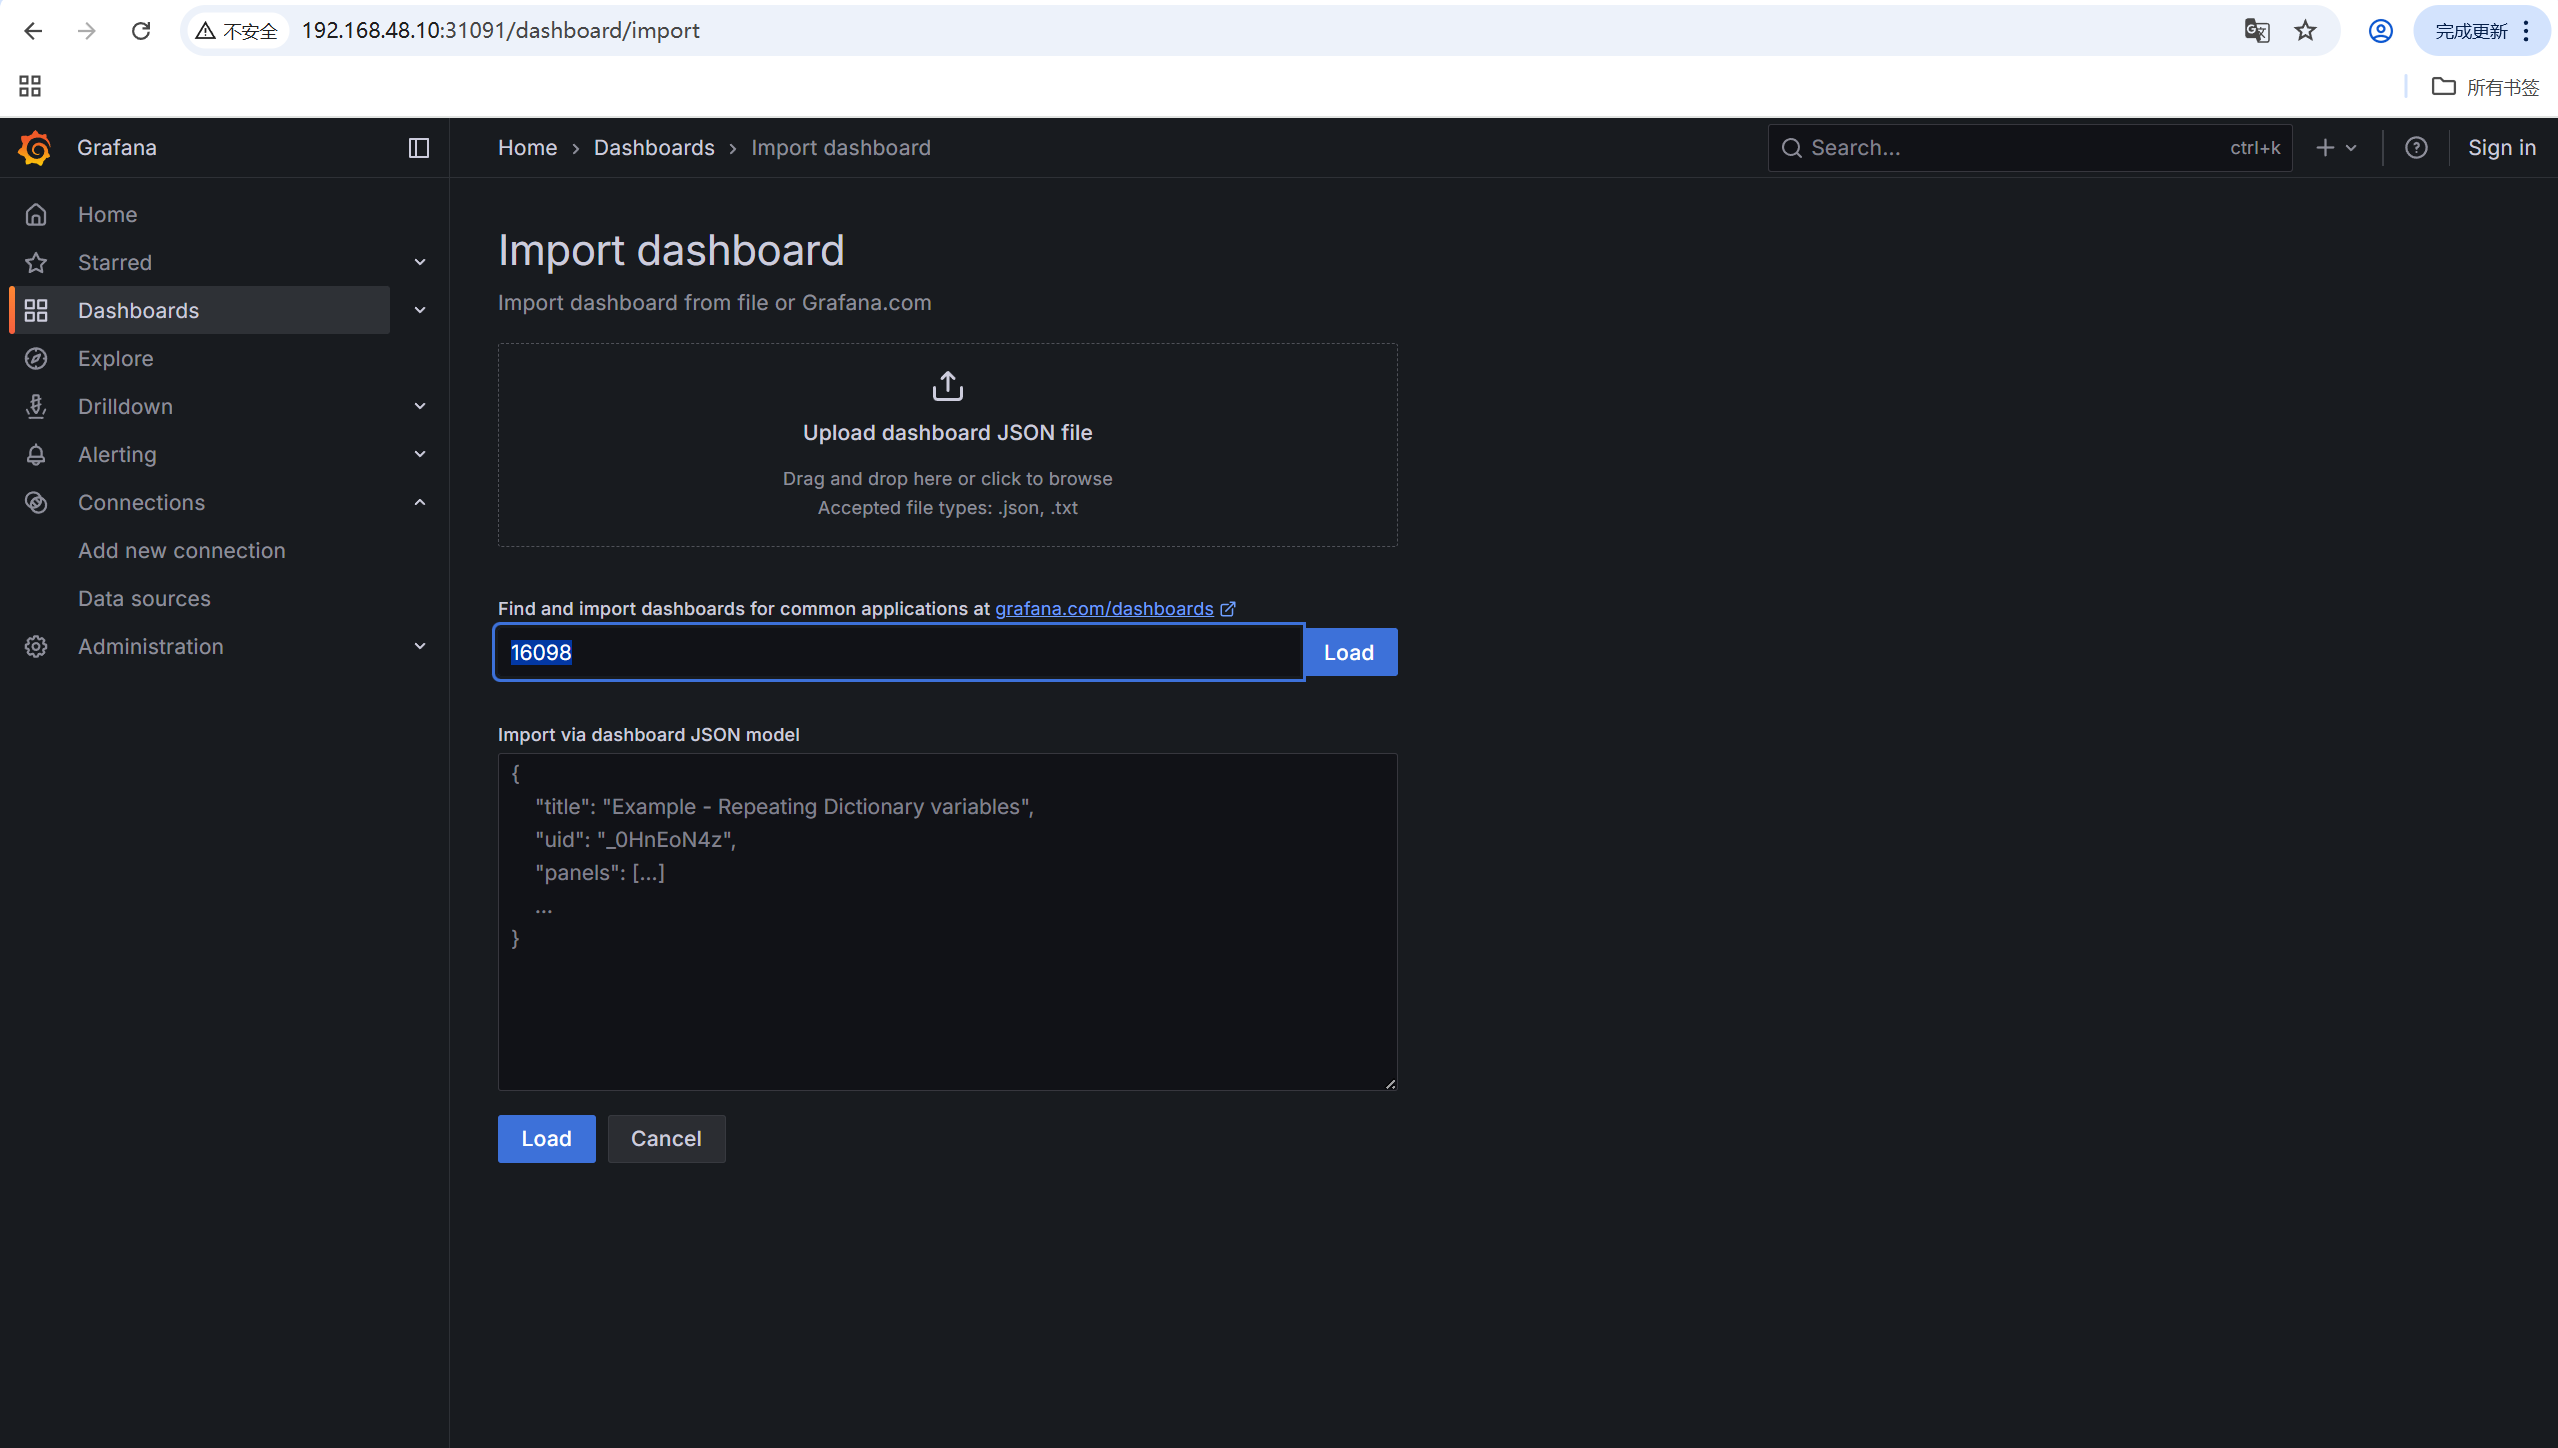
8.2 导入仪表盘
仪表盘id:
-
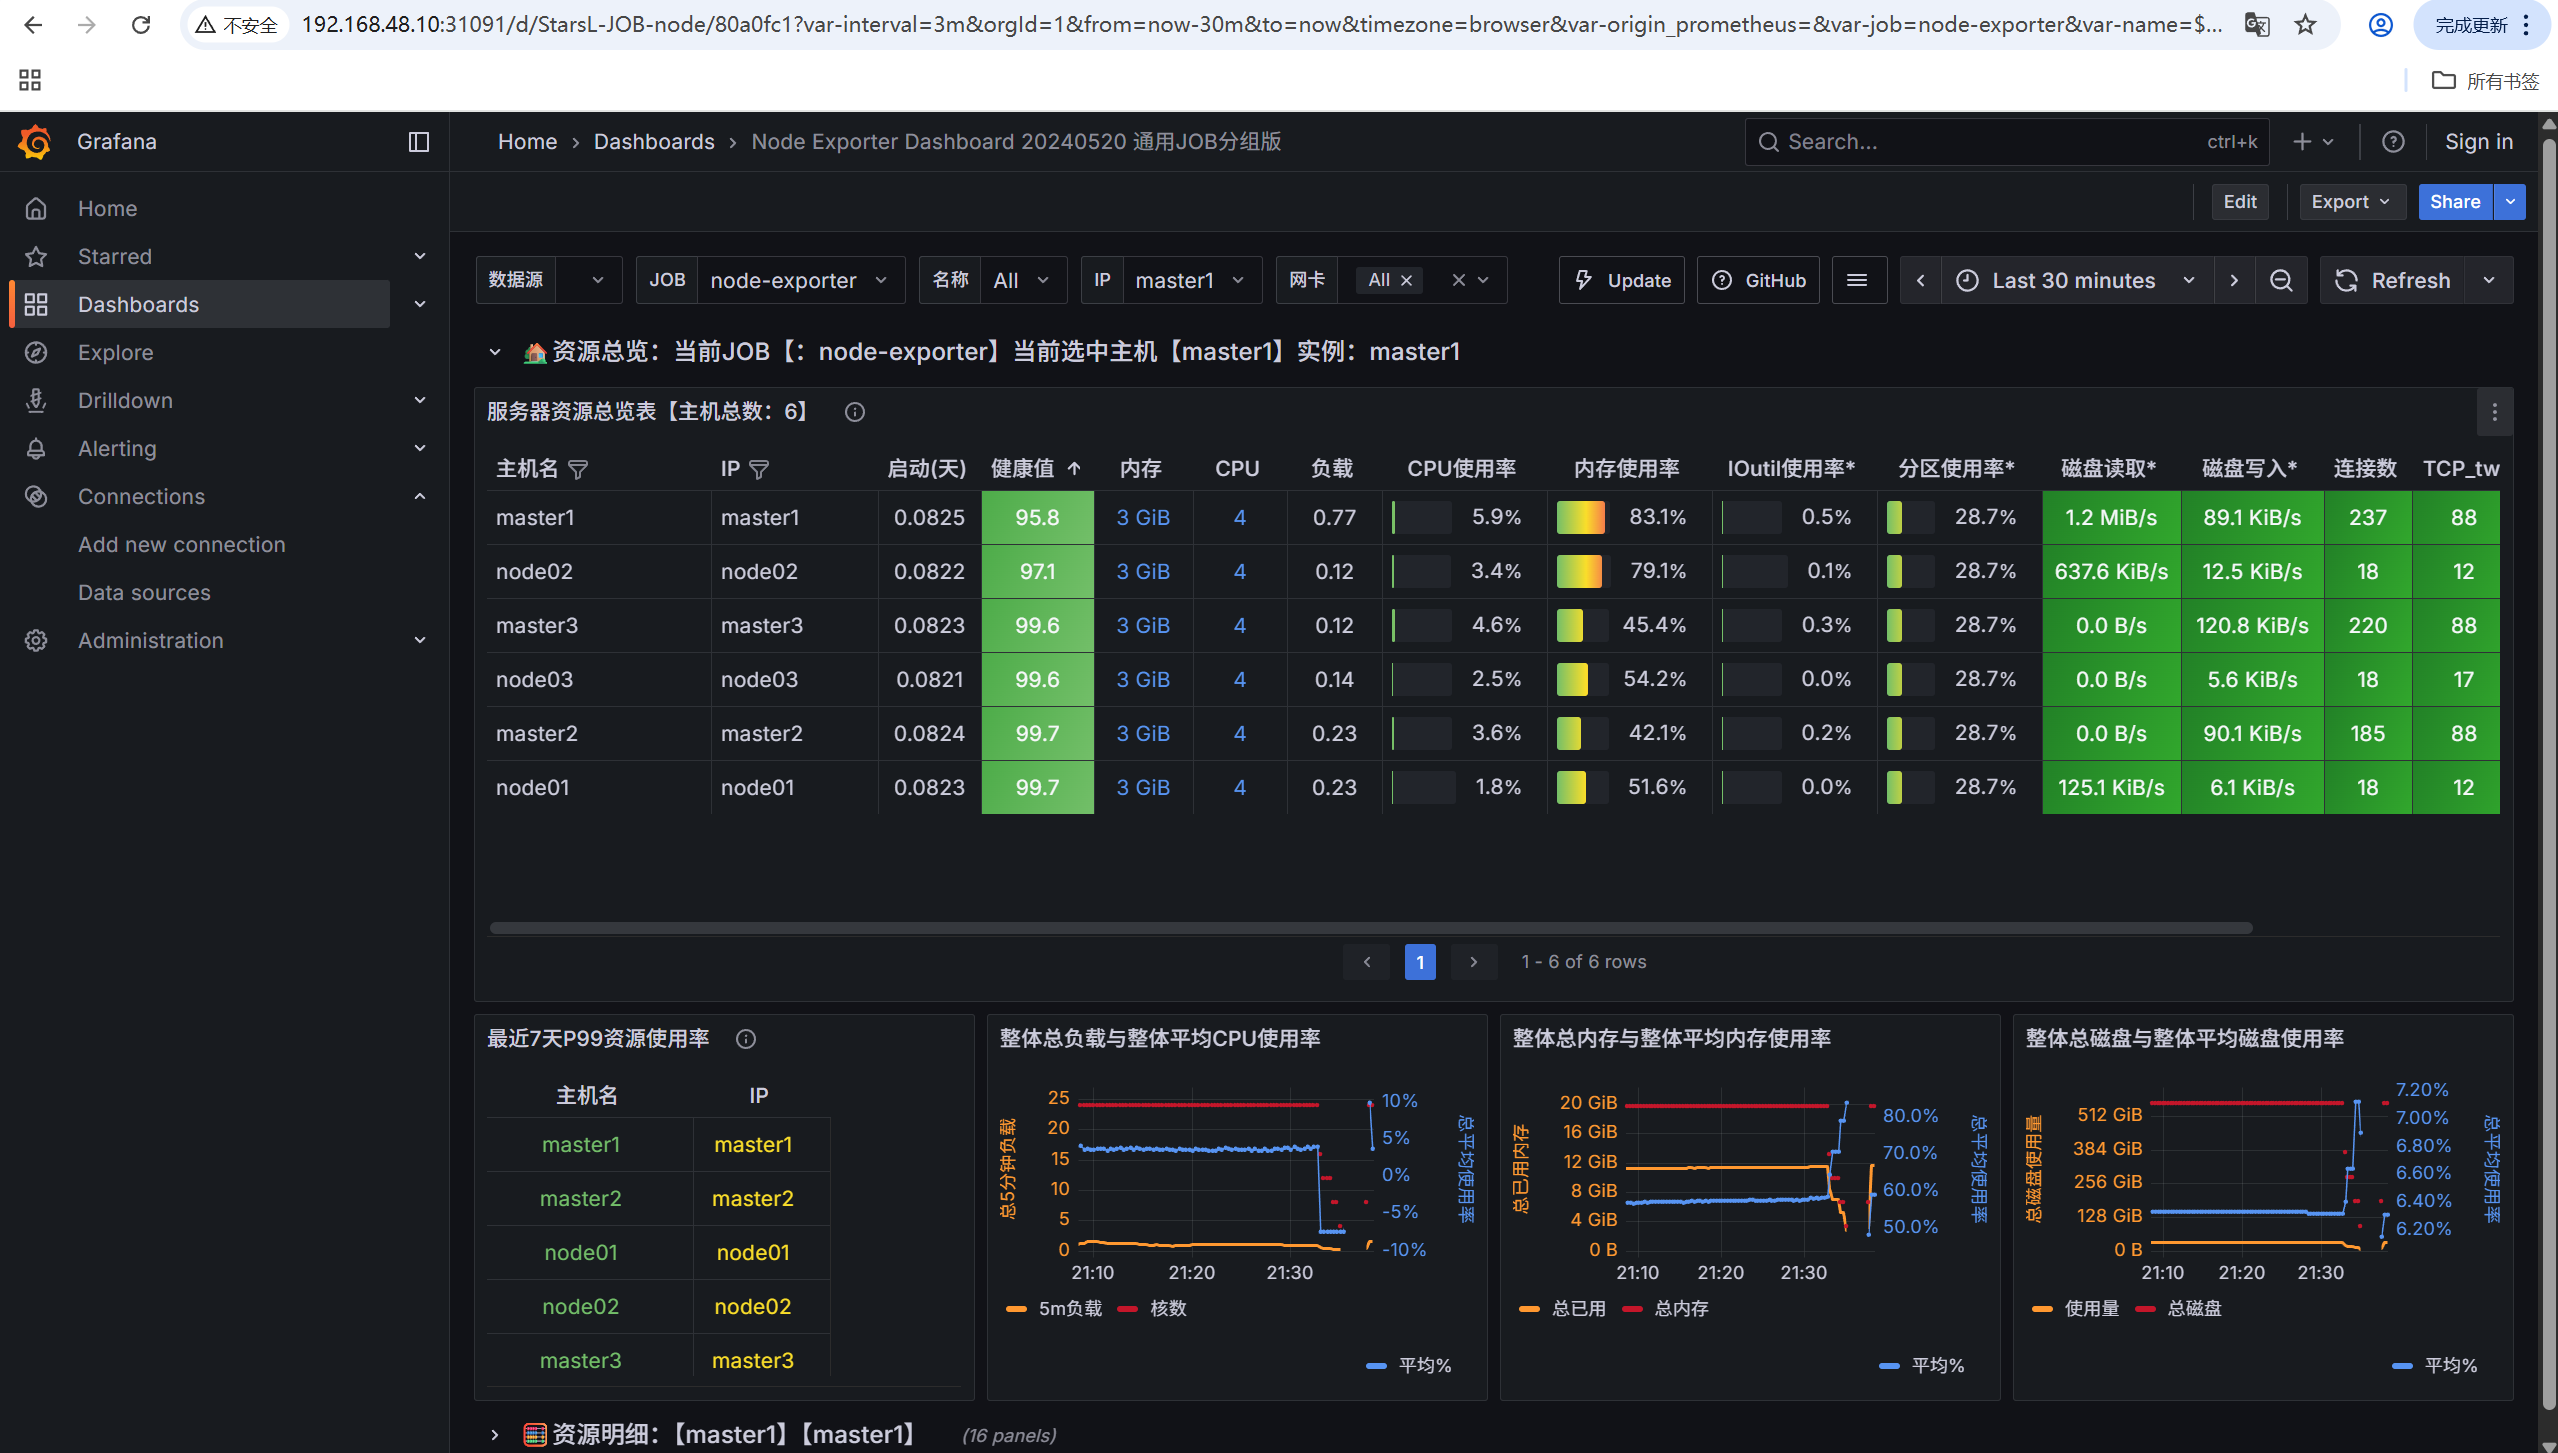
node节点监控:16098
-
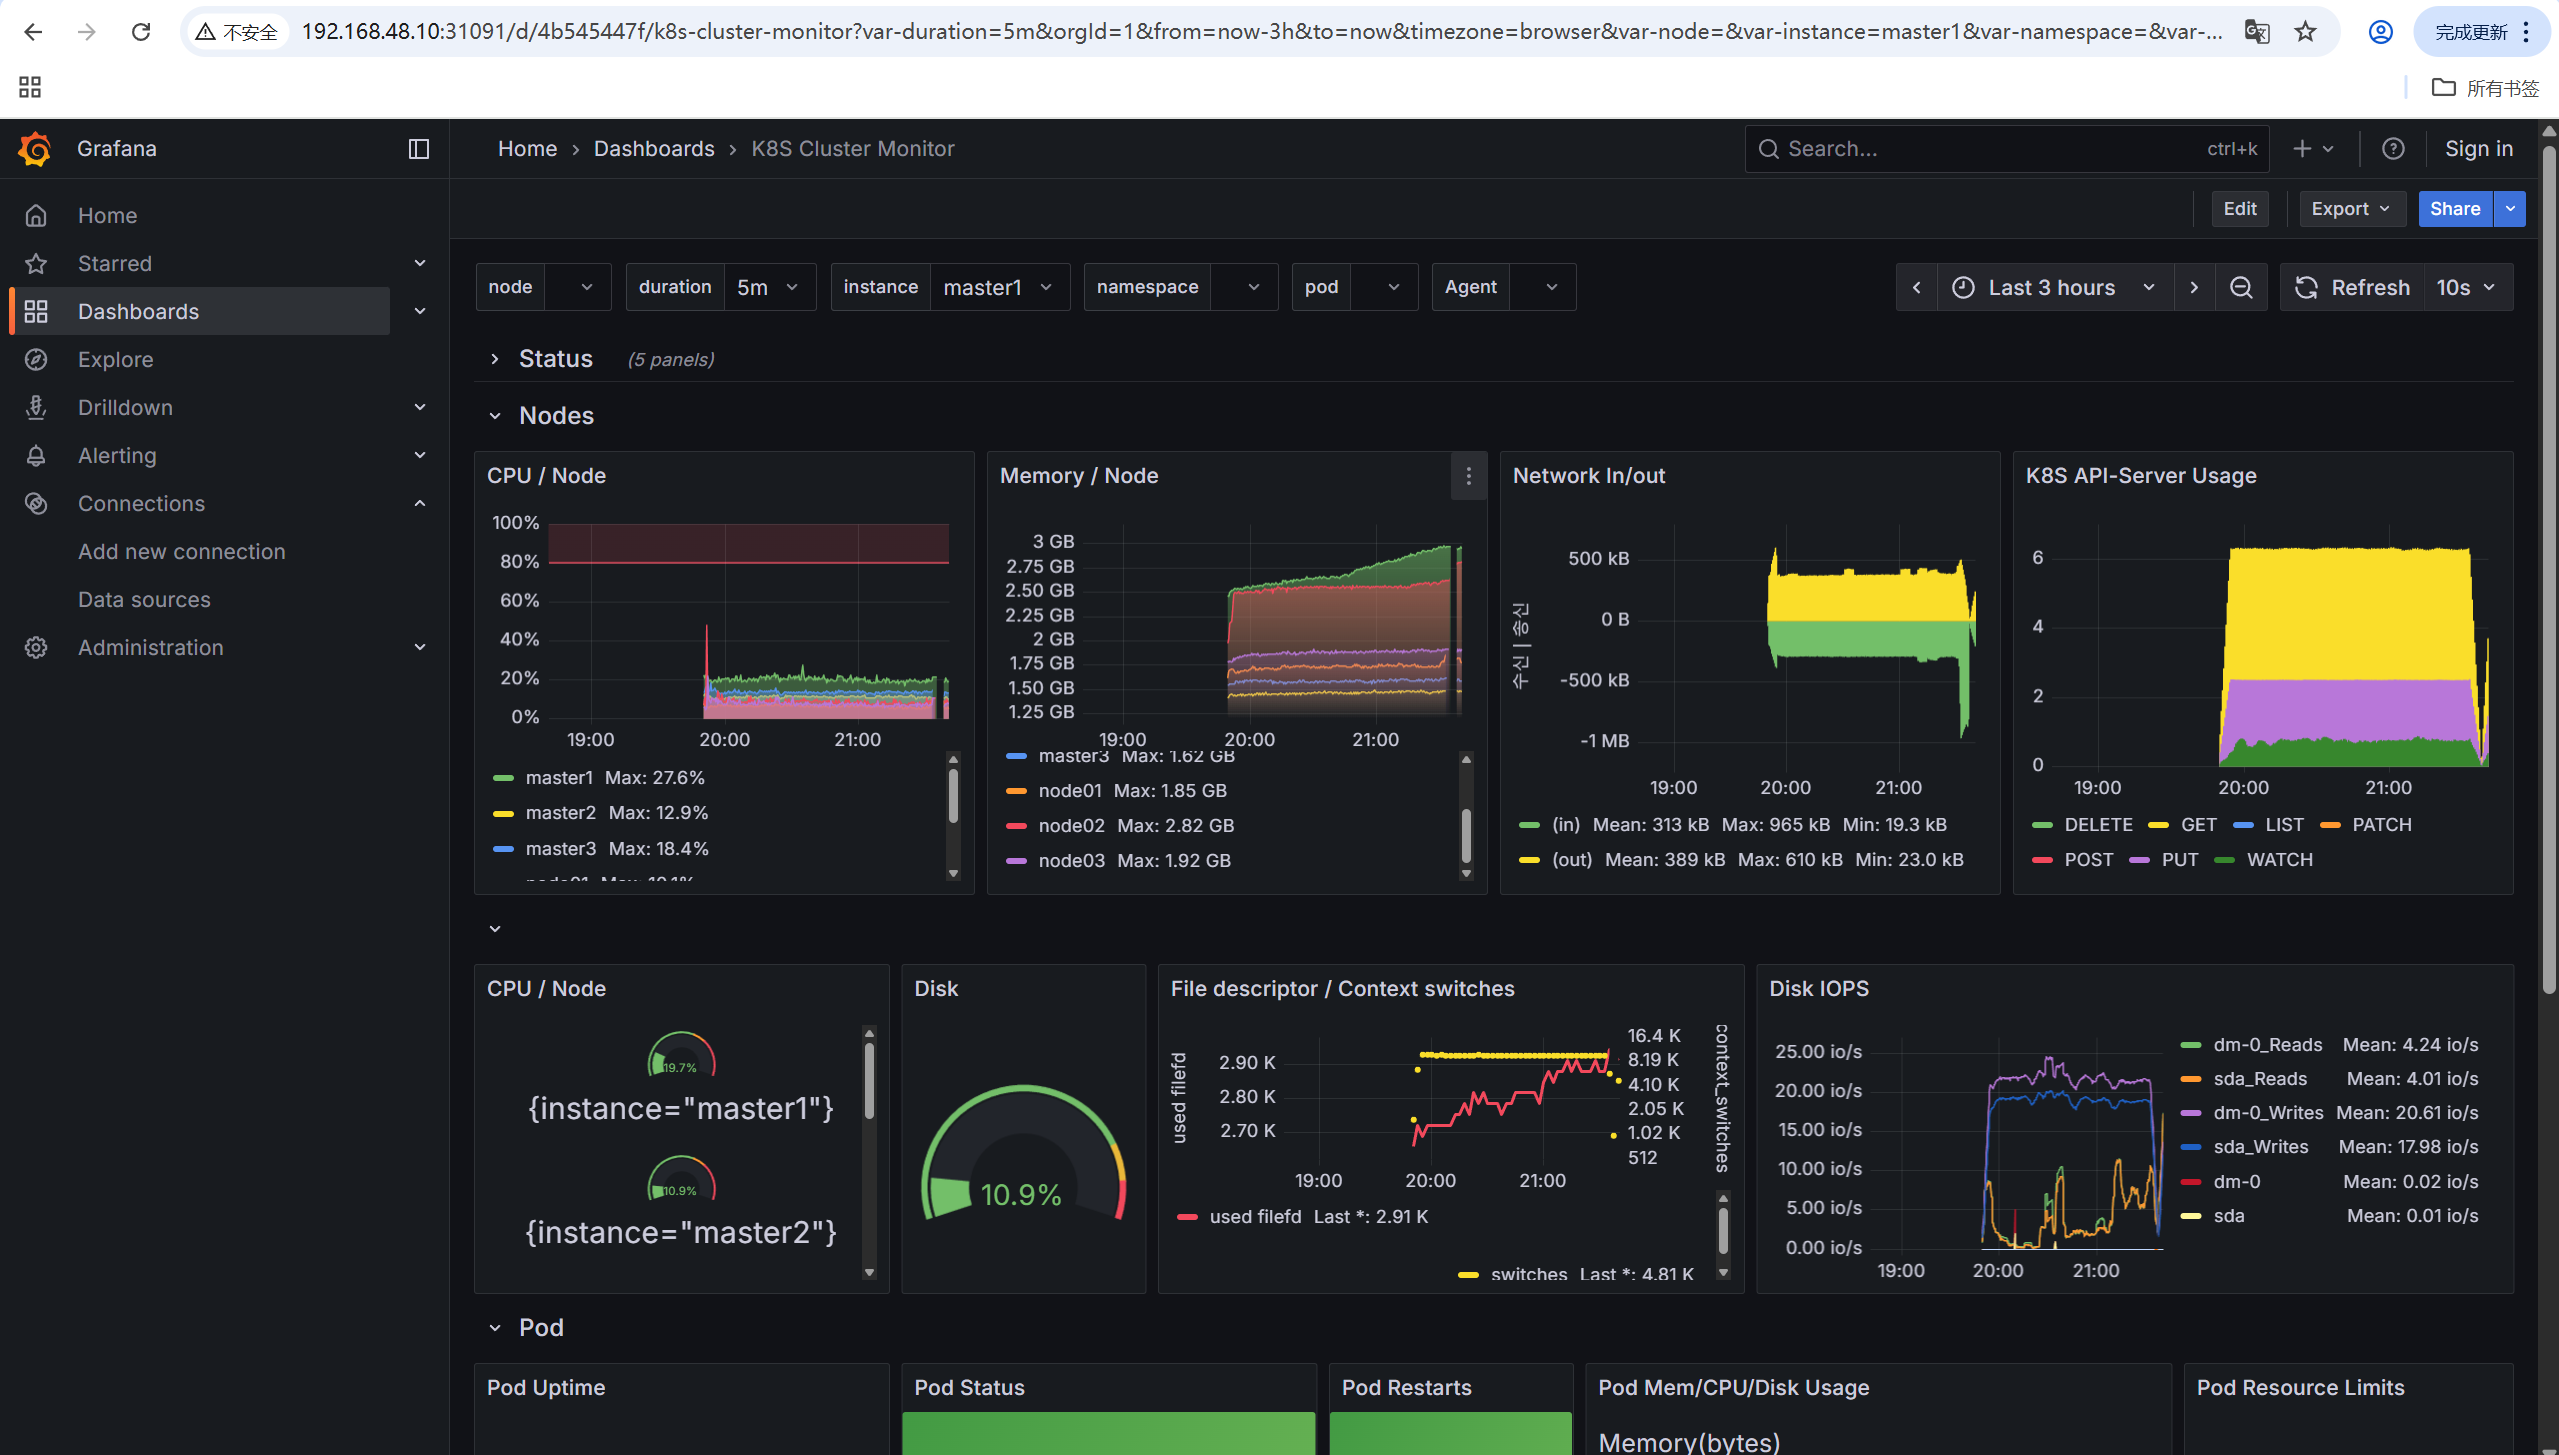
k8s集群监控:14249
8.3 仪表盘展示