基于POI-TL实现动态Word模板数据填充(含图表):从需求到落地的完整开发实践
在企业级报告生成场景中,"在线编辑模板+动态数据填充"是高频需求------既要支持业务人员通过可视化工具自定义Word模板结构,又要确保后端能精准将数据库数据(含文字、图表)填充到模板中。本文将详细记录我基于POI-TL实现"OnlyOffice在线编辑模板+动态文字/图表填充"的全流程,包括需求拆解、核心技术实现、难点突破及最终落地方案。
一、项目需求与整体流程
1. 核心需求
业务侧需要一套"模板自定义+报告自动生成"系统,核心诉求分为两部分:
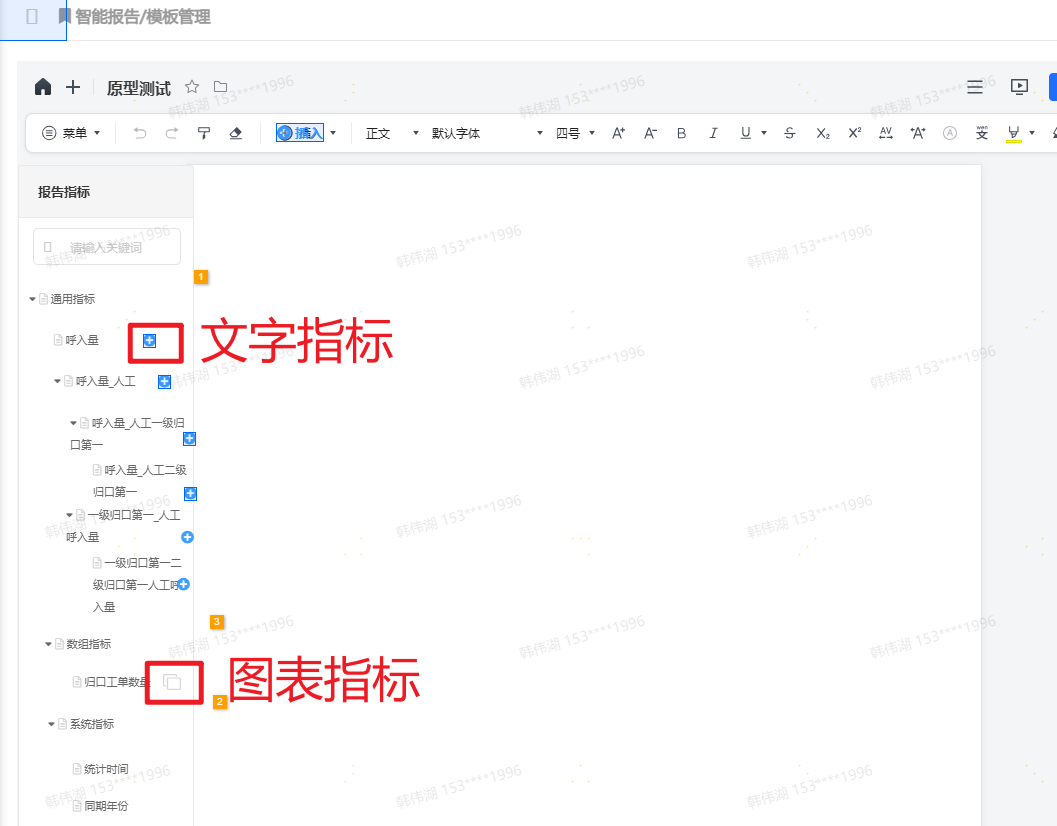
- 前端模板编辑(基于OnlyOffice):支持业务人员在OnlyOffice中插入"文字指标"和"图表指标",生成自定义模板。
- 后端数据填充(基于POI-TL):加载前端编辑好的Word模板,自动查询指标数据,填充"文字占位符"和"图表占位符",最终生成完整报告并存储到MinIO。
2. 指标定义与占位符规范
为了实现"前端插入指标-后端精准匹配",我们约定了严格的占位符规则:
| 指标类型 | 前端操作 | 占位符格式 | 数据要求 |
|---|---|---|---|
| 文字指标 | 左侧指标树点击"添加",插入到光标位置 | {``{指标id}} (如{``{1958085107408896002}}) |
单个值(字符串、数字等) |
| 图表指标 | 顶部"插入图表"选择类型,指标树复制"数组型指标"关联 | {``{chart指标id}} (如{``{chart1958085107408896002}}) |
数组格式(需匹配图表的系列/分类要求) |
3. 整体流程概览
整个系统的数据流如下:
- 模板编辑 :业务人员通过OnlyOffice编辑模板,插入文字/图表占位符,前端将"已插入的文字指标ID"以逗号分隔字符串(
indicatorsIdStr)记录,模板文件保存到MinIO。 - 模板加载:后端接收"生成报告"请求,从MinIO下载Word模板,转换为文件流。
- 数据查询 :
- 解析
indicatorsIdStr,查询所有文字指标数据,存入结果Map。 - 遍历模板中的图表,匹配对应的图表指标ID,查询数组型数据。
- 解析
- 数据填充:通过POI-TL将文字数据、图表数据填充到模板中。
- 报告存储:填充完成的Word文件流上传到MinIO,返回访问链接。
二、技术栈选型
选择合适的技术栈是实现需求的基础,本项目核心技术选型如下:
- 前端模板编辑:OnlyOffice(开源在线Office编辑工具,支持自定义插件扩展指标树);
- 后端模板处理:POI-TL 1.12.2(基于Apache POI的Word模板引擎,支持文字、图表、表格等复杂填充);
- 文件存储:MinIO(轻量对象存储服务,兼容S3协议,便于模板和报告的上传/下载);
- 开发语言:Java 17 + Spring Boot 2.7.16
为什么选POI-TL?
相比原生Apache POI的"硬编码操作XML",POI-TL支持"模板+数据"的分离模式,通过"占位符"即可实现填充,无需关心Word底层的XML结构;同时其原生支持图表填充,无需额外引入复杂插件,非常适合本需求。
三、核心实现步骤
1. 前置准备:引入依赖
在pom.xml中引入POI-TL及MinIO相关依赖(注意POI-TL需与Apache POI版本兼容):
xml
<!-- POI-TL 核心依赖 -->
<dependency>
	<groupId>com.deepoove</groupId>
	<artifactId>poi-tl</artifactId>
	<version>1.12.2</version>
	<exclusions>
		<exclusion>
			<artifactId>batik-bridge</artifactId>
			<groupId>org.apache.xmlgraphics</groupId>
		</exclusion>
		<exclusion>
			<artifactId>poi-ooxml</artifactId>
			<groupId>org.apache.poi</groupId>
		</exclusion>
	</exclusions>
</dependency>

<!-- POI 核心依赖 -->
<dependency>
	<groupId>org.apache.poi</groupId>
	<artifactId>poi-ooxml</artifactId>
	<version>5.2.4</version>
</dependency>
<dependency>
	<groupId>org.apache.poi</groupId>
	<artifactId>poi</artifactId>
	<version>5.2.4</version>
</dependency>
<dependency>
	<groupId>org.apache.poi</groupId>
	<artifactId>poi-ooxml-lite</artifactId>
	<version>5.2.4</version>
</dependency>
<!-- 处理图表和Excel数据 -->
<dependency>
	<groupId>org.apache.poi</groupId>
	<artifactId>poi-ooxml-full</artifactId>
	<version>5.2.4</version>
</dependency>
2. 步骤1:加载Word模板(从MinIO到文件流)
首先通过MinIO客户端下载模板文件,转换为InputStream,供POI-TL使用。 本地开发时建议放在本地读取,方便修改模板测试多个图表
注意 :POI-TL处理的是.docx格式,需确保模板为docx而非doc。
java
/**
 * 从MinIO下载模板文件,返回输入流
 */
public InputStream downloadTemplateFromMinIO(String templatePath) throws Exception {
    // 1. 初始化MinIO客户端
    MinioClient minioClient = MinioClient.builder()
            .endpoint(minioConfig.getEndpoint())
            .credentials(minioConfig.getAccessKey(), minioConfig.getSecretKey())
            .build();

    // 2. 下载模板文件到输入流
    return minioClient.getObject(
            GetObjectArgs.builder()
                    .bucket(minioConfig.getTemplateBucket())
                    .object(templatePath)
                    .build()
    );
}
3. 步骤2:文字指标填充(简单但高频)
文字指标的填充是POI-TL的基础功能,核心是"占位符ID与数据Map的键匹配"。
3.1 解析文字指标ID并查询数据
前端传入的indicatorsIdStr是逗号分隔的指标ID(如"1958085107408896002,1958085107408896003"),先解析为List,再查询数据库:
java
/**
 * 解析文字指标ID,查询数据并返回Map
 */
public Map<String, Object> getTextIndicatorData(String indicatorsIdStr) {
    Map<String, Object> textDataMap = new HashMap<>();
    if (StringUtils.isBlank(indicatorsIdStr)) return textDataMap;

    // 1. 解析指标ID列表
    List<String> indicatorIds = Arrays.asList(indicatorsIdStr.split(","));

    // 2. 批量查询指标数据(实际项目中替换为DAO层查询)
    List<IndicatorDTO> indicators = indicatorMapper.selectByIds(indicatorIds);

    // 3. 封装为POI-TL需要的Map(key=指标ID,value=指标值)
    indicators.forEach(indicator -> {
        textDataMap.put(indicator.getId(), indicator.getValue());
    });
    return textDataMap;
}
3.2 POI-TL文字填充
POI-TL的文字填充通过Configure和XWPFTemplate实现,默认支持{``{key}}格式的占位符:
java
// 1. 加载模板流(从MinIO获取)
InputStream templateStream = downloadTemplateFromMinIO(templatePath);

// 2. 获取文字数据Map
Map<String, Object> textDataMap = getTextIndicatorData(indicatorsIdStr);

// 3. POI-TL配置(默认配置即可满足文字填充)
Configure config = Configure.builder().build();

// 4. 初始化模板并填充文字数据
XWPFTemplate template = XWPFTemplate.compile(templateStream, config).render(textDataMap);
4. 步骤3:图表指标填充(核心难点)
图表填充是本项目的核心,也是最复杂的部分------需要解决"如何匹配模板中的图表与指标ID""如何根据图表类型动态渲染数据"两个关键问题。
4.1 关键前提:通过"图表标题"关联指标ID
用户在OnlyOffice中插入图表时,会在"图表属性"中输入标题(标题值就是chart指标id,如chart1958085107408896002)。
POI-TL无法直接读取图表的"占位符",但可以通过**"图表标题"+"图表在模板中的位置"** 关联指标ID------这也是用户提到的"通过关系ID找段落"的核心逻辑。
4.2 核心逻辑:遍历图表→匹配指标→渲染数据
4.2.1 步骤1:获取模板中的所有图表(XWPFChart)
Word的图表本质是嵌入在文档中的"图表对象",通过XWPFDocument的getCharts()方法可获取所有图表
4.2.2 步骤2:通过"关系ID"找到图表对应的段落(XWPFParagraph)
每个XWPFChart都有一个唯一的关系ID(RelationId),而图表所在的段落会引用这个ID。通过遍历所有段落,匹配关系ID即可找到图表对应的段落,进而获取图表标题(即指标ID)
4.2.3 步骤3:获取图表标题(指标ID)并查询数据
找到段落后,图表标题就是段落的文本内容(即{``{chart指标id}}中的指标ID),去除占位符符号后即可查询数据
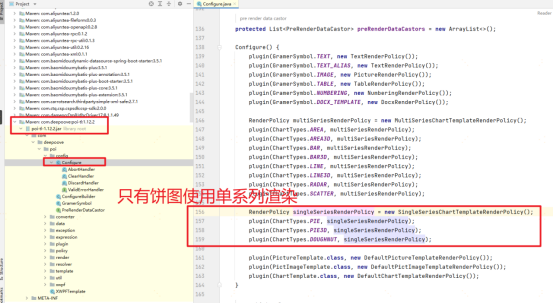
4.2.4 步骤4:根据图表类型动态渲染(饼图vs其他图表)
POI-TL的图表填充通过ChartRenderData实现,不同图表类型的ChartRenderData构造逻辑不同:
- 饼图:只有"分类"和"单系列"数据;
- 柱状图/折线图等:有"分类"和"多系列"数据。
- poi-tl源码找到的匹配关系
- 判断 XWPFChart 是否为饼图:
java
/**
 * 判断 XWPFChart 是否为饼图
 * @param chart 目标图表
 * @return true = 饼图;false = 非饼图
 */
public boolean isPurePieChart(XWPFChart chart) {
	CTChart ctChart = chart.getCTChart();
	if (ctChart == null) return false;

	CTPlotArea plotArea = ctChart.getPlotArea();
	if (plotArea == null) return false;

	// 1. 必须存在饼图容器
	boolean hasPieChart = plotArea.getPieChartList() != null && !plotArea.getPieChartList().isEmpty();
	if (!hasPieChart) return false;

	// 2. 必须不存在其他类型图表容器(如柱状图、折线图等)
	boolean hasOtherChart = false;
	// 检查柱状图
	if (plotArea.getBarChartList() != null && !plotArea.getBarChartList().isEmpty()) hasOtherChart = true;
		// 检查折线图
	else if (plotArea.getLineChartList() != null && !plotArea.getLineChartList().isEmpty()) hasOtherChart = true;
		// 检查柱状图3D
	else if (plotArea.getBar3DChartList() != null && !plotArea.getBar3DChartList().isEmpty()) hasOtherChart = true;
		// 检查散点图
	else if (plotArea.getScatterChartList() != null && !plotArea.getScatterChartList().isEmpty())
		hasOtherChart = true;

	return !hasOtherChart;
}
/**
 * 判断SQL查询结果是否两个字段
 * @author: Hanweihu
 * @date: 2025/9/9 14:26
 * @param resultList
 * @return boolean
 */
public static boolean isResultTwoFields(List<Map<String, Object>> resultList) {
    List<String> fieldNames = new ArrayList<>(resultList.get(0).keySet());
    if (fieldNames.size() != 2) {
        return false;
    }
    return true;
}
4.2核心逻辑的完整代码
java
// 获取模板内所有图表的指标
XWPFDocument doc = new XWPFDocument(inputStream);
// 遍历Word中的所有图表
List<XWPFChart> charts = doc.getCharts();
for (XWPFChart currChart : charts) {
	String chartSelfRelId = null;
	org.apache.poi.openxml4j.opc.PackagePart chartPart = currChart.getPackagePart();
	if (chartPart != null) {
		// 1. 获取图表部件的「路径名称」(如 "/word/charts/chart1.xml")
		String chartPartName = chartPart.getPartName().getName();
		// 2. 遍历文档主体的所有关系,匹配「目标 URI == 图表部件路径」的关系
		for (org.apache.poi.openxml4j.opc.PackageRelationship rel : doc.getPackagePart().getRelationships()) {
			if (rel.getTargetURI() != null && rel.getTargetURI().toString().equals(chartPartName)) {
				chartSelfRelId = rel.getId(); // 匹配到文档引用图表的r:id
				break;
			}
		}
	}
	if (chartSelfRelId == null) continue; // 无有效r:id,跳过

	String targetTitle = null;

	// 【步骤2:遍历段落,提取绘图中<c:chart>的r:id并匹配】
	for (XWPFParagraph para : doc.getParagraphs()) {
		for (XWPFRun run : para.getRuns()) {
			CTR ctr = run.getCTR();
			if (ctr.getDrawingArray() == null || ctr.getDrawingArray().length == 0) continue;

			CTInline[] inlines = ctr.getDrawingArray()[0].getInlineArray();
			for (CTInline inline : inlines) {
				CTGraphicalObject graphic = inline.getGraphic();
				if (graphic == null) continue;

				CTGraphicalObjectData graphicData = graphic.getGraphicData();
				if (graphicData == null) continue;

				// 1. 获取 <a:graphicData> 的 DOM 节点
				org.w3c.dom.Node graphicDataNode = graphicData.getDomNode();
				if (graphicDataNode == null) continue;

				// 2. 遍历子节点,找到 <c:chart> 节点(通过「命名空间 + 本地名」匹配)
				org.w3c.dom.NodeList childNodes = graphicDataNode.getChildNodes();
				String paraChartRelId = null;
				for (int i = 0; i < childNodes.getLength(); i++) {
					org.w3c.dom.Node child = childNodes.item(i);
					if ("chart".equals(child.getLocalName()) && "http://schemas.openxmlformats.org/drawingml/2006/chart".equals(child.getNamespaceURI())) {
						// 关键:将 Node 强转为 Element(Element 支持 getAttributeNS 方法)
						if (child instanceof org.w3c.dom.Element) {
							org.w3c.dom.Element chartElement = (org.w3c.dom.Element) child;
							String relNamespaceURI = "http://schemas.openxmlformats.org/officeDocument/2006/relationships";
							paraChartRelId = chartElement.getAttributeNS(relNamespaceURI, "id");
						}
						break;
					}
				}

				// 4. 匹配「段落中图表的r:id」与「图表自身的关系ID」
				if (paraChartRelId != null && paraChartRelId.equals(chartSelfRelId)) {
					targetTitle = inline.getDocPr().getTitle(); // 获取title
					break;
				}
			}
			if (targetTitle != null) break;
		}
		if (targetTitle != null) break;
	}

	LOGGER.info("图表自身关系ID: " + chartSelfRelId);
	LOGGER.info("匹配到的title: " + targetTitle);
	targetTitle = targetTitle.replace("{{", "").replace("}}", "");
	String indicatorsId = targetTitle.replace("chart", "");
	EfficiencyIndicatorsEntity byId = efficiencyIndicatorsService.getById(indicatorsId);
	if (byId != null) {
		String definitionSql = byId.getDefinitionSql();
		if (StringUtils.isNotBlank(definitionSql)) {
			if (efficiencyIndicatorsService.checkSqlRuleBoolean(definitionSql)) {
				// SQL中的系统变量转换
				List<DictionaryItemEntity> itemEntityList = reportRepository.selectDictItemById(CommonConstant.INDICATORS_VARIABLE);
				definitionSql = systemVariableConvertService.systemVariableConvert(definitionSql, saveVO, itemEntityList);
				// 执行
				List<Map<String, Object>> resultList = sqlExecuteService.executeSql(definitionSql);
				// 饼图只能单系列,查询结果字段只能有两个
				if (chartRenderUtil.isPurePieChart(currChart) && chartRenderUtil.isResultTwoFields(resultList)) {
					// 将resultList转为单系列渲染构造器
					map.put(targetTitle, chartRenderUtil.buildSingleSeriesData(resultList, definitionSql));
				}
				if (!chartRenderUtil.isPurePieChart(currChart)) {
					// 将resultList转为多系列渲染构造器
					map.put(targetTitle, chartRenderUtil.buildMultiSeriesData(resultList, definitionSql));
				}
			}
		}
	}
}
4.3 重新渲染模板(包含图表数据)
将图表数据加入结果Map后,重新调用render方法即可完成图表填充:
java
// 填充图表数据(textDataMap已包含文字和图表数据)
template.render(textDataMap);
5. 步骤4:生成报告并上传到MinIO
填充完成后,将XWPFTemplate转换为OutputStream,上传到MinIO的"报告存储桶":
java
/**
 * 将填充后的模板上传到MinIO
 */
public String uploadReportToMinIO(XWPFTemplate template, String reportName) throws Exception {
    // 1. 将模板写入字节输出流
    ByteArrayOutputStream out = new ByteArrayOutputStream();
    template.write(out);
    out.flush();
    ByteArrayInputStream in = new ByteArrayInputStream(out.toByteArray());

    // 2. 上传到MinIO
    String reportPath = "report/" + System.currentTimeMillis() + "_" + reportName + ".docx";
    minioClient.putObject(
            PutObjectArgs.builder()
                    .bucket(minioConfig.getReportBucket())
                    .object(reportPath)
                    .stream(in, in.available(), -1)
                    .contentType("application/vnd.openxmlformats-officedocument.wordprocessingml.document")
                    .build()
    );

    // 3. 关闭流
    in.close();
    out.close();
    template.close();

    // 4. 返回报告访问链接
    return minioConfig.getEndpoint() + "/" + minioConfig.getReportBucket() + "/" + reportPath;
}
四、关键难点与解决方案
在开发过程中,遇到了几个典型问题,这里分享解决方案:
1. 难点1:图表与段落的匹配不稳定
问题 :部分模板中,图表的关系ID与段落中的引用ID不匹配,导致无法找到对应的段落。
原因 :OnlyOffice插入图表时,可能会在段落中生成多个XWPFRun,导致关系ID被嵌套在深层节点中。
解决方案 :优化关系id匹配段落方法,递归遍历段落中的所有CTR节点(底层XML节点)
2. 大模板加载内存溢出
问题 :当模板包含大量图片或图表时,XWPFDocument加载会占用大量内存,导致OOM。
解决方案 :使用POI的SXSSF模式(低内存占用模式),或通过流分片处理;同时限制模板大小(如最大10MB)
五、优化与拓展建议
- 模板缓存:频繁使用的模板可缓存到本地或Redis,避免重复从MinIO下载,提升性能。
- 异步生成:复杂报告(含多个大图表)的生成耗时较长,可通过Spring Async异步处理,返回"生成中"状态,生成完成后通知用户。
- 占位符校验:前端插入占位符时,实时校验指标ID的合法性(是否存在、数据类型是否匹配),减少后端报错。
六、总结
本项目通过"OnlyOffice+POI-TL+MinIO"的技术组合,完美实现了"在线编辑模板+动态文字/图表填充"的需求。其中最关键的突破是**"通过图表关系ID匹配段落,以标题作为指标关联标识"**,解决了POI-TL无法直接识别图表占位符的问题。
POI-TL的强大之处在于"简化了Word的复杂操作",让开发者无需深入理解Word的XML结构即可实现复杂填充;而OnlyOffice的集成则降低了业务人员的模板编辑门槛。两者结合,为企业级报告生成提供了高效、灵活的解决方案。
希望本文的开发经验能为有类似需求的同学提供参考,如有疑问欢迎在评论区交流!