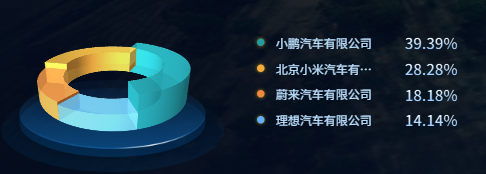
使用echarts-gl,图可以旋转,鼠标悬停会放大,变亮

html
<template>
    <div class="chart">
      <div class="chart-container">
        <div ref="chartRef" class="chart3d"></div>
        <!-- 底盘图片 -->
        <img src="@/assets/bs_images/dz.png" alt="" class="chart-base" />
      </div>

      <div class="chart-legend">
        <div v-for="(item, index) in seriesData" :key="index" class="legend-item">
          <span :style="{ backgroundColor: colors[index] }"></span>
          <span>{{ item.name }}</span>
          <span>{{ item.percent }}%</span>
        </div>
      </div>
    </div>
  </div>
</template>

<script setup lang="ts" name="MileageDistribution">
import { ref, onMounted, onBeforeUnmount } from 'vue'
import { getMileageDistribution } from "@/api/base/bigScreen/index"
import * as echarts from 'echarts'
import 'echarts-gl'

const chartRef = ref<HTMLDivElement | null>(null)
let chartInstance: echarts.ECharts | null = null

const colors = [
  'RGBA(36, 154, 163, 1)',
  'RGBA(245, 169, 64, 1)',
  'RGBA(240, 136, 64, 1)',
  'RGBA(100, 175, 252, 1)',
]

const seriesData = ref<{ name: string; value: number; percent: string; itemStyle?: any }[]>([])
let option: any = {} // 存储当前图表配置

// 拉取数据并渲染
const fetchAndRender = async () => {
  try {
    const res = await getMileageDistribution()
    const total = res.data.reduce((sum: number, item: any) => sum + item.value, 0)
    seriesData.value = res.data.map((item: any, i: number) => ({
      name: item.label,
      value: item.value,
      percent: total ? ((item.value / total) * 100).toFixed(2) : '0', // 百分比
      itemStyle: { color: colors[i % colors.length], opacity: 0.7 }
    }))

    if (chartInstance) {
      option = getPie3D(seriesData.value, 0.8)
      chartInstance.setOption(option)
      bindListen(chartInstance)
    }
  } catch (err) {
    console.error('获取里程分布失败', err)
  }
}

// 构造 3D 环图
const getPie3D = (pieData: any[], internalDiameterRatio: number) => {
  let series: any[] = []
  let sumValue = 0
  let startValue = 0
  let endValue = 0
  const k = 1 - internalDiameterRatio

  pieData.forEach(item => sumValue += item.value)

  pieData.forEach((item) => {
    endValue = startValue + item.value
    item.startRatio = startValue / sumValue
    item.endRatio = endValue / sumValue
    startValue = endValue

    series.push({
      name: item.name,
      type: 'surface',
      parametric: true,
      shading: 'realistic',
      wireframe: { show: false },
      itemStyle: { ...item.itemStyle },
      pieData: item,
      pieStatus: { selected: false, hovered: false, k },
      parametricEquation: getParametricEquation(item.startRatio, item.endRatio, false, false, k, item.value),
    })
  })

  return {
    tooltip: {
      formatter: (params: any) => {
        if (params.seriesName !== 'mouseoutSeries' && params.seriesName !== 'pie2d') {
          const bfb = ((series[params.seriesIndex].pieData.endRatio - series[params.seriesIndex].pieData.startRatio) * 100).toFixed(2)
          return (
            `${params.seriesName}<br/>` +
            `<span style="display:inline-block;margin-right:4px;border-radius:50%;width:8px;height:8px;background-color:${params.color};"></span>` +
            `${bfb}%`
          )
        }
        return ''
      },
    },
    xAxis3D: { min: -1, max: 1 },
    yAxis3D: { min: -1, max: 1 },
    zAxis3D: { min: -1, max: 1 },
    grid3D: {
      show: false,
      boxHeight: 10,
      boxWidth: 100,
      boxDepth: 100,
      environment: 'auto',
      light: {
        main: { intensity: 1.2, shadow: true },
        ambient: { intensity: 0.6 },
      },
      viewControl: { alpha: 25, distance: 200, rotateSensitivity: 0, zoomSensitivity: 0, panSensitivity: 0, autoRotate: true }
    },
    series
  }
}

// 扇形曲面方程
const getParametricEquation = (startRatio: number, endRatio: number, isSelected: boolean, isHovered: boolean, k: number, h: number) => {
  const midRatio = (startRatio + endRatio) / 2
  const startRadian = startRatio * Math.PI * 2
  const endRadian = endRatio * Math.PI * 2
  const midRadian = midRatio * Math.PI * 2

  if (startRatio === 0 && endRatio === 1) isSelected = false
  k = typeof k !== 'undefined' ? k : 1 / 3
  const offsetX = isSelected ? Math.cos(midRadian) * 0.1 : 0
  const offsetY = isSelected ? Math.sin(midRadian) * 0.1 : 0
  const hoverRate = isHovered ? 1.05 : 1

  return {
    u: { min: -Math.PI, max: Math.PI * 3, step: Math.PI / 32 },
    v: { min: 0, max: Math.PI * 2, step: Math.PI / 20 },
    x(u: number, v: number) {
      if (u < startRadian) return offsetX + Math.cos(startRadian) * (1 + Math.cos(v) * k) * hoverRate
      if (u > endRadian) return offsetX + Math.cos(endRadian) * (1 + Math.cos(v) * k) * hoverRate
      return offsetX + Math.cos(u) * (1 + Math.cos(v) * k) * hoverRate
    },
    y(u: number, v: number) {
      if (u < startRadian) return offsetY + Math.sin(startRadian) * (1 + Math.cos(v) * k) * hoverRate
      if (u > endRadian) return offsetY + Math.sin(endRadian) * (1 + Math.cos(v) * k) * hoverRate
      return offsetY + Math.sin(u) * (1 + Math.cos(v) * k) * hoverRate
    },
    z(u: number, v: number) {
      if (u < -Math.PI * 0.5) return Math.sin(u)
      if (u > Math.PI * 2.5) return Math.sin(u) * h * 0.1
      return Math.sin(v) > 0 ? 1 * h * 0.1 : -1
    }
  }
}

// 绑定点击/hover交互
const bindListen = (myChart: echarts.ECharts) => {
  let selectedIndex = ''
  let hoveredIndex = ''

  myChart.on('click', (params: any) => {
    let isSelected = !option.series[params.seriesIndex].pieStatus.selected
    let isHovered = option.series[params.seriesIndex].pieStatus.hovered
    let k = option.series[params.seriesIndex].pieStatus.k
    let startRatio = option.series[params.seriesIndex].pieData.startRatio
    let endRatio = option.series[params.seriesIndex].pieData.endRatio

    // 取消上次选中
    if (selectedIndex !== '' && selectedIndex !== params.seriesIndex) {
      let old = option.series[selectedIndex]
      old.parametricEquation = getParametricEquation(old.pieData.startRatio, old.pieData.endRatio, false, false, k, old.pieData.value)
      old.pieStatus.selected = false
    }

    option.series[params.seriesIndex].parametricEquation = getParametricEquation(startRatio, endRatio, isSelected, isHovered, k, option.series[params.seriesIndex].pieData.value)
    option.series[params.seriesIndex].pieStatus.selected = isSelected
    if (isSelected) selectedIndex = params.seriesIndex

    myChart.setOption(option)
  })

  myChart.on('mouseover', (params: any) => {
    if (hoveredIndex === params.seriesIndex) return
    if (hoveredIndex !== '') {
      let old = option.series[hoveredIndex]
      old.parametricEquation = getParametricEquation(old.pieData.startRatio, old.pieData.endRatio, old.pieStatus.selected, false, old.pieStatus.k, old.pieData.value)
      old.pieStatus.hovered = false
      hoveredIndex = ''
    }
    if (params.seriesName !== 'mouseoutSeries' && params.seriesName !== 'pie2d') {
      let cur = option.series[params.seriesIndex]
      cur.parametricEquation = getParametricEquation(cur.pieData.startRatio, cur.pieData.endRatio, cur.pieStatus.selected, true, cur.pieStatus.k, cur.pieData.value + 5)
      cur.pieStatus.hovered = true
      hoveredIndex = params.seriesIndex
    }
    myChart.setOption(option)
  })

  myChart.on('globalout', () => {
    if (hoveredIndex !== '') {
      let old = option.series[hoveredIndex]
      old.parametricEquation = getParametricEquation(old.pieData.startRatio, old.pieData.endRatio, old.pieStatus.selected, false, old.pieStatus.k, old.pieData.value)
      old.pieStatus.hovered = false
      hoveredIndex = ''
      myChart.setOption(option)
    }
  })
}

onMounted(() => {
  if (chartRef.value) {
    chartInstance = echarts.init(chartRef.value)
    fetchAndRender()
  }
})

onBeforeUnmount(() => {
  if (chartInstance) {
    chartInstance.dispose()
    chartInstance = null
  }
})
</script>