Squid 介绍
Squid Cache(简称 Squid)是一款开源、高性能的代理缓存服务器,支持 HTTP、HTTPS、FTP 等协议;它位于客户端与源站之间,将热门内容缓存在内存或磁盘中,以显著提升访问速度、减少带宽占用,并提供访问控制、日志审计、内容过滤等丰富功能,被广泛用于企业网关、CDN 边缘节点及运营商缓存场景。
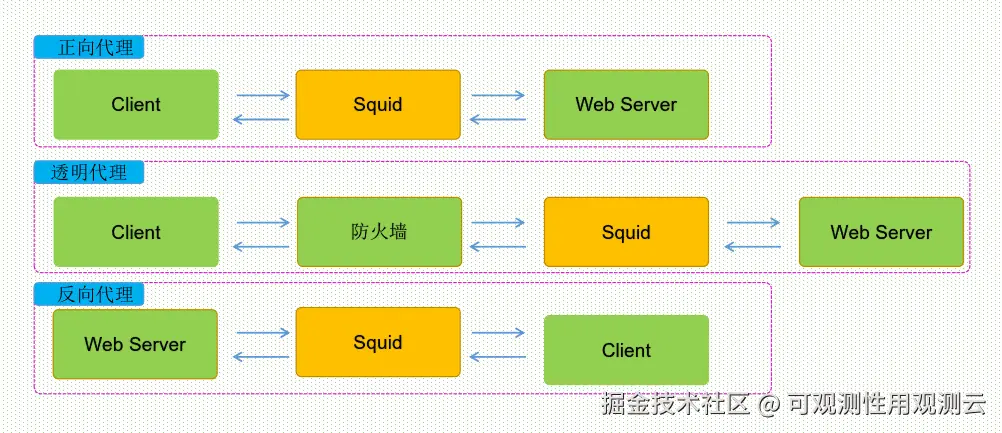
Squid 为网站提供了三种代理方式,如下:
| 代理模式 | 工作流程与描述 | 角色定位 | 典型应用场景 |
|---|---|---|---|
| 正向代理 (Forward Proxy) | Client → Squid → Web Server客户端显式配置代理,所有请求由 Squid 代为转发并返回结果。 | 客户端的代理代表内网用户对外发起请求,隐藏客户端信息。 | • 公司/校园出口翻墙 • 隐藏真实 IP • 缓存加速 • 上网审计 |
| 透明代理 (Transparent Proxy) | Client → 防火墙/网关 → Squid → Web Server网关无感知重定向流量,客户端零配置。 | 网络的中间人强制流量经过代理,对用户透明。 | • 网关级缓存 • 策略过滤 • 带宽节省 • 行为管理 |
| 反向代理(Reverse Proxy) | Client → Squid → 后端 Web Server客户端访问域名指向 Squid,Squid 转发请求到后端集群并返回结果。 | 服务器的代理代表后端服务器接收请求,隐藏源站。 | • 负载均衡 • 静态缓存加速 • WAF/SSL 终端 • 防攻击 |
Squid 监控通过采集 cache.log / access.log、squid-exporter Prometheus 指标 及 10 分钟滚动命中率 、DNS 查询量 等实时数据,统一接入观测云,实现命中率、流量、错误、FD/内存/磁盘资源的多维可视化和告警,让用户一眼看清缓存效率与系统瓶颈。
观测云
观测云是一款专为 IT 工程师打造的全链路可观测产品,它集成了基础设施监控、应用程序性能监控和日志管理,为整个技术栈提供实时可观察性。这款产品能够帮助工程师全面了解端到端的用户体验追踪,了解应用内函数的每一次调用,以及全面监控云时代的基础设施。此外,观测云还具备快速发现系统安全风险的能力,为数字化时代提供安全保障。
部署 DataKit
DataKit 是一个开源的、跨平台的数据收集和监控工具,由观测云开发并维护。它旨在帮助用户收集、处理和分析各种数据源,如日志、指标和事件,以便进行有效的监控和故障排查。DataKit 支持多种数据输入和输出格式,可以轻松集成到现有的监控系统中。
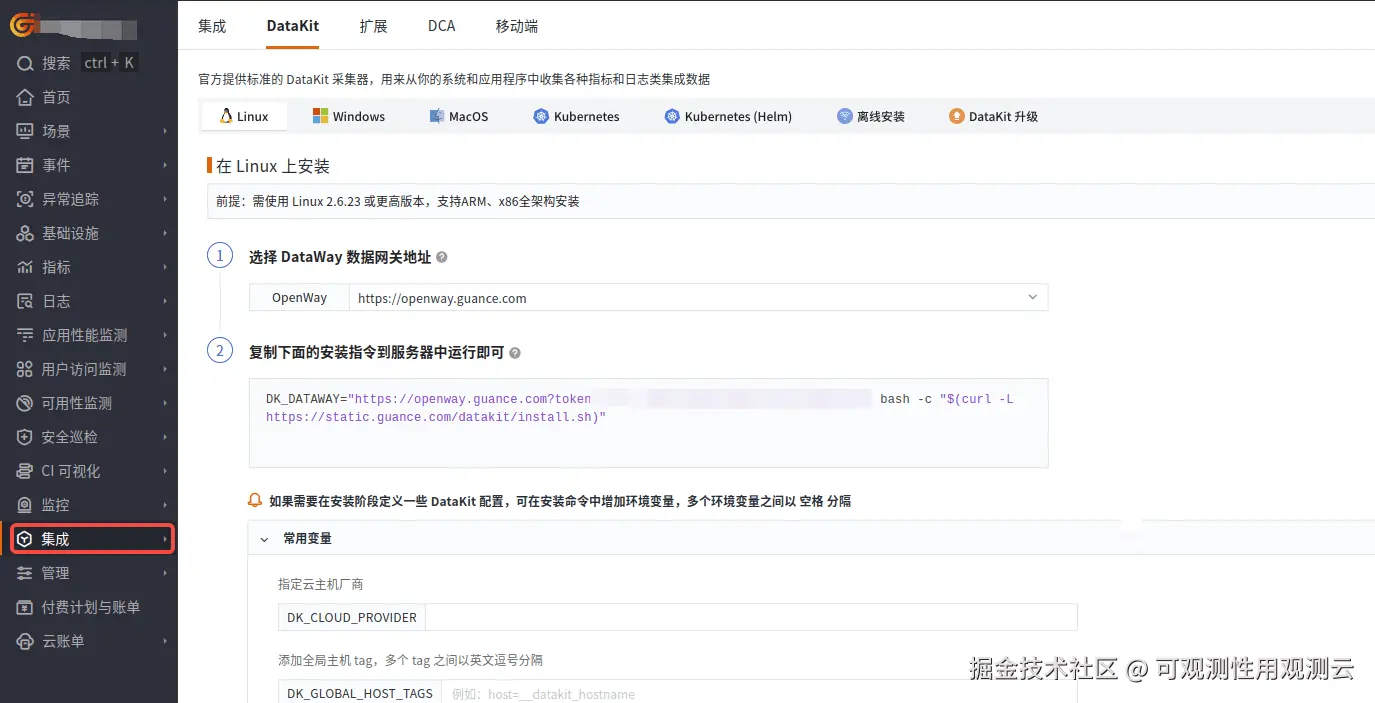
登录观测云控制台,在「集成」 - 「DataKit」选择对应安装方式,当前采用 Linux 主机部署 DataKit。
采集器配置
通过 squid-exporter 采集 Squid 的指标数据,DataKit 使用 prom 采集器接收 squid-exporter 发送的指标数据。
Squid 暴露指标
- 下载 squid-exporter
- 运行
squid-exporter
squid-exporter 暴露了 9301 端口,暴露 Prometheus 格式指标数据
bash
nohup ./squid-exporter -squid-hostname "localhost" -squid-port 3128 -listen ":9301" &Squid 指标采集
复制 prom.conf.sample 为 squid.conf
bash
cd /usr/local/datakit/conf.d/prom/
cp prom.conf.sample squid.conf
调整配置文件 squid.conf
ini
  ## Exporter URLs.
  urls = ["http://127.0.0.1:9301/metrics"]
  ## Stream Size.
  ## The source stream segmentation size, (defaults to 1).
  ## 0 source stream undivided.
  # stream_size = 1
  ## Unix Domain Socket URL. Using socket to request data when not empty.
  uds_path = ""
  ## Ignore URL request errors.
  ignore_req_err = false
  ## Collector alias.
  source = "squid-prom"
  ...
Squid 日志采集
squid 默认日志输出到 /var/log/squid 目录下:
- access.log: 访问日志
- cache.log: 缓存日志
进入 /usr/local/datakit/conf.d/samples 目录,执行以下命令:
bash
cp logging.conf.sample squid.conf调整配置文件:
ini
[[inputs.logging]]
  # List of log files, supports batch specification using glob patterns.
  # It is recommended to use absolute paths and specify file extensions.
  # Narrow the scope as much as possible to avoid collecting unexpected files.
  logfiles = [
    "/var/log/squid/access.log",
    "/var/log/squid/cache.log"
  ]
  ## Socket currently supports two protocols: tcp/udp. It is recommended to use internal
  ## network ports for security.
  sockets = [
   #"tcp://0.0.0.0:9540",
   #"udp://0.0.0.0:9541",
  ]
  # File path filtering using glob patterns, any file matching these patterns will not be collected
  ignore = [""]
  # Logging source, defaults to 'default' if empty
  source = "squid"
  ...
关键指标
| 指标 | 描述 | 单位 |
|---|---|---|
| client_http_errors_total | 客户端 HTTP 请求中返回错误(4xx/5xx)的总次数 | 次 |
| client_http_hit_kbytes_out_bytes_total | 客户端 HTTP 命中(HIT)时向外发送的流量 | KB |
| client_http_hits_total | 客户端 HTTP 请求缓存命中的总次数 | 次 |
| client_http_kbytes_in_kbytes_total | 客户端 HTTP 请求时从客户端接收的流量 | KB |
| client_http_kbytes_out_kbytes_total | 客户端 HTTP 请求时向客户端发送的流量 | KB |
| client_http_requests_total | 客户端 HTTP 请求的总次数 | 次 |
| exporter_build_info | Squid exporter 构建信息(版本、修订号等) | 无 |
| info_Available_number_of_file_descriptors | 当前可用文件描述符数量 | 个 |
| info_Average_HTTP_requests_per_minute_since_start | 自启动以来平均每分钟 HTTP 请求数 | 次/分钟 |
| info_Average_ICP_messages_per_minute_since_start | 自启动以来平均每分钟 ICP 消息数 | 次/分钟 |
| info_CPU_Time | Squid 进程累计消耗的 CPU 时间 | 秒 |
| info_CPU_Usage | 当前瞬时 CPU 使用百分比 | % |
| info_CPU_Usage_5_minute_avg | 最近 5 分钟平均 CPU 使用百分比 | % |
| info_CPU_Usage_60_minute_avg | 最近 60 分钟平均 CPU 使用百分比 | % |
| info_Disk_hits_as_pct_of_hit_requests_5min | 最近 5 分钟缓存命中里磁盘命中的占比 | % |
| info_Disk_hits_as_pct_of_hit_requests_60min | 最近 60 分钟缓存命中里磁盘命中的占比 | % |
| info_Files_queued_for_open | 等待打开文件的队列长度 | 个 |
| info_Hits_as_pct_of_all_requests_5min | 最近 5 分钟命中率(命中/总请求) | % |
| info_Hits_as_pct_of_all_requests_60min | 最近 60 分钟命中率 | % |
| info_Hits_as_pct_of_bytes_sent_5min | 最近 5 分钟命中流量占发送总流量的百分比 | % |
| info_Hits_as_pct_of_bytes_sent_60min | 最近 60 分钟命中流量占发送总流量的百分比 | % |
| info_Hot_Object_Cache_Items | 热对象缓存条目数量 | 个 |
| info_Largest_file_desc_currently_in_use | 当前使用中的最大文件描述符号 | 个 |
| info_Maximum_Resident_Size | Squid 进程最大常驻内存 | KB |
| info_Maximum_number_of_file_descriptors | 系统允许的最大文件描述符数量 | 个 |
| info_Mean_Object_Size | 缓存对象的平均大小 | KB |
| info_Memory_hits_as_pct_of_hit_requests_5min | 最近 5 分钟缓存命中里内存命中的占比 | % |
| info_Memory_hits_as_pct_of_hit_requests_60min | 最近 60 分钟缓存命中里内存命中的占比 | % |
| info_Number_of_HTCP_messages_received | 已接收的 HTCP 消息总数 | 次 |
| info_Number_of_HTCP_messages_sent | 已发送的 HTCP 消息总数 | 次 |
| info_Number_of_HTTP_requests_received | 已接收的 HTTP 请求总数 | 次 |
| info_Number_of_ICP_messages_received | 已接收的 ICP 消息总数 | 次 |
| info_Number_of_ICP_messages_sent | 已发送的 ICP 消息总数 | 次 |
| info_Number_of_clients_accessing_cache | 当前访问缓存的客户端数量 | 个 |
| info_Number_of_file_desc_currently_in_use | 当前已使用的文件描述符数量 | 个 |
| info_Number_of_queued_ICP_replies | 等待回复的 ICP 队列长度 | 个 |
| info_Request_failure_ratio | 请求失败率(失败/总请求) | % |
| info_Requests_given_to_unlinkd | 交给 unlinkd 删除的请求次数 | 次 |
| info_Reserved_number_of_file_descriptors | 预留的文件描述符数量 | 个 |
| info_Select_loop_called | select/poll 循环调用次数 | 次 |
| info_Storage_Mem_capacity | 内存缓存最大容量 | KB |
| info_Storage_Mem_size | 内存缓存当前已用容量 | KB |
| info_Storage_Swap_capacity | 磁盘缓存最大容量 | KB |
| info_Storage_Swap_size | 磁盘缓存当前已用容量 | KB |
| info_StoreEntries | 当前 Store 条目总数 | 个 |
| info_StoreEntries_with_MemObjects | 带内存对象的 Store 条目数 | 个 |
| info_Store_Disk_files_open | 当前打开的磁盘文件数量 | 个 |
| info_Total_accounted | Squid 进程已分配内存总量 | KB |
| info_UP_Time | Squid 进程自启动以来的运行时间 | 秒 |
| info_memPoolAlloc_calls | memPool 分配调用次数 | 次 |
| info_memPoolFree_calls | memPool 释放调用次数 | 次 |
| info_on_disk_objects | 当前落盘对象数量 | 个 |
| info_service | Squid 服务状态标识(1=运行中,0=停止) | 无 |
| server_all_errors_total | 所有后端(HTTP/FTP/其他)错误总次数 | 次 |
| server_all_kbytes_in_kbytes_total | 所有后端接收流量 | KB |
| server_all_kbytes_out_kbytes_total | 所有后端发送流量 | KB |
| server_all_requests_total | 所有后端请求总次数 | 次 |
| server_ftp_errors_total | FTP 后端错误次数 | 次 |
| server_ftp_kbytes_in_kbytes_total | FTP 后端接收流量 | KB |
| server_ftp_kbytes_out_kbytes_total | FTP 后端发送流量 | KB |
| server_ftp_requests_total | FTP 后端请求次数 | 次 |
| server_http_errors_total | HTTP 后端错误次数 | 次 |
| server_http_kbytes_in_kbytes_total | HTTP 后端接收流量 | KB |
| server_http_kbytes_out_kbytes_total | HTTP 后端发送流量 | KB |
| server_http_requests_total | HTTP 后端请求次数 | 次 |
| server_other_errors_total | 其他协议后端错误次数 | 次 |
| server_other_kbytes_in_kbytes_total | 其他协议后端接收流量 | KB |
| server_other_kbytes_out_kbytes_total | 其他协议后端发送流量 | KB |
| server_other_requests_total | 其他协议后端请求次数 | 次 |
| swap_files_cleaned_total | 清理的 swap 文件总数 | 个 |
| swap_ins_total | swap in(磁盘 → 内存)次数 | 次 |
| swap_outs_total | swap out(内存 → 磁盘)次数 | 次 |
| up | exporter 成功抓取 Squid 指标时为 1,失败为 0 | 无 |
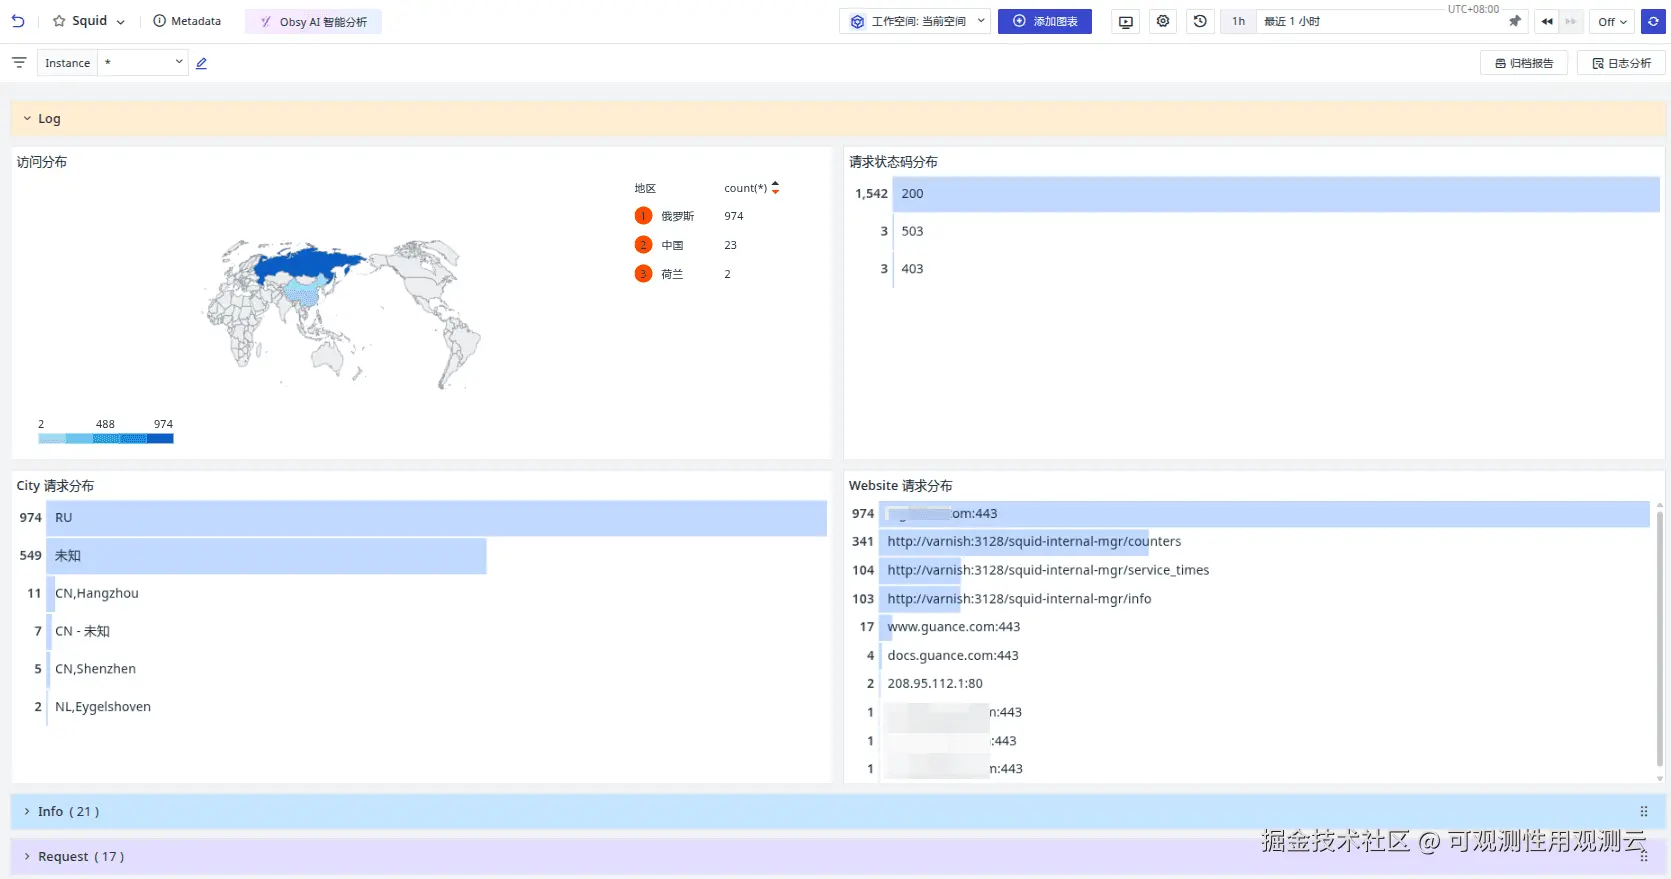
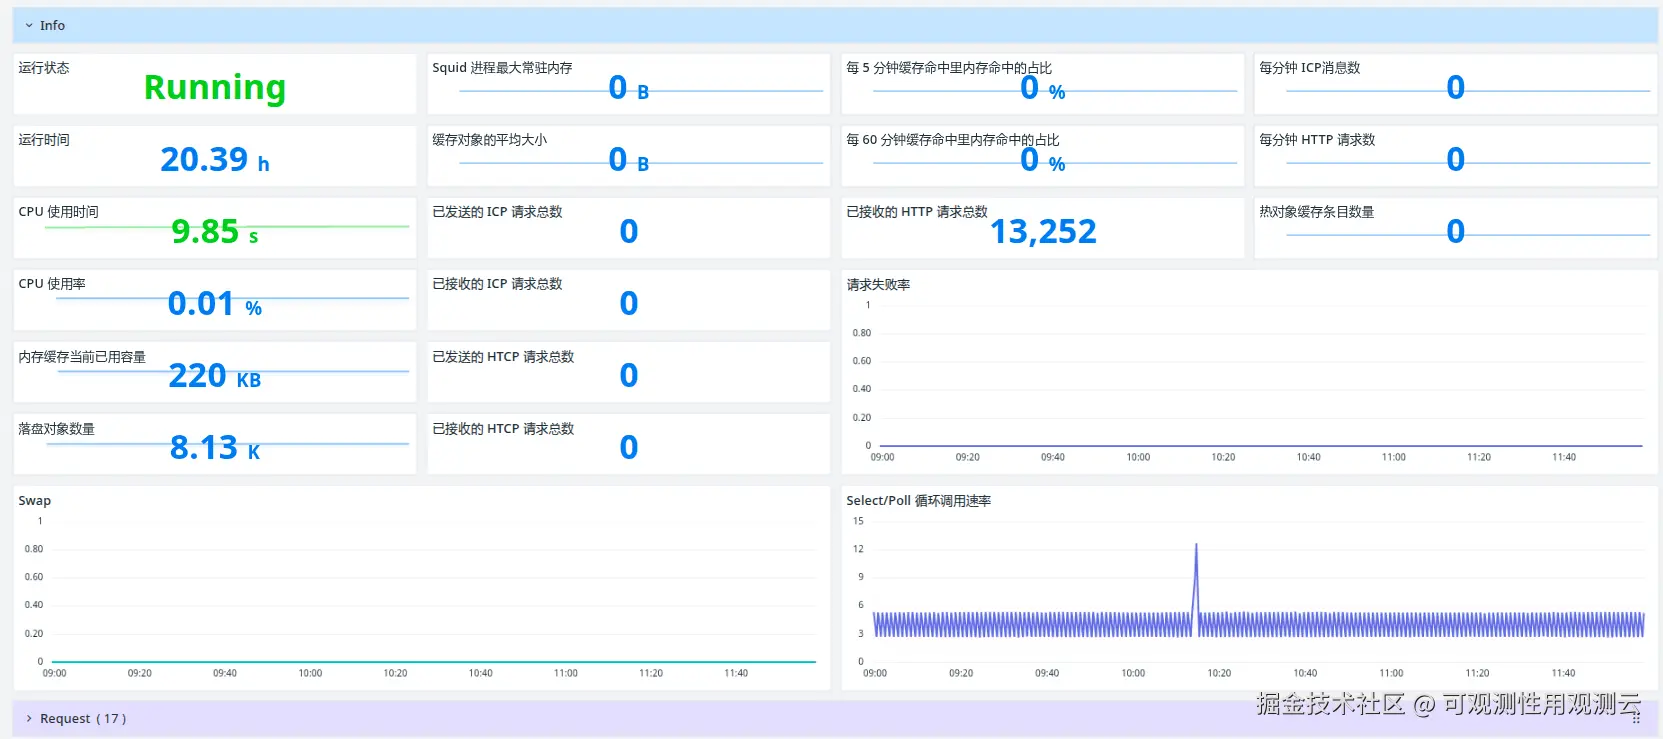
场景视图
登录观测云控制台,点击「场景」 -「新建仪表板」,输入 "Squid", 选择 "Squid",点击 "确定" 即可添加视图。
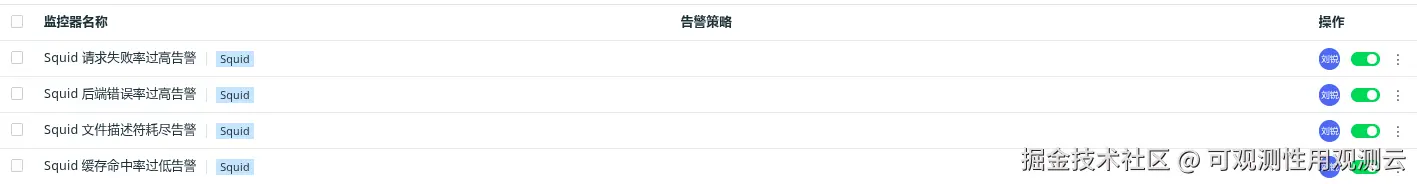
监控器(告警)
观测云内置了监控器模板,可以选择从模版创建监控器,并开启适合业务的监控器以及时通知相关成员关注问题,触发条件、频率等信息可以依据实际业务进行调整。
登录观测云控制台,点击「监控」 -「新建监控器」,输入 "Squid", 选择对应的监控器,点击 "确定" 即可添加。
总结
观测云对 Squid-Cache 的监控采用「日志+指标」一体化方案:自动采集 access.log/cache.log 与 squid-exporter Prometheus 指标,实时计算 5 min/60 min 命中率、DNS 查询量、磁盘/内存/FD 使用率等关键 KPI,并在图形仪表盘一键展示,同时内置低命中率、FD 耗尽、后端错误率等多级告警模板,帮助运维在 1 分钟内发现缓存异常并定位根因。