目录
[一. 简介](#一. 简介)
[二. 组件介绍](#二. 组件介绍)
[Prometheus Exporter:监控数据的"出口"](#Prometheus Exporter:监控数据的“出口”)
[Thanos:让 Prometheus 拥有"云原生大脑"](#Thanos:让 Prometheus 拥有“云原生大脑”)
[Alertmanager Webhook:告警的自动化中转站](#Alertmanager Webhook:告警的自动化中转站)
[Prometheus & Thanos Sidecar](#Prometheus & Thanos Sidecar)
[Thanos Query & Thanos Store的代理](#Thanos Query & Thanos Store的代理)
[Prometheus Exporters](#Prometheus Exporters)
[Alertmanager Webhook](#Alertmanager Webhook)
[Thanos Store & Thanos Compact](#Thanos Store & Thanos Compact)
[Thanos Query Web UI](#Thanos Query Web UI)
[Prometheus Web UI](#Prometheus Web UI)
[Alertmanager Web UI](#Alertmanager Web UI)
[Grafana Web UI](#Grafana Web UI)
一. 简介
在现代云原生环境中,监控系统已成为保障服务稳定性和性能的核心基础设施。无论是Kubernetes 集群、微服务架构,还是传统应用迁移上云,Prometheus + Thanos + Grafana + Alertmanager 已成为事实上的标准组合。
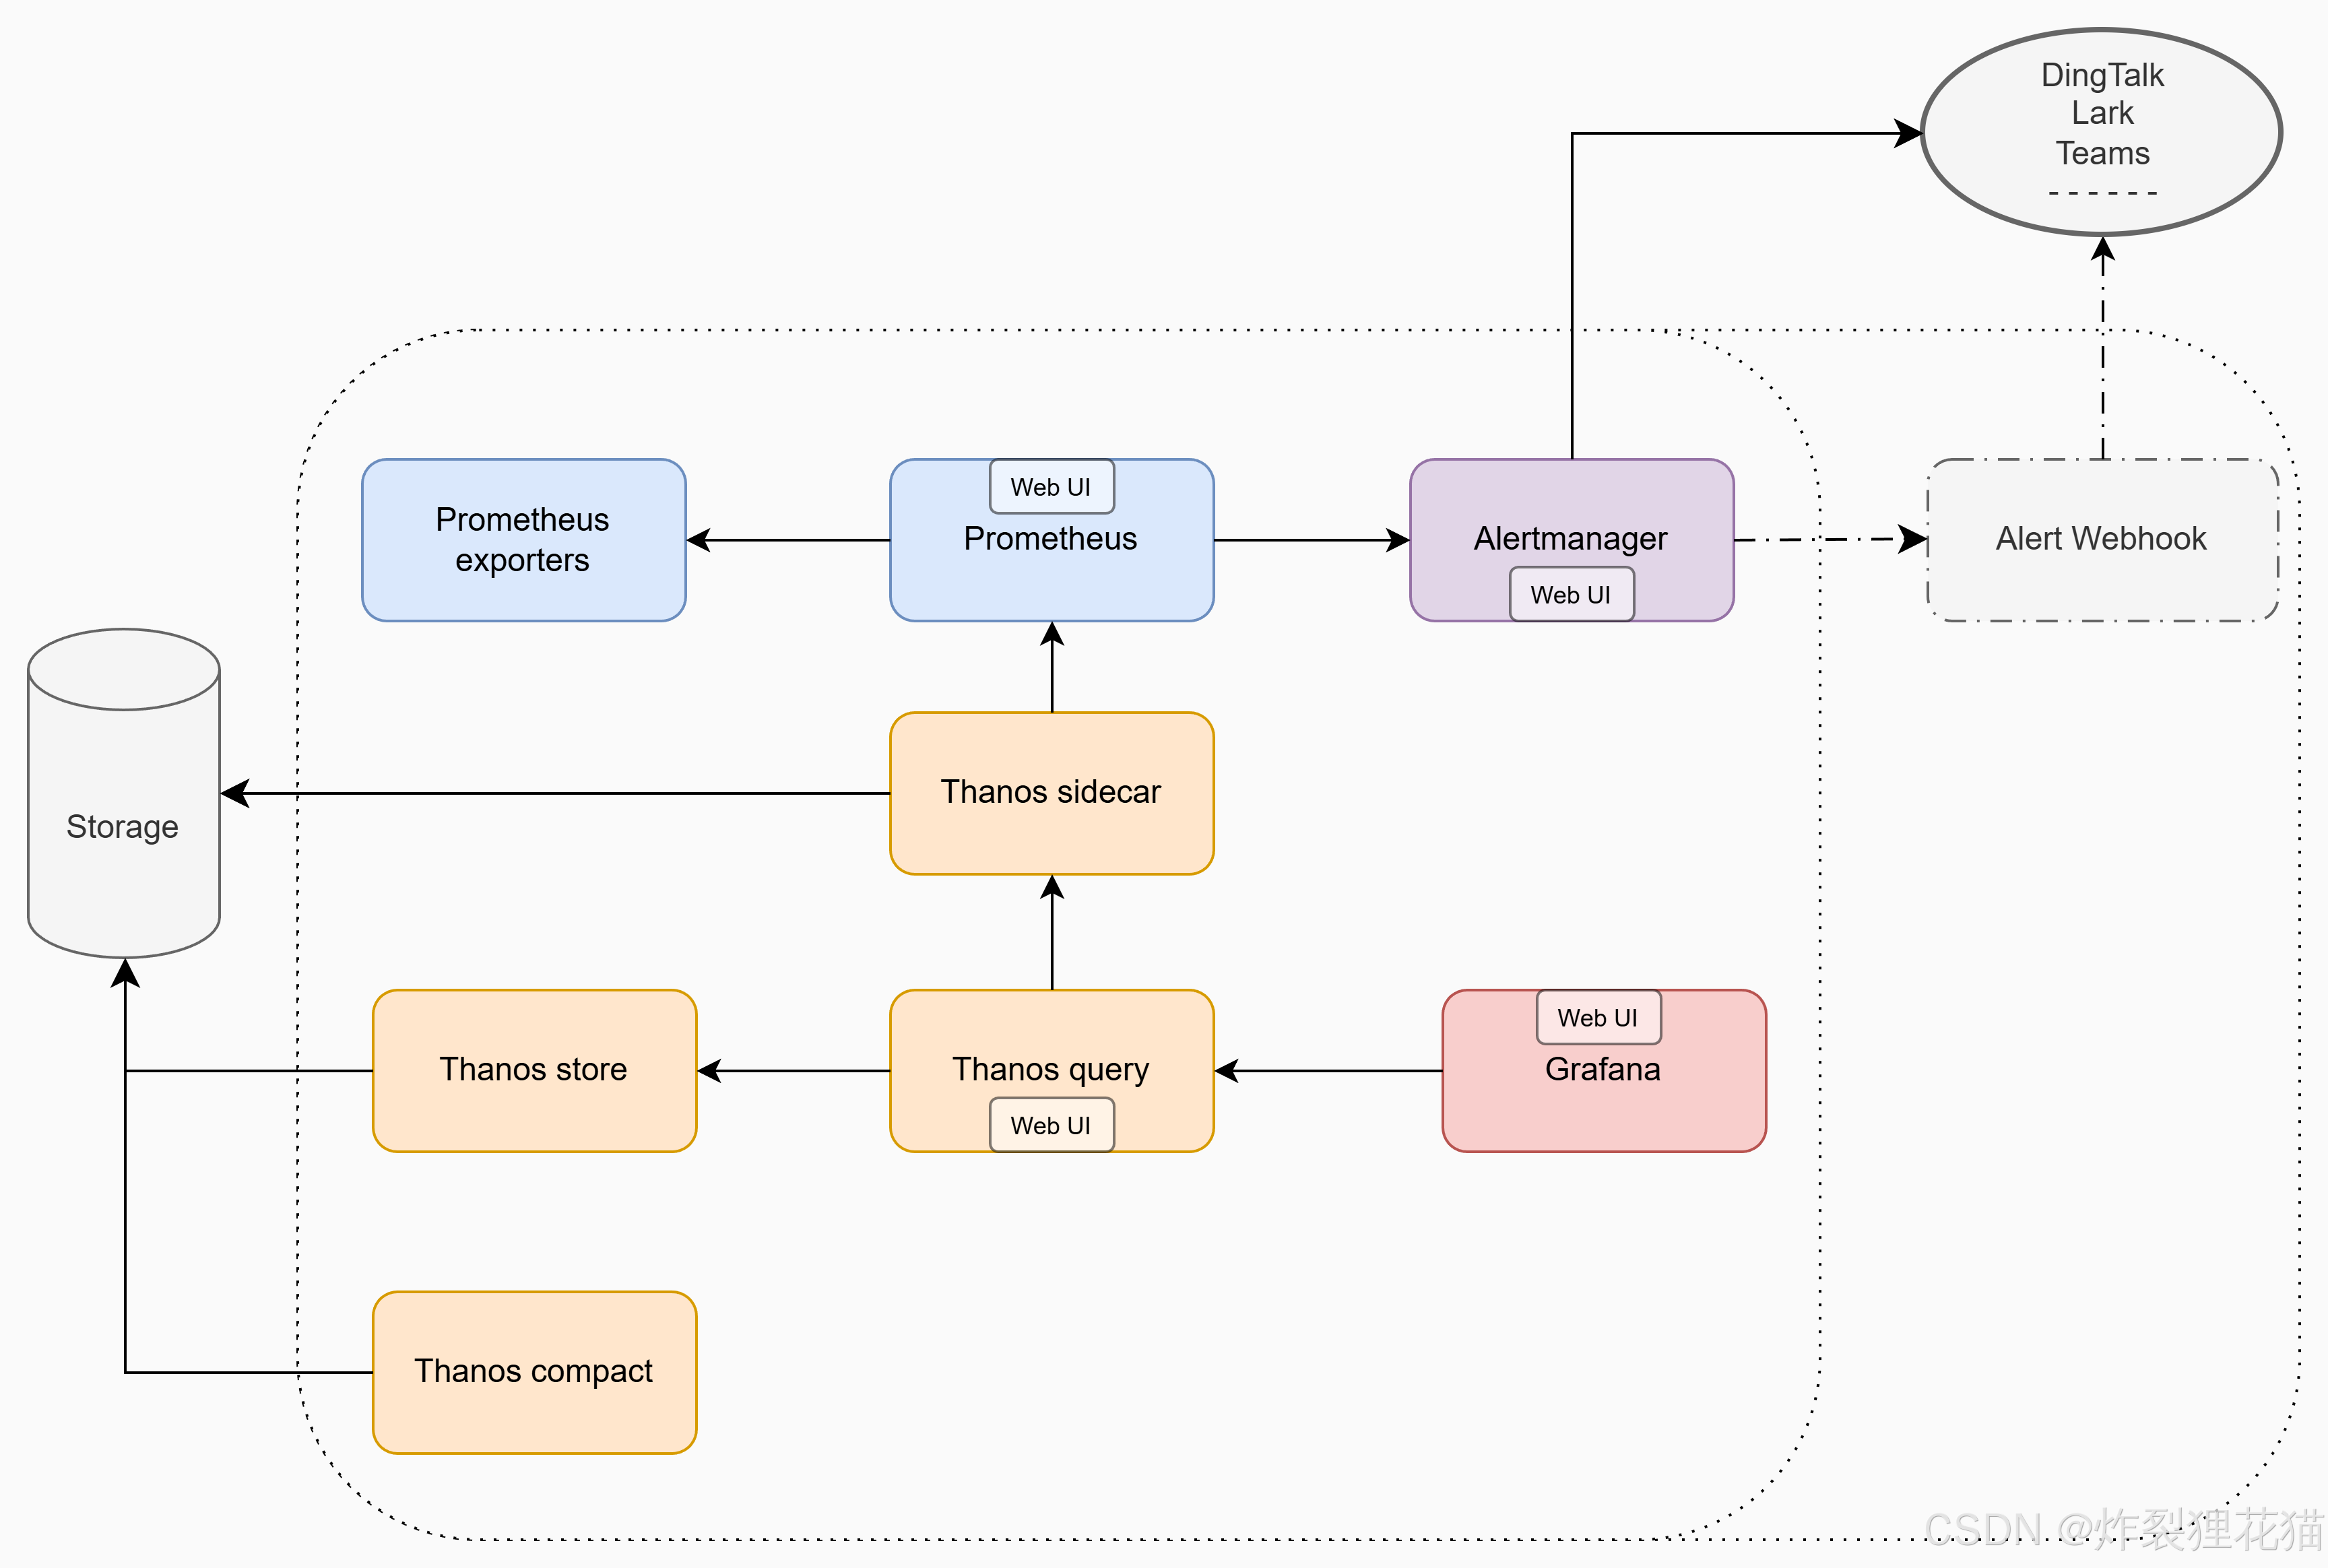
二. 组件介绍
如上图的数据访问流所示,我们围绕这一套监控体系,梳理各组件的作用、关系和常见架构思路,为大家提供一个系统性的理解。
Prometheus:监控的核心采集与存储引擎
Prometheus是整个体系的核心,主要负责:
-
周期性地拉取(Scrape)各监控目标(Targets)数据;
-
存储时间序列数据;
-
提供 PromQL 查询接口;
-
支持告警规则的评估与推送。
其特点包括:
-
Pull 模式采集:通过配置
scrape_configs定期抓取指标; -
时序数据库(TSDB):内置高性能本地存储;
-
强大的查询语言(PromQL**)**:支持聚合、筛选、预测等多种分析;
-
无外部依赖:单个二进制文件即可运行。
Prometheus Exporter:监控数据的"出口"
Prometheus本身并不会直接采集应用程序内部指标,而是通过各种Exporter来暴露数据,由Prometheus定时通过Pull模式采集。
Prometheus Exporter常见类型包括:
-
Node Exporter:采集主机级别指标(CPU、内存、磁盘、网络);
-
Kube-State-Metrics:采集Kubernetes对象状态;
-
Blackbox Exporter:通过HTTP/ICMP等方式探测可用性;
-
自定义 Exporter:应用通过SDK或HTTP接口暴露自定义指标。
Thanos:让 Prometheus拥有"云原生大脑"
Prometheus 的一个限制是:单节点存储、无全局聚合、数据保留有限。而Thanos正是为了解决这些问题而生的。
Thanos 通过一系列组件扩展了 Prometheus 的能力:
| 组件 | 作用 |
|---|---|
| Thanos Sidecar | 部署在每个 Prometheus 旁,负责几件事: 1.将 Prometheus 的数据上传到远程对象存储(S3、OSS、GCS等); 2.代理Prometheus提供gRPC接口供Query查询; 3. |
| Thanos Store | 从对象存储读取历史数据,并提供统一查询接口。 |
| Thanos Query | 聚合多个数据源(Store + Sidecar等),实现全局查询。 |
| Thanos Compact | 对长期存储的数据进行压缩、合并、降采样,降低成本。 |
| Thanos Ruler(可选) | 支持全局层面的告警规则与录制规则执行。 |
这样,整个监控体系具备了以下能力:
-
多 Prometheus 实例统一查询
-
长期历史数据归档
-
水平扩展与多集群支持
-
云对象存储持久化
Alertmanager:智能告警与聚合管理
Alertmanager负责处理来自Prometheus的告警。其核心功能包括:
-
告警去重、分组、抑制;
-
动态路由(不同告警发送到不同的通知渠道);
-
通知集成(Email、Slack、Webhook、飞书、钉钉等);
-
与 Prometheus 联动的告警状态反馈。
通常 Prometheus会通过alerting配置将规则触发后的Alert推送给Alertmanager,后者根据路由规则执行通知。
Alertmanager Webhook:告警的自动化中转站
除了直接发送通知,Alertmanager 还可以通过Webhook将告警事件发送到外部系统。
Webhook 机制非常灵活,常用于:
-
对接自动化运维(如自动重启服务、触发脚本);
-
与告警平台对接(如企业微信、飞书机器人、自建系统);
-
记录到数据库或事件系统(如 ELK / Loki / ClickHouse)。
Webhook的核心是:"当告警发生时,调用一个外部HTTP服务,传递完整的告警内容。"
Grafana:监控数据的可视化前端
Grafana是整个体系的"展示层"。它支持直接连接Prometheus或Thanos Query,实现以下功能:
-
自定义仪表盘与多维度可视化;
-
支持 PromQL 查询与模板变量;
-
动态过滤、聚合、时间范围切换;
-
与 Alerting 集成(Grafana 8+ 内置告警功能)。
在企业中,Grafana 通常作为监控大屏、系统状态总览、运维日报的核心入口。
三.部署及配置
我们以在Kubernetes中的部署为例,把所有配置文件罗列出来,只要稍作修改即可运行。
另外,为熟悉Kubernetes的更多用法,以及分担磁盘IO压力,我们把Thanos store和Thanos compact单独部署到一台服务器上,然后用Kubernetes Service+ Endpoints做代理(当然也可以完全部署到Kubernetes中,可以自行修改部署方式)。
对Kubernetes不太熟悉的至少看完Kubernetes从零到精通(14-Storage)
Prometheus & Thanos Sidecar
bash
apiVersion: v1
kind: ConfigMap
metadata:
  name: prometheus-config
  namespace: thanos
data:
  prometheus.yaml.tmpl: |-
    global:
      scrape_interval: 30s
      evaluation_interval: 30s
      external_labels:
        cluster: oci-prometheus-ha
        prometheus_replica: oci-$(POD_NAME)
    rule_files:
    - /etc/prometheus/rules/*rules.yaml
    alerting:
      alertmanagers:
      - static_configs:
        - targets:
          - alertmanager.thanos:9093
      alert_relabel_configs:
      - regex: prometheus_replica
        action: labeldrop

    scrape_configs:
      - job_name: iccr-production-applications-nodes-metrics
        file_sd_configs:
        - files:
          - "/etc/prometheus/targets/nodes.json"
          refresh_interval: 5m
        relabel_configs:
        - target_label: provider
          replacement: oci

      - job_name: iccr-production-kubernetes-nodes-metrics
        kubernetes_sd_configs:
        - role: pod
        relabel_configs:
        - action: keep
          regex: true
          source_labels:
          - __meta_kubernetes_pod_annotation_prometheus_io_scrape
        - action: replace
          regex: (.+)
          source_labels:
          - __meta_kubernetes_pod_annotation_prometheus_io_path
          target_label: __metrics_path__
        - action: replace
          regex: ([^:]+)(?::\d+)?;(\d+)
          replacement: $1:$2
          source_labels:
          - __address__
          - __meta_kubernetes_pod_annotation_prometheus_io_port
          target_label: __address__
        - action: labelmap
          regex: __meta_kubernetes_pod_label_(.+)
        - action: replace
          source_labels:
          - __meta_kubernetes_namespace
          target_label: kubernetes_namespace
        - action: replace
          source_labels:
          - __meta_kubernetes_pod_name
          target_label: kubernetes_pod_name
        - target_label: provider
          replacement: oci

      - job_name: iccr-production-kubernetes-control-plane-metrics
        kubernetes_sd_configs:
        - role: node
        bearer_token_file: /var/run/secrets/kubernetes.io/serviceaccount/token
        relabel_configs:
        - action: labelmap
          regex: __meta_kubernetes_node_label_(.+)
        - replacement: kubernetes.default.svc:443
          target_label: __address__
        - regex: (.+)
          replacement: /api/v1/nodes/$1/proxy/metrics
          source_labels:
          - __meta_kubernetes_node_name
          target_label: __metrics_path__
        - target_label: app
          replacement: iccr-production-kubernetes-nodes
        - target_label: provider
          replacement: oci
        scheme: https
        tls_config:
          ca_file: /var/run/secrets/kubernetes.io/serviceaccount/ca.crt
          insecure_skip_verify: true

      - job_name: iccr-production-containers-metrics
        metrics_path: /metrics/cadvisor
        scrape_interval: 10s
        scrape_timeout: 10s
        scheme: https
        tls_config:
          insecure_skip_verify: true
        bearer_token_file: /var/run/secrets/kubernetes.io/serviceaccount/token
        kubernetes_sd_configs:
        - role: node
        relabel_configs:
        - action: labelmap
          regex: __meta_kubernetes_node_label_(.+)
        - target_label: provider
          replacement: oci
        metric_relabel_configs:
        - source_labels: [instance]
          separator: ;
          regex: (.+)
          target_label: node
          replacement: $1
          action: replace

      - job_name: iccr-production-kubernetes-service-metrics
        kubernetes_sd_configs:
        - role: service
        metrics_path: /probe
        params:
          module:
          - tcp_connect
        relabel_configs:
        - action: keep
          regex: true
          source_labels:
          - __meta_kubernetes_service_annotation_prometheus_io_httpprobe
        - source_labels:
          - __address__
          target_label: __param_target
        - replacement: blackbox-exporter-svc:9115
          target_label: __address__
        - source_labels:
          - __param_target
          target_label: instance
        - action: labelmap
          regex: __meta_kubernetes_service_label_(.+)
        - source_labels:
          - __meta_kubernetes_namespace
          target_label: kubernetes_namespace
        - source_labels:
          - __meta_kubernetes_service_name
          target_label: kubernetes_name
        - target_label: provider
          replacement: oci

      - job_name: iccr-production-kube-state-metrics
        honor_timestamps: true
        metrics_path: /metrics
        scheme: http
        static_configs:
        - targets:
          - kube-state-metrics:8080
        relabel_configs:
        - target_label: provider
          replacement: oci
        metric_relabel_configs:
        - target_label: cluster
          replacement: iccr-production-oke

      - job_name: iccr-production-mysqld-metrics
        static_configs:
        - targets:
          - mysqld-exporter-svc:9104
        relabel_configs:
        - source_labels: [__address__]
          target_label: __param_target
        - source_labels: [__param_target]
          target_label: instance
        - target_label: __address__
          replacement: mysqld-exporter-svc:9104
        - target_label: provider
          replacement: oci

      - job_name: iccr-production-redis-metrics
        static_configs:
        - targets:
          - redis://prod-redis-0:6379
          - redis://prod-redis-1:6379
        metrics_path: /scrape
        relabel_configs:
        - source_labels: [__address__]
          target_label: __param_target
        - source_labels: [__param_target]
          target_label: instance
        - target_label: __address__
          replacement: redis-exporter-svc:9121
        - target_label: provider
          replacement: oci

      - job_name: iccr-production-kafka-metrics
        static_configs:
        - targets:
          - kafka-exporter-svc:8080
        relabel_configs:
        - target_label: provider
          replacement: oci

      - job_name: iccr-production-zookeeper-metrics
        static_configs:
        - targets:
          - zookeeper-exporter-svc:9141
        relabel_configs:
        - target_label: provider
          replacement: oci

      - job_name: iccr-production-nacos-metrics
        metrics_path: /nacos/actuator/prometheus
        static_configs:
        - targets:
          - prod-nacos-0:8848
          - prod-nacos-1:8848
          - prod-nacos-2:8848
        relabel_configs:
        - target_label: provider
          replacement: oci

      - job_name: blackbox-web-probe
        scrape_interval: 1m
        metrics_path: /probe
        params:
          module:
          - http_2xx
        relabel_configs:
        - source_labels:
          - __address__
          target_label: __param_target
        - source_labels:
          - __param_target
          target_label: instance
        - replacement: blackbox-exporter-svc.thanos:9115
          target_label: __address__
        - target_label: provider
          replacement: oci
        static_configs:
        - targets:
          - https://zt.fzwtest.xyz

---
apiVersion: v1
kind: ConfigMap
metadata:
  labels:
    name: prometheus-rules
  name: prometheus-rules
  namespace: thanos
data:
  alert-rules.yaml: |-
    groups:
    - name: host_and_hardware.rules
      rules:
      - alert: StaticInstanceTargetMissing
        expr: up{instance=~".*:9100"} == 0
        for: 1m
        labels:
          env: production
          severity: critical
        annotations:
          description: "A Static Instance {{ $labels.instance }} on job {{ $labels.job }} has disappeared. Exporter might be crashed or Instance is down."
      - alert: HostOutOfDiskSpace
        expr: (1- node_filesystem_avail_bytes{job!="kubernetes-pods",mountpoint!~"^/(dev|proc|sys|run|var/lib/docker/|var/lib/nfs/.+)($|/).*"} / node_filesystem_size_bytes {job!="kubernetes-pods",mountpoint!~"^/(dev|proc|sys|run|var/lib/docker/|var/lib/nfs/.+)($|/).*"} ) * 100 > 80
        for: 5m
        labels:
          env: production
          severity: warning
        annotations:
          description: "Node {{ $labels.instance }} on job {{ $labels.job }} disk {{ $labels.device }} is almost full (< 20% left). Current value is {{ printf \"%.0f\" $value }}%."
      - alert: HostOutOfMemory
        expr: node_memory_MemAvailable_bytes / node_memory_MemTotal_bytes * 100 < 10
        for: 1m
        labels:
          env: production
          severity: critical
        annotations:
          description: "Node {{ $labels.instance }} on job {{ $labels.job }} memory is filling up (< 10% left). Current value is {{ printf \"%.0f\" $value }}%."
      - alert: HostUnusualDiskReadRate
        expr: sum by (instance,job) (rate(node_disk_read_bytes_total[2m])) / 1024 / 1024 > 50
        for: 5m
        labels:
          env: production
          severity: warning
        annotations:
          description: "Node {{ $labels.instance }} on job {{ $labels.job }} disk is probably reading too much data (> 50 MB/s). Current value is {{ printf \"%.0f\" $value }}MB/s."
      - alert: HostUnusualDiskWriteRate
        expr: sum by (instance,job) (rate(node_disk_written_bytes_total[2m])) / 1024 / 1024 > 50
        for: 5m
        labels:
          env: production
          severity: warning
        annotations:
          description: "Node {{ $labels.instance }} on job {{ $labels.job }} disk is probably writing too much data (> 50 MB/s). Current value is {{ printf \"%.0f\" $value }}MB/s."
      - alert: HostUnusualDiskReadLatency
        expr: rate(node_disk_read_time_seconds_total{instance!="prod-monitoring-system-thanos-store-0:9100"}[1m]) / rate(node_disk_reads_completed_total{instance!="prod-monitoring-system-thanos-store-0:9100"}[1m]) > 0  and rate(node_disk_reads_completed_total{instance!="prod-monitoring-system-thanos-store-0:9100"}[1m]) > 0
        for: 5m
        labels:
          env: production
          severity: warning
        annotations:
          description: "Node {{ $labels.instance }} on job {{ $labels.job }} disk latency is growing (read operations > 100ms). Current value is {{ printf \"%.0f\" $value }}."
      - alert: HostUnusualDiskWriteLatency
        expr: rate(node_disk_write_time_seconds_total{instance!="prod-monitoring-system-thanos-store-0:9100"}[1m]) / rate(node_disk_writes_completed_total{instance!="prod-monitoring-system-thanos-store-0:9100"}[1m]) > 0.1 and rate(node_disk_writes_completed_total{instance!="prod-monitoring-system-thanos-store-0:9100"}[1m]) > 0
        for: 5m
        labels:
          env: production
          severity: warning
        annotations:
          description: "Node {{ $labels.instance }} on job {{ $labels.job }} disk latency is growing (write operations > 100ms). Current value is {{ printf \"%.0f\" $value }}."
      - alert: HostHighCpuLoad
        expr: 100 - (avg by(instance,job) (rate(node_cpu_seconds_total{mode="idle"}[2m])) * 100) > 80
        for: 5m
        labels:
          env: production
          severity: warning
        annotations:
          description: "Node {{ $labels.instance }} on job {{ $labels.job }} CPU load is > 80%. Current value is {{ printf \"%.0f\" $value }}%"
      - alert: HostConntrackLimit
        expr: node_nf_conntrack_entries / node_nf_conntrack_entries_limit > 0.8
        for: 5m
        labels:
          env: production
          severity: warning
        annotations:
          description: "The number of conntrack is approching limit on node {{ $labels.instance }} of job {{ $labels.job }}. Current value is {{ printf \"%.0f\" $value }}."
      - alert: HostMemoryUnderMemoryPressure
        expr: rate(node_vmstat_pgmajfault[1m]) > 1000
        for: 5m
        labels:
          env: production
          severity: warning
        annotations:
          description: "Node {{ $labels.instance }} on job {{ $labels.job }} is under heavy memory pressure. High rate of major page faults."
      - alert: HostUnusualNetworkThroughputIn
        expr: sum by (instance,job) (rate(node_network_receive_bytes_total[2m])) / 1024 / 1024 > 100
        for: 5m
        labels:
          env: production
          severity: warning
        annotations:
          description: "Node {{ $labels.instance }} on job {{ $labels.job }} network interfaces are probably receiving too much data (> 100 MB/s). Current value is {{ printf \"%.0f\" $value }}."
      - alert: HostUnusualNetworkThroughputOut
        expr: sum by (instance,job) (rate(node_network_transmit_bytes_total[2m])) / 1024 / 1024 > 100
        for: 5m
        labels:
          env: production
          severity: warning
        annotations:
          description: "Node {{ $labels.instance }} on job {{ $labels.job }} network interfaces are probably sending too much data (> 100 MB/s). Current value is {{ printf \"%.0f\" $value }}."
      - alert: HostCpuStealNoisyNeighbor
        expr: avg by(instance,job) (rate(node_cpu_seconds_total{mode="steal"}[5m])) * 100 > 30
        for: 5m
        labels:
          env: production
          severity: warning
        annotations:
          description: "Node {{ $labels.instance }} on job {{ $labels.job }} CPU steal is > 30%. A noisy neighbor is killing VM performances or a spot instance may be out of credit. Current value is {{ printf \"%.0f\" $value }}%."
      - alert: HostOomKillDetected
        expr: increase(node_vmstat_oom_kill[1m]) > 3
        for: 0m
        labels:
          env: production
          severity: warning
        annotations:
          description: "Node {{ $labels.instance }} on job {{ $labels.job }} OOM kill detected."
      - alert: HostNetworkTransmitErrors
        expr: rate(node_network_transmit_errs_total{device=~"ens[3|5]"}[2m]) / rate(node_network_transmit_packets_total{device=~"ens[3|5]"}[2m]) > 0.01
        for: 2m
        labels:
          env: production
          severity: warning
        annotations:
          description: "Node {{ $labels.instance }} on job {{ $labels.job }} interface {{ $labels.device }} has encountered {{ printf \"%.0f\" $value }} transmit errors in the last two minutes."
      - alert: WebsiteDown
        expr:  probe_success != 1
        for: 3m
        labels:
          env: production
          severity: critical
        annotations:
          summary: "Website {{ $labels.instance }} is unavailable"
          description: "Blackbox probe failed for {{ $labels.instance }} in {{ $labels.kubernetes_namespace }}"

---
apiVersion: v1
kind: ConfigMap
metadata:
  name: prometheus-targets
  namespace: thanos
data:
  nodes.json: |-
    [
        {
            "targets": ["prod-kafka-0:9100", "prod-kafka-1:9100", "prod-kafka-2:9100"],
            "labels": {
                "app": "iccr-production-kafka-nodes"
            }
        },
        {
            "targets": ["prod-zookeeper-0:9100", "prod-zookeeper-1:9100", "prod-zookeeper-2:9100"],
            "labels": {
                "app": "iccr-production-zookeeper-nodes"
            }
        },
        {
            "targets": ["prod-nacos-0:9100", "prod-nacos-1:9100", "prod-nacos-2:9100"],
            "labels": {
                "app": "iccr-production-nacos-nodes"
            }
        },
        {
            "targets": ["prod-redis-0:9100", "prod-redis-1:9100"],
            "labels": {
                "app": "iccr-production-redis-nodes"
            }
        },
        {
            "targets": ["prod-monitoring-system-thanos-store-0:9100"],
            "labels": {
                "app": "monitoring-system-nodes"
            }
        }
    ]

---
apiVersion: v1
kind: ServiceAccount
metadata:
  name: prometheus
  namespace: thanos

---
apiVersion: rbac.authorization.k8s.io/v1
kind: ClusterRole
metadata:
  name: prometheus
  namespace: thanos
rules:
- apiGroups: [""]
  resources:
  - nodes
  - nodes/proxy
  - nodes/metrics
  - services
  - endpoints
  - pods
  verbs: ["get", "list", "watch"]
- apiGroups: [""]
  resources: ["configmaps"]
  verbs: ["get"]
- nonResourceURLs: ["/metrics"]
  verbs: ["get"]

---
apiVersion: rbac.authorization.k8s.io/v1
kind: ClusterRoleBinding
metadata:
  name: prometheus
subjects:
  - kind: ServiceAccount
    name: prometheus
    namespace: thanos
roleRef:
  kind: ClusterRole
  name: prometheus
  apiGroup: rbac.authorization.k8s.io

---
apiVersion: apps/v1
kind: StatefulSet
metadata:
  name: prometheus
  namespace: thanos
  labels:
    app.kubernetes.io/name: prometheus
spec:
  serviceName: prometheus-svc
  podManagementPolicy: Parallel
  replicas: 1
  selector:
    matchLabels:
      app.kubernetes.io/name: prometheus
  template:
    metadata:
      labels:
        app.kubernetes.io/name: prometheus
    spec:
      serviceAccountName: prometheus
      securityContext:
        fsGroup: 2000
        runAsNonRoot: true
        runAsUser: 1000
      affinity:
        podAntiAffinity:
          requiredDuringSchedulingIgnoredDuringExecution:
          - labelSelector:
              matchExpressions:
              - key: app.kubernetes.io/name
                operator: In
                values:
                - prometheus
            topologyKey: kubernetes.io/hostname
      hostAliases:
      - ip: "10.x.x.x"
        hostnames:
        - "prod-kafka-0"
      - ip: "10.x.x.x"
        hostnames:
        - "prod-kafka-1"
      - ip: "10.x.x.x"
        hostnames:
        - "prod-kafka-2"
      - ip: "10.x.x.x"
        hostnames:
        - "prod-nacos-0"
      - ip: "10.x.x.x"
        hostnames:
        - "prod-nacos-1"
      - ip: "10.x.x.x"
        hostnames:
        - "prod-nacos-2"
      - ip: "10.x.x.x"
        hostnames:
        - "prod-redis-0"
      - ip: "10.x.x.x"
        hostnames:
        - "prod-redis-1"
      - ip: "10.x.x.x"
        hostnames:
        - "prod-zookeeper-0"
      - ip: "10.x.x.x"
        hostnames:
        - "prod-zookeeper-1"
      - ip: "10.x.x.x"
        hostnames:
        - "prod-zookeeper-2"
      - ip: "10.x.x.x"
        hostnames:
        - "prod-monitoring-system-thanos-store-0"
      containers:
      - name: prometheus
        image: quay.io/prometheus/prometheus:v3.5.0
        args:
        - --config.file=/etc/prometheus/config_out/prometheus.yaml
        - --storage.tsdb.path=/prometheus
        - --storage.tsdb.retention.time=6h
        - --storage.tsdb.no-lockfile
        - --storage.tsdb.min-block-duration=2h
        - --storage.tsdb.max-block-duration=2h
        - --web.enable-admin-api
        - --web.enable-lifecycle
        - --web.route-prefix=/
        resources:
          requests:
            memory: "2Gi"
            cpu: "1000m"
          limits:
            memory: "4Gi"
            cpu: "2000m"
        ports:
        - containerPort: 9090
          name: web
          protocol: TCP
        volumeMounts:
        - name: prometheus-config-out
          mountPath: /etc/prometheus/config_out
        - name: prometheus-rules
          mountPath: /etc/prometheus/rules
        - name: prometheus-targets
          mountPath: /etc/prometheus/targets
        - name: prometheus-storage
          mountPath: /prometheus
      - name: thanos-sidecar
        image: quay.io/thanos/thanos:v0.39.2
        args:
        - sidecar
        - --tsdb.path=/prometheus
        - --prometheus.url=http://127.0.0.1:9090
        - --objstore.config-file=/etc/thanos/objectstorage.yaml
        - --reloader.config-file=/etc/prometheus/config/prometheus.yaml.tmpl
        - --reloader.config-envsubst-file=/etc/prometheus/config_out/prometheus.yaml
        - --reloader.rule-dir=/etc/prometheus/rules/
        - --grpc-address=0.0.0.0:10901
        - --http-address=0.0.0.0:10902
        env:
        - name: POD_NAME
          valueFrom:
            fieldRef:
              fieldPath: metadata.name
        ports:
        - name: http-sidecar
          containerPort: 10902
        - name: grpc
          containerPort: 10901
        livenessProbe:
          httpGet:
            port: 10902
            path: /-/healthy
        readinessProbe:
          httpGet:
            port: 10902
            path: /-/ready
        volumeMounts:
        - name: prometheus-config-tmpl
          mountPath: /etc/prometheus/config
        - name: prometheus-config-out
          mountPath: /etc/prometheus/config_out
        - name: prometheus-targets
          mountPath: /etc/prometheus/targets
        - name: prometheus-rules
          mountPath: /etc/prometheus/rules
        - name: prometheus-storage
          mountPath: /prometheus
        - name: thanos-objectstorage-secret
          subPath: objectstorage.yaml
          mountPath: /etc/thanos/objectstorage.yaml
      volumes:
      - name: prometheus-config-tmpl
        configMap:
          name: prometheus-config
      - name: prometheus-config-out
        emptyDir: {}
      - name: prometheus-rules
        configMap:
          name: prometheus-rules
      - name: prometheus-targets
        configMap:
          name: prometheus-targets
      - name: thanos-objectstorage-secret
        secret:
          secretName: thanos-objectstorage-secret
  volumeClaimTemplates:
  - metadata:
      name: prometheus-storage
      labels:
        app.kubernetes.io/name: prometheus
      annotations:
        volume.beta.kubernetes.io/storage-class: oci-bv
    spec:
      accessModes:
      - ReadWriteOnce
      resources:
        requests:
          storage: 50Gi
      volumeMode: Filesystem

---
kind: Service
apiVersion: v1
metadata:
  name: prometheus-svc
  namespace: thanos
  labels:
    app.kubernetes.io/name: prometheus
spec:
  type: ClusterIP
  clusterIP: None
  selector:
    app.kubernetes.io/name: prometheus
  ports:
  - name: web
    protocol: TCP
    port: 9090
    targetPort: web

---
kind: Service
apiVersion: v1
metadata:
  name: thanos-sidecar-svc
  namespace: thanos
  labels:
    app.kubernetes.io/name: prometheus
spec:
  selector:
    app.kubernetes.io/name: prometheus
  type: ClusterIP
  clusterIP: None
  ports:
  - name: grpc
    port: 10901
    targetPort: grpc
Thanos Query & Thanos Store的代理
bash
apiVersion: v1
kind: Secret
metadata:
  name: thanos-objectstorage-secret
  namespace: thanos
type: Opaque
stringData:
  objectstorage.yaml: |
    type: OCI
    config:
      provider: "raw"
      bucket: "prd-monitoring-system-oci"
      compartment_ocid: "ocid1.compartment.oc1..xxxxxxxxx"
      tenancy_ocid: "ocid1.tenancy.oc1..xxxxxxxx"
      user_ocid: "ocid1.user.oc1..xxxxxxxx"
      region: "ap-singapore-1"
      fingerprint: "xx:xx:xx:xx:xx:xx:xx:xx:xx:xx:xx:xx:xx:xx:xx:xx"
      privatekey: "-----BEGIN PRIVATE KEY-----\nxxxxxxxxx\n-----END PRIVATE KEY-----\n"

---
apiVersion: v1
kind: Endpoints
metadata:
  name: thanos-store-svc
  namespace: thanos
subsets:
- addresses:
  - ip: 10.1.10.191
  ports:
  - name: thanos-store-grpc
    port: 10911
    protocol: TCP
---
apiVersion: v1
kind: Service
metadata:
  labels:
    app: thanos-store
  name: thanos-store-svc
  namespace: thanos
spec:
  type: ClusterIP
  clusterIP: None
  ports:
  - name: thanos-store-grpc
    port: 10911
    targetPort: 10911

---
apiVersion: apps/v1
kind: Deployment
metadata:
  name: thanos-query
  namespace: thanos
  labels:
    app: thanos-query
spec:
  replicas: 1
  selector:
    matchLabels:
      app: thanos-query
  template:
    metadata:
      labels:
        app: thanos-query
    spec:
      affinity:
        podAntiAffinity:
          preferredDuringSchedulingIgnoredDuringExecution:
          - podAffinityTerm:
              labelSelector:
                matchExpressions:
                - key: app
                  operator: In
                  values:
                  - thanos-query
              topologyKey: kubernetes.io/hostname
            weight: 100
      containers:
      - name: thanos-query
        image: quay.io/thanos/thanos:v0.39.2
        args:
        - query
        - --query.auto-downsampling
        - --grpc-address=0.0.0.0:10901
        - --http-address=0.0.0.0:10903
        - --query.partial-response
        - --query.replica-label=prometheus_replica
        - --endpoint=dnssrv+_grpc._tcp.thanos-sidecar-svc.thanos:10901
        - --endpoint=dnssrv+_thanos-store-grpc._tcp.thanos-store-svc.thanos
        livenessProbe:
          failureThreshold: 4
          httpGet:
            path: /-/healthy
            port: 10903
            scheme: HTTP
          periodSeconds: 30
        ports:
        - containerPort: 10901
          name: grpc
        - containerPort: 10903
          name: http
        resources:
          requests:
            memory: "1Gi"
            cpu: "250m"
          limits:
            memory: "2Gi"
            cpu: "1000m"
        readinessProbe:
          failureThreshold: 20
          httpGet:
            path: /-/ready
            port: 10903
            scheme: HTTP
          periodSeconds: 5
        terminationMessagePolicy: FallbackToLogsOnError
      terminationGracePeriodSeconds: 120

---
apiVersion: v1
kind: Service
metadata:
  name: thanos-query-svc
  namespace: thanos
  labels:
    app: thanos-query-svc
spec:
  ports:
  - name: grpc
    port: 10901
    targetPort: grpc
  - name: http
    port: 10903
    targetPort: http
  selector:
    app: thanos-query

---
apiVersion: v1
kind: Service
metadata:
  name: thanos-query
  namespace: thanos
  labels:
    app: thanos-query
spec:
  ports:
  - name: grpc
    port: 10901
    targetPort: grpc
  - name: http
    port: 10903
    targetPort: http
    nodePort: 30090
  selector:
    app: thanos-query
  type: NodePort
Prometheus Exporters
bash
apiVersion: apps/v1
kind: DaemonSet
metadata:
  name: node-exporter
  namespace: thanos
  labels:
    app: node-exporter
spec:
  selector:
    matchLabels:
      app: node-exporter
  template:
    metadata:
      labels:
        app: node-exporter
      annotations:
         prometheus.io/scrape: "true"
         prometheus.io/port: "9100"
    spec:
      hostPID: true
      hostIPC: true
      hostNetwork: true
      containers:
      - name: node-exporter
        image: prom/node-exporter:v1.6.0
        args:
          - --path.procfs=/host/proc
          - --path.sysfs=/host/sys
          - --collector.filesystem.ignored-mount-points=^/(sys|proc|dev|run|rootfs)($|/)
          - --collector.filesystem.ignored-fs-types="^(autofs|binfmt_misc|cgroup|configfs|debugfs|devpts|devtmpfs|fusectl|hugetlbfs|mqueue|overlay|proc|procfs|pstore|rpc_pipefs|securityfs|sysfs|tracefs)$"
          - --collector.diskstats.ignored-devices="^(ram|loop|fd|nsfs|tmpfs|(h|s|v|xv)d[a-z]|nvme\\d+n\\d+p)\\d+$"
        ports:
          - containerPort: 9100
            protocol: TCP
        resources:
          limits:
            cpu: 100m
            memory: 100Mi
          requests:
            cpu: 10m
            memory: 100Mi
        volumeMounts:
          - name: dev
            mountPath: /host/dev
          - name: proc
            mountPath: /host/proc
          - name: sys
            mountPath: /host/sys
          - name: rootfs
            mountPath: /rootfs
      volumes:
        - name: proc
          hostPath:
            path: /proc
        - name: dev
          hostPath:
            path: /dev
        - name: sys
          hostPath:
            path: /sys
        - name: rootfs
          hostPath:
            path: /
---
apiVersion: v1
kind: Service
metadata:
  annotations:
    prometheus.io/scrape: "true"
  name: node-exporter-svc
  namespace: thanos
  labels:
    app: node-exporter
spec:
  ports:
  - name: metrics
    port: 9100
    protocol: TCP
    targetPort: 9100
    nodePort: 31000
  selector:
    app: node-exporter
  sessionAffinity: None
  type: NodePort

---
apiVersion: rbac.authorization.k8s.io/v1
kind: ClusterRoleBinding
metadata:
  name: kube-state-metrics
roleRef:
  apiGroup: rbac.authorization.k8s.io
  kind: ClusterRole
  name: kube-state-metrics
subjects:
- kind: ServiceAccount
  name: kube-state-metrics
  namespace: thanos
---
apiVersion: rbac.authorization.k8s.io/v1
kind: ClusterRole
metadata:
  name: kube-state-metrics
rules:
- apiGroups: [""]
  resources:
  - configmaps
  - secrets
  - nodes
  - pods
  - services
  - resourcequotas
  - replicationcontrollers
  - limitranges
  - persistentvolumeclaims
  - persistentvolumes
  - namespaces
  - endpoints
  verbs: ["list", "watch"]
- apiGroups: ["extensions"]
  resources:
  - daemonsets
  - deployments
  - replicasets
  verbs: ["list", "watch"]
- apiGroups: ["apps"]
  resources:
  - statefulsets
  verbs: ["list", "watch"]
- apiGroups: ["batch"]
  resources:
  - cronjobs
  - jobs
  verbs: ["list", "watch"]
- apiGroups: ["autoscaling"]
  resources:
  - horizontalpodautoscalers
  verbs: ["list", "watch"]
---
apiVersion: rbac.authorization.k8s.io/v1
kind: RoleBinding
metadata:
  name: kube-state-metrics
  namespace: thanos
roleRef:
  apiGroup: rbac.authorization.k8s.io
  kind: Role
  name: kube-state-metrics-resizer
subjects:
- kind: ServiceAccount
  name: kube-state-metrics
  namespace: thanos
---
apiVersion: rbac.authorization.k8s.io/v1
kind: Role
metadata:
  namespace: thanos
  name: kube-state-metrics-resizer
rules:
- apiGroups: [""]
  resources:
  - pods
  verbs: ["get"]
- apiGroups: ["extensions"]
  resources:
  - deployments
  resourceNames: ["kube-state-metrics"]
  verbs: ["get", "update"]
---
apiVersion: v1
kind: ServiceAccount
metadata:
  name: kube-state-metrics
  namespace: thanos
---
apiVersion: apps/v1
kind: Deployment
metadata:
  name: kube-state-metrics
  namespace: thanos
spec:
  selector:
    matchLabels:
      app: kube-state-metrics
  replicas: 1
  template:
    metadata:
      labels:
        app: kube-state-metrics
    spec:
      serviceAccountName: kube-state-metrics
      containers:
      - name: kube-state-metrics
        image: registry.k8s.io/kube-state-metrics/kube-state-metrics:v2.9.2
        ports:
        - name: http-metrics
          containerPort: 8080
        - name: telemetry
          containerPort: 8081
        readinessProbe:
          httpGet:
            path: /healthz
            port: 8080
          initialDelaySeconds: 5
          timeoutSeconds: 5

---
apiVersion: v1
kind: Service
metadata:
  name: kube-state-metrics
  namespace: thanos
  labels:
    app: kube-state-metrics
  annotations:
    prometheus.io/scrape: 'true'
spec:
  ports:
  - name: http-metrics
    port: 8080
    targetPort: http-metrics
    protocol: TCP
  - name: telemetry
    port: 8081
    targetPort: telemetry
    protocol: TCP
  selector:
    app: kube-state-metrics

---
apiVersion: v1
kind: ConfigMap
metadata:
  name: blackbox-exporter-configmap
  namespace: thanos
  labels:
    app: blackbox-exporter-configmap
data:
  config.yml: |
    modules:
      http_2xx:
        prober: http
        timeout: 30s
        http:
          valid_http_versions: ["HTTP/1.1", "HTTP/2.0"]
          valid_status_codes: []  # Defaults to 2xx
          method: GET
          no_follow_redirects: false
          fail_if_ssl: false
          fail_if_not_ssl: false
          preferred_ip_protocol: "ip4" # defaults to "ip6"
      tcp_connect:
        prober: tcp
        timeout: 30s
      dns:
        prober: dns
        dns:
          transport_protocol: "tcp"  # 默认是 udp
          preferred_ip_protocol: "ip4"  # 默认是 ip6
          query_name: "kubernetes.default.svc.cluster.local"
      http_actuator:
        prober: http
        timeout: 30s
        http:
          valid_http_versions: ["HTTP/1.1", "HTTP/2.0"]
          valid_status_codes: []  # Defaults to 2xx
          method: GET
          no_follow_redirects: false
          fail_if_ssl: false
          fail_if_not_ssl: false
          preferred_ip_protocol: "ip4" # defaults to "ip6"
          fail_if_body_not_matches_regexp:
            - "UP"
---
apiVersion: apps/v1
kind: Deployment
metadata:
  name: blackbox-exporter
  namespace: thanos
  labels:
    app: blackbox-exporter
spec:
  replicas: 1
  selector:
    matchLabels:
      app: blackbox-exporter
  template:
    metadata:
      labels:
        app: blackbox-exporter
    spec:
      containers:
      - name: blackbox-exporter
        image: prom/blackbox-exporter
        imagePullPolicy: IfNotPresent
        volumeMounts:
        - name: blackbox-exporter-config
          mountPath: /etc/blackbox_exporter/
        ports:
        - name: http
          containerPort: 9115
      volumes:
      - name: blackbox-exporter-config
        configMap:
          name: blackbox-exporter-configmap

---
apiVersion: v1
kind: Service
metadata:
  name: blackbox-exporter-svc
  namespace: thanos
  labels:
    app: blackbox-exporter-svc
spec:
  ports:
  - name: http
    port: 9115
    protocol: TCP
    targetPort: 9115
  selector:
    app: blackbox-exporter

---
apiVersion: apps/v1
kind: Deployment
metadata:
  name: kafka-exporter
  namespace: thanos
  labels:
    app: kafka-exporter
spec:
  replicas: 1
  selector:
    matchLabels:
      app: kafka-exporter
  template:
    metadata:
      labels:
        app: kafka-exporter
    spec:
      hostAliases:
      - hostnames:
        - prod-kafka-0
        ip: 10.x.x.x
      - hostnames:
        - prod-kafka-1
        ip: 10.x.x.x
      - hostnames:
        - prod-kafka-2
        ip: 10.x.x.x
      containers:
      - image: redpandadata/kminion:v2.2.3
        imagePullPolicy: IfNotPresent
        name: kafka-exporter
        ports:
        - containerPort: 8080
        env:
        - name: KAFKA_BROKERS
          value: prod-kafka-0:9092
      restartPolicy: Always

---
apiVersion: v1
kind: Service
metadata:
  name: kafka-exporter-svc
  namespace: thanos
  labels:
    app: kafka-exporter-svc
spec:
  ports:
  - port: 8080
    targetPort: 8080
  selector:
    app: kafka-exporter

---
apiVersion: apps/v1
kind: Deployment
metadata:
  name: mysqld-exporter
  namespace: thanos
  labels:
    app: mysqld-exporter
spec:
  replicas: 1
  selector:
    matchLabels:
      app: mysqld-exporter
  template:
    metadata:
      labels:
        app: mysqld-exporter
    spec:
      securityContext:
        fsGroup: 2000
        runAsNonRoot: true
        runAsUser: 1000
      containers:
      - name: mysqld-exporter
        image: prom/mysqld-exporter:v0.12.1
        imagePullPolicy: IfNotPresent
        args:
        - --collect.info_schema.tables
        - --collect.info_schema.innodb_metrics
        - --collect.global_status
        - --collect.global_variables
        - --collect.slave_status
        - --collect.info_schema.processlist
        - --collect.perf_schema.tablelocks
        - --collect.perf_schema.eventsstatements
        - --collect.perf_schema.eventsstatementssum
        - --collect.perf_schema.eventswaits
        - --collect.auto_increment.columns
        - --collect.binlog_size
        - --collect.perf_schema.tableiowaits
        - --collect.perf_schema.indexiowaits
        - --collect.info_schema.userstats
        - --collect.info_schema.clientstats
        - --collect.info_schema.tablestats
        - --collect.info_schema.schemastats
        - --collect.perf_schema.file_events
        - --collect.perf_schema.file_instances
        - --collect.info_schema.innodb_cmp
        - --collect.info_schema.innodb_cmpmem
        - --collect.info_schema.query_response_time
        - --collect.engine_innodb_status
        env:
        - name: DATA_SOURCE_NAME
          value: "exporter:xxxxx@@(10.x.x.x:3306)/"
        ports:
        - containerPort: 9104
          name: http
          protocol: TCP
---
apiVersion: v1
kind: Service
metadata:
  name: mysqld-exporter-svc
  namespace: thanos
  labels:
    app: mysqld-exporter-svc
spec:
  selector:
    app: mysqld-exporter
  ports:
  - name: http
    port: 9104
    targetPort: http

---
apiVersion: apps/v1
kind: Deployment
metadata:
  name: zookeeper-exporter
  namespace: thanos
  labels:
    app: zookeeper-exporter
spec:
  replicas: 1
  selector:
    matchLabels:
      app: zookeeper-exporter
  template:
    metadata:
      labels:
        app: zookeeper-exporter
    spec:
      hostAliases:
      - hostnames:
        - prod-zookeeper-0
        ip: 10.x.x.x
      - hostnames:
        - prod-zookeeper-1
        ip: 10.x.x.x
      - hostnames:
        - prod-zookeeper-2
        ip: 10.x.x.x
      containers:
      - name: zookeeper-exporter
        image: dabealu/zookeeper-exporter:latest
        imagePullPolicy: IfNotPresent
        ports:
        - containerPort: 9141
        args: ["-zk-hosts","prod-zookeeper-0:2181,prod-zookeeper-1:2181,prod-zookeeper-2:2181"]
      restartPolicy: Always

---
apiVersion: v1
kind: Service
metadata:
  name: zookeeper-exporter-svc
  namespace: thanos
  labels:
    app: zookeeper-exporter-svc
spec:
  ports:
  - port: 9141
    targetPort: 9141
  selector:
    app: zookeeper-exporter
---
apiVersion: apps/v1
kind: Deployment
metadata:
  name: redis-exporter
  namespace: thanos
  labels:
    app: redis-exporter
spec:
  replicas: 1
  selector:
    matchLabels:
      app: redis-exporter
  template:
    metadata:
      labels:
        app: redis-exporter
    spec:
      hostAliases:
      - hostnames:
        - "prod-redis-0"
        ip: "10.x.x.x"
      - hostnames:
        - "prod-redis-1"
        ip: "10.x.x.x"
      containers:
      - name: redis-exporter
        image: oliver006/redis_exporter:latest
        ports:
        - name: http
          protocol: TCP
          containerPort: 9121
        securityContext:
          runAsUser: 1000
          runAsGroup: 2000
          allowPrivilegeEscalation: false

---
apiVersion: v1
kind: Service
metadata:
  name: redis-exporter-svc
  namespace: thanos
  labels:
    app: redis-exporter-svc
spec:
  selector:
    app: redis-exporter
  ports:
  - name: http
    port: 9121
    targetPort: http
Grafana
bash
apiVersion: v1
kind: ConfigMap
metadata:
  labels:
    app: grafana
  name: grafana-cm
  namespace: thanos
data:
  dashboardproviders.yaml: |
    apiVersion: 1
    providers:
    - disableDeletion: false
      editable: true
      folder: ""
      name: default
      options:
        path: /var/lib/grafana/dashboards/default
      orgId: 1
      type: file
  grafana.ini: |
    [analytics]
    check_for_updates = true
    [log]
    mode = console
    [paths]
    data = /var/lib/grafana/
    logs = /var/log/grafana
    plugins = /var/lib/grafana/plugins
    provisioning = /etc/grafana/provisioning
  plugins: digrich-bubblechart-panel,grafana-clock-panel

---
apiVersion: v1
kind: PersistentVolumeClaim
metadata:
  labels:
    app: grafana
  name: grafana-pvc
  namespace: thanos
spec:
  accessModes:
  - ReadWriteOnce
  resources:
    requests:
      storage: 50Gi
  storageClassName: oci-bv

---
apiVersion: v1
kind: Secret
metadata:
  labels:
    app: grafana
  name: grafana-secret
  namespace: thanos
type: Opaque
data:
  admin-password: xxxxxxxxx
  admin-user: YWRtaW4=

---
apiVersion: apps/v1
kind: Deployment
metadata:
  name: grafana
  namespace: thanos
  labels:
    app: grafana
spec:
  replicas: 1
  selector:
    matchLabels:
      app: grafana
  template:
    metadata:
      labels:
        app: grafana
    spec:
      containers:
      - name: grafana
        image: grafana/grafana:10.0.0
        imagePullPolicy: IfNotPresent
        env:
        - name: GF_SECURITY_ADMIN_USER
          valueFrom:
            secretKeyRef:
              name: grafana-secret
              key: admin-user
        - name: GF_SECURITY_ADMIN_PASSWORD
          valueFrom:
            secretKeyRef:
              name: grafana-secret
              key: admin-password
        - name: GF_INSTALL_PLUGINS
          valueFrom:
            configMapKeyRef:
              name: grafana-cm
              key: plugins
        - name: GF_PATHS_DATA
          value: /var/lib/grafana/
        - name: GF_PATHS_LOGS
          value: /var/log/grafana
        - name: GF_PATHS_PLUGINS
          value: /var/lib/grafana/plugins
        - name: GF_PATHS_PROVISIONING
          value: /etc/grafana/provisioning
        livenessProbe:
          failureThreshold: 10
          httpGet:
            path: /api/health
            port: 3000
            scheme: HTTP
          initialDelaySeconds: 60
          periodSeconds: 10
          successThreshold: 1
          timeoutSeconds: 30
        ports:
        - containerPort: 80
          name: service
          protocol: TCP
        - containerPort: 3000
          name: grafana
          protocol: TCP
        readinessProbe:
          failureThreshold: 3
          httpGet:
            path: /api/health
            port: 3000
            scheme: HTTP
          periodSeconds: 10
          successThreshold: 1
          timeoutSeconds: 1
        resources:
          requests:
            cpu: 100m
            memory: 128Mi
        terminationMessagePath: /dev/termination-log
        volumeMounts:
        - name: grafana-config
          mountPath: /etc/grafana/grafana.ini
          subPath: grafana.ini
        - name: grafana-config
          mountPath: /etc/grafana/provisioning/dashboards/dashboardproviders.yaml
          subPath: dashboardproviders.yaml
        - name: storage
          mountPath: /var/lib/grafana
      initContainers:
      - command:
        - chown
        - -R
        - 472:472
        - /var/lib/grafana
        image: busybox:1.31.1
        imagePullPolicy: IfNotPresent
        name: init-chown-data
        terminationMessagePath: /dev/termination-log
        volumeMounts:
        - name: storage
          mountPath: /var/lib/grafana
      volumes:
      - name: grafana-config
        configMap:
          name: grafana-cm
          defaultMode: 420
      - name: storage
        persistentVolumeClaim:
          claimName: grafana-pvc

---
apiVersion: v1
kind: Service
metadata:
  labels:
    app: grafana
  name: grafana-svc
  namespace: thanos
spec:
  selector:
    app: grafana
  ports:
  - name: service
    port: 80
    protocol: TCP
    targetPort: 3000
Alertmanager
bash
apiVersion: v1
kind: Secret
metadata:
    name: alertmanager-config
    namespace: thanos
type: Opaque
stringData:
  alertmanager.yaml: |
    global:
      resolve_timeout: 5m

    route:
      receiver: "lark"
      group_by: ['alertname', 'instance']
      group_wait: 30s
      group_interval: 5m
      repeat_interval: 3h

    receivers:
    - name: "lark"
      webhook_configs:
      - url: "http://alertmanager-lark-relay.thanos:5001/"
        send_resolved: true

---
apiVersion: apps/v1
kind: Deployment
metadata:
  name: alertmanager-lark-relay
  namespace: thanos
spec:
  replicas: 1
  selector:
    matchLabels:
      app: alertmanager-lark-relay
  template:
    metadata:
      labels:
        app: alertmanager-lark-relay
    spec:
      imagePullSecrets:
        - name: oci-container-registry
      containers:
        - name: relay
          image: ap-singapore-1.ocir.io/ax3k1k204hy5/ctx-infra-images:1.2-29.alertmanager-lark-relay
          imagePullPolicy: IfNotPresent
          ports:
            - containerPort: 5001
          env:
            - name: LARK_WEBHOOK
              value: "https://open.larksuite.com/open-apis/bot/v2/hook/xxxxxxxx"
---
apiVersion: v1
kind: Service
metadata:
  name: alertmanager-lark-relay
  namespace: thanos
spec:
  selector:
    app: alertmanager-lark-relay
  ports:
    - protocol: TCP
      port: 5001
      targetPort: 5001
---
apiVersion: apps/v1
kind: Deployment
metadata:
  name: alertmanager
  namespace: thanos
  labels:
    app: alertmanager
spec:
  replicas: 1
  selector:
    matchLabels:
      app: alertmanager
  template:
    metadata:
      labels:
        app: alertmanager
    spec:
      containers:
        - name: alertmanager
          image: prom/alertmanager:v0.27.0
          args:
            - "--config.file=/etc/alertmanager/alertmanager.yaml"
            - "--storage.path=/alertmanager"
            - "--web.listen-address=:9093"
          ports:
            - name: web
              containerPort: 9093
          volumeMounts:
            - name: config
              mountPath: /etc/alertmanager
            - name: storage
              mountPath: /alertmanager
      volumes:
        - name: config
          secret:
            secretName: alertmanager-config
        - name: storage
          emptyDir: {}
---
apiVersion: v1
kind: Service
metadata:
  name: alertmanager
  namespace: thanos
  labels:
    app: alertmanager
spec:
  type: ClusterIP
  ports:
    - name: web
      port: 9093
      targetPort: 9093
  selector:
    app: alertmanager
Alertmanager Webhook
由于Alertmanager的告警JSON格式跟Lark的Webhook的接口格式不匹配,所以我们自己写一个Webhook来中转告警数据:
bash
from flask import Flask, request
import requests
import datetime

app = Flask(__name__)

# ✅ 替换成你的Lark机器人Webhook
LARK_WEBHOOK = "https://open.larksuite.com/open-apis/bot/v2/hook/xxxxxx"

@app.route("/", methods=["POST"])
def relay():
    data = request.json or {}
    alerts = data.get("alerts", [])
    messages = []

    for a in alerts:
        status = a.get("status", "unknown").upper()
        labels = a.get("labels", {})
        annotations = a.get("annotations", {})

        # 颜色区分
        if status == "FIRING":
            color = "red"
            emoji = "🚨"
        elif status == "RESOLVED":
            color = "green"
            emoji = "✅"
        else:
            color = "gray"
            emoji = "⚪️"

        alertname = labels.get("alertname", "-")
        namespace = labels.get("namespace", "-")
        instance = labels.get("instance", "") or labels.get("pod", "-")
        severity = labels.get("severity", "none").upper()
        summary = annotations.get("summary", "")
        description = annotations.get("description", "")
        startsAt = a.get("startsAt", "")
        endsAt = a.get("endsAt", "")

        # 飞书卡片消息
        card_content = {
            "config": {"wide_screen_mode": True},
            "elements": [
                {
                    "tag": "div",
                    "text": {
                        "content": f"**{emoji} {status} - {alertname}**\n",
                        "tag": "lark_md"
                    }
                },
                {"tag": "hr"},
                {
                    "tag": "div",
                    "text": {
                        "content": (
                            f"📦 **命名空间**:{namespace}\n"
                            f"🖥️ **实例**:{instance}\n"
                            f"⚙️ **严重级别**:{severity}\n"
                            f"🕐 **开始时间**:{startsAt}\n"
                            f"🕓 **结束时间**:{endsAt or '-'}\n"
                        ),
                        "tag": "lark_md"
                    }
                },
                {"tag": "hr"},
                {
                    "tag": "div",
                    "text": {
                        "content": f"📄 **摘要**:{summary or '-'}\n📝 **描述**:{description or '-'}",
                        "tag": "lark_md"
                    }
                },
                {"tag": "hr"},
                {
                    "tag": "action",
                    "actions": [
                        {
                            "tag": "button",
                            "text": {"content": "🔍 打开 Prometheus", "tag": "lark_md"},
                            "url": "https://prometheus.xxxxx",
                            "type": "default"
                        }
                    ]
                }
            ],
            "header": {
                "title": {"content": f"{emoji} {alertname}", "tag": "plain_text"},
                "template": color
            }
        }

        payload = {"msg_type": "interactive", "card": card_content}

        # 发送到 Lark
        resp = requests.post(LARK_WEBHOOK, json=payload)
        print(f"[{datetime.datetime.now()}] Sent {status} alert {alertname}, resp={resp.status_code} {resp.text}")

    return "OK", 200


if __name__ == "__main__":
    app.run(host="0.0.0.0", port=5001)
2.Dockerfile打包成容器镜像:
bash
FROM python:3.9-slim
WORKDIR /app
COPY app.py /app/app.py
RUN pip install flask requests aiohttp
CMD ["python3", "/app/app.py"]
3.在Kubernetes中部署Webhook:
bash
apiVersion: apps/v1
kind: Deployment
metadata:
  name: alertmanager-lark-relay
  namespace: thanos
spec:
  replicas: 1
  selector:
    matchLabels:
      app: alertmanager-lark-relay
  template:
    metadata:
      labels:
        app: alertmanager-lark-relay
    spec:
      imagePullSecrets:
        - name: oci-container-registry
      containers:
        - name: relay
          image: ap-singapore-1.ocir.io/xxxxxx/xxxxxx:TAG
          imagePullPolicy: IfNotPresent
          ports:
            - containerPort: 5001
          env:
            - name: LARK_WEBHOOK
              value: "https://open.larksuite.com/open-apis/bot/v2/hook/xxxxxx"
---
apiVersion: v1
kind: Service
metadata:
  name: alertmanager-lark-relay
  namespace: thanos
spec:
  selector:
    app: alertmanager-lark-relay
  ports:
    - protocol: TCP
      port: 5001
      targetPort: 5001
Thanos Store & Thanos Compact
最后我们在一台单独的服务器上部署这两个组件,以下是相关配置文件:
bash
# /etc/systemd/system/thanos-store-oci.service
[Unit]
Description=Thanos Store Daemon
After=network.target

[Service]
Type=simple
User=mvgx
Group=mvgx
Restart=on-failure
ExecStart=/usr/local/thanos0392/thanos store \
          --data-dir=/data/thanos/store-oci \
          --grpc-address=0.0.0.0:10911 \
          --http-address=0.0.0.0:10914 \
          --objstore.config-file=/usr/local/thanos0392/objectstorage-oci.yaml \
          --chunk-pool-size=1GB \
          --block-sync-concurrency=20 \
          --log.level=info
LimitNOFILE=65535
StandardOutput=file:/data/thanos/log/thanos-store-oci.log
StandardOutput=file:/data/thanos/log/thanos-error-oci.log

[Install]
WantedBy=multi-user.target


# /etc/systemd/system/thanos-compact-oci.service
[Unit]
Description=Thanos Compact Daemon
After=network.target

[Service]
Type=simple
User=mvgx
Group=mvgx
Restart=on-failure
ExecStart=/usr/local/thanos0392/thanos compact \
          --wait \
          --consistency-delay=1h \
          --objstore.config-file=/usr/local/thanos0392/objectstorage-oci.yaml \
          --data-dir=/data/thanos/compact-oci \
          --http-address=0.0.0.0:19193 \
          --retention.resolution-raw=90d \
          --retention.resolution-5m=30d \
          --retention.resolution-1h=60d \
          --log.level=info
StandardOutput=file:/data/thanos/log/thanos-store-oci.log
StandardOutput=file:/data/thanos/log/thanos-error-oci.log

[Install]
WantedBy=multi-user.target

# /usr/local/thanos0392/objectstorage-oci.yaml
type: OCI
config:
  provider: "default"
  bucket: "prd-monitoring-system-oci"
  compartment_ocid: "ocid1.compartment.oc1..xxxxxxx"
四.Web UI
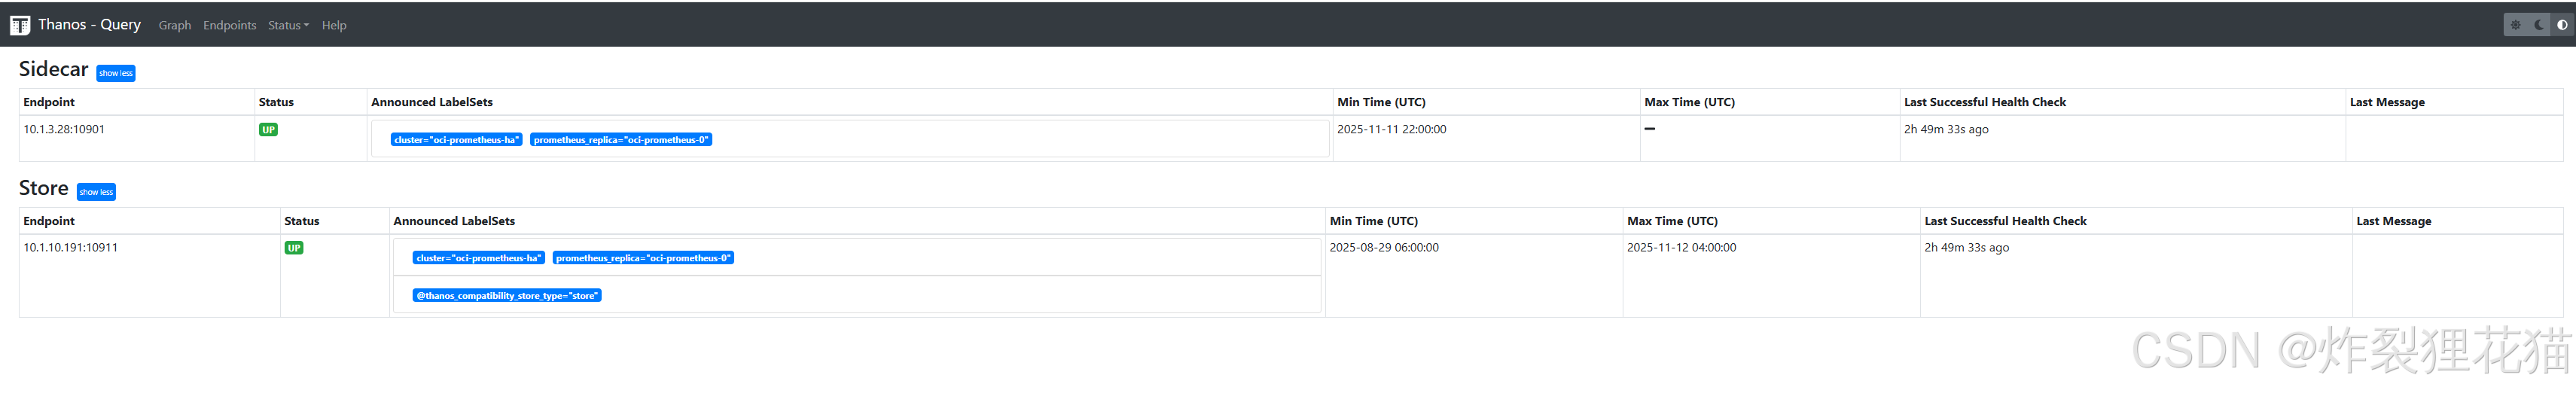
Thanos Query Web UI
可以看到我们配置的两个数据源,一个是Thanos Sidecar代理的Prometheus本地6小时内的监控数据,一个是Thanos Store从存储中缓存的历史监控数据。
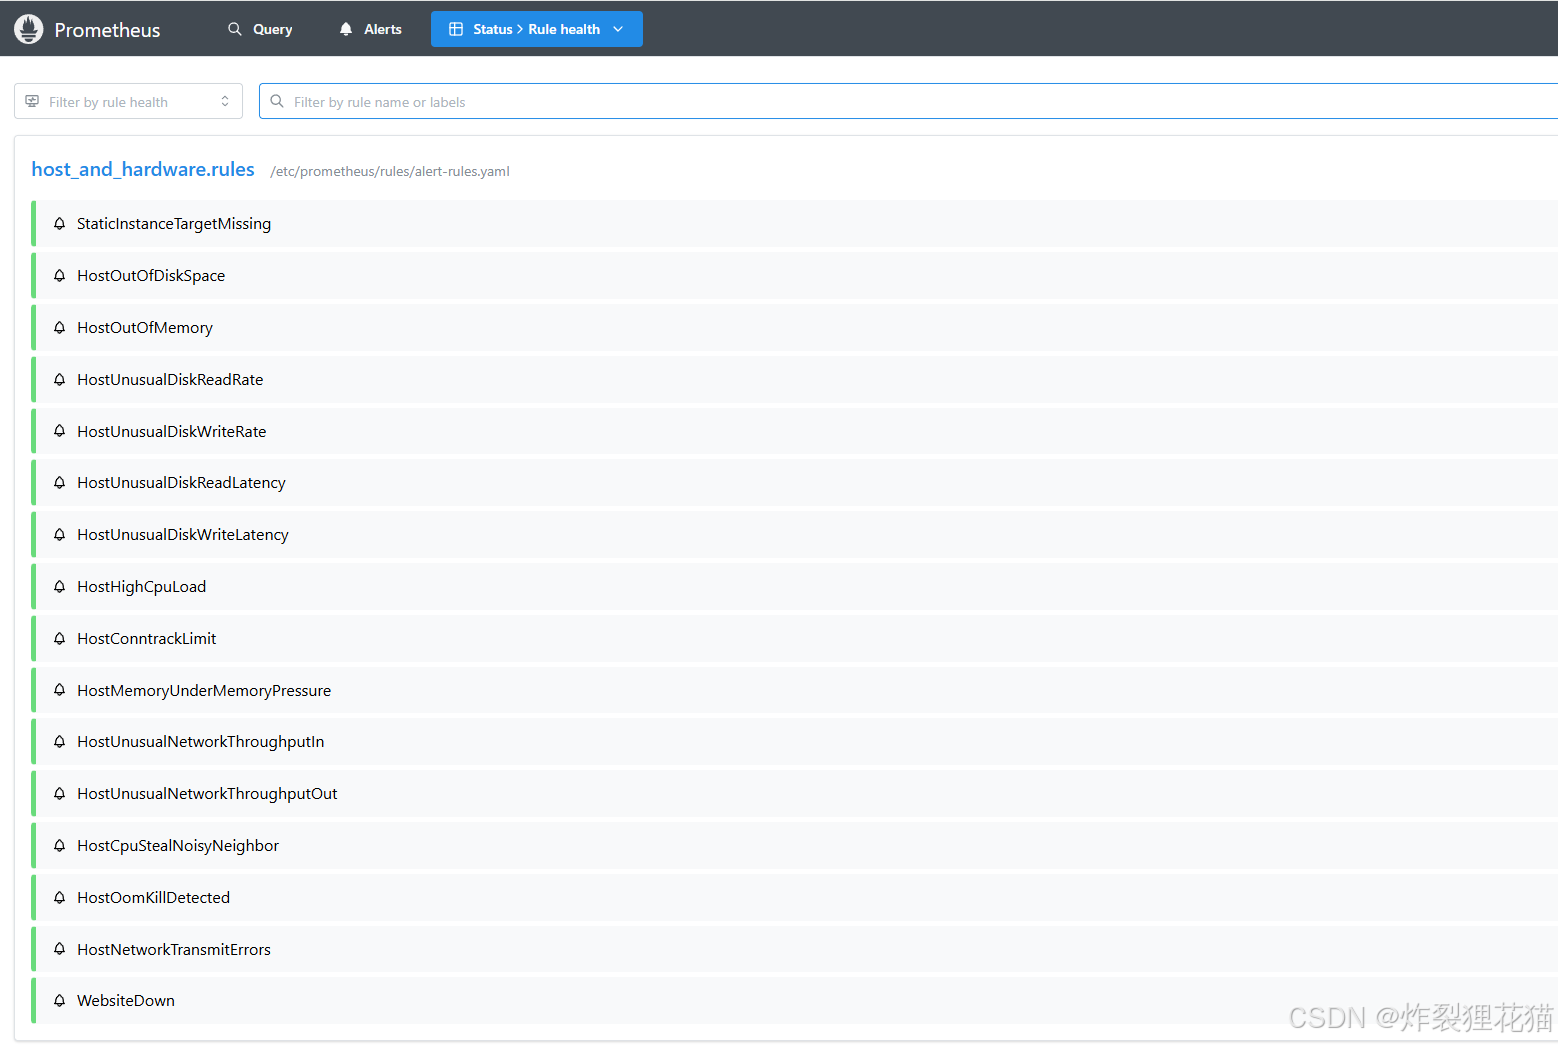
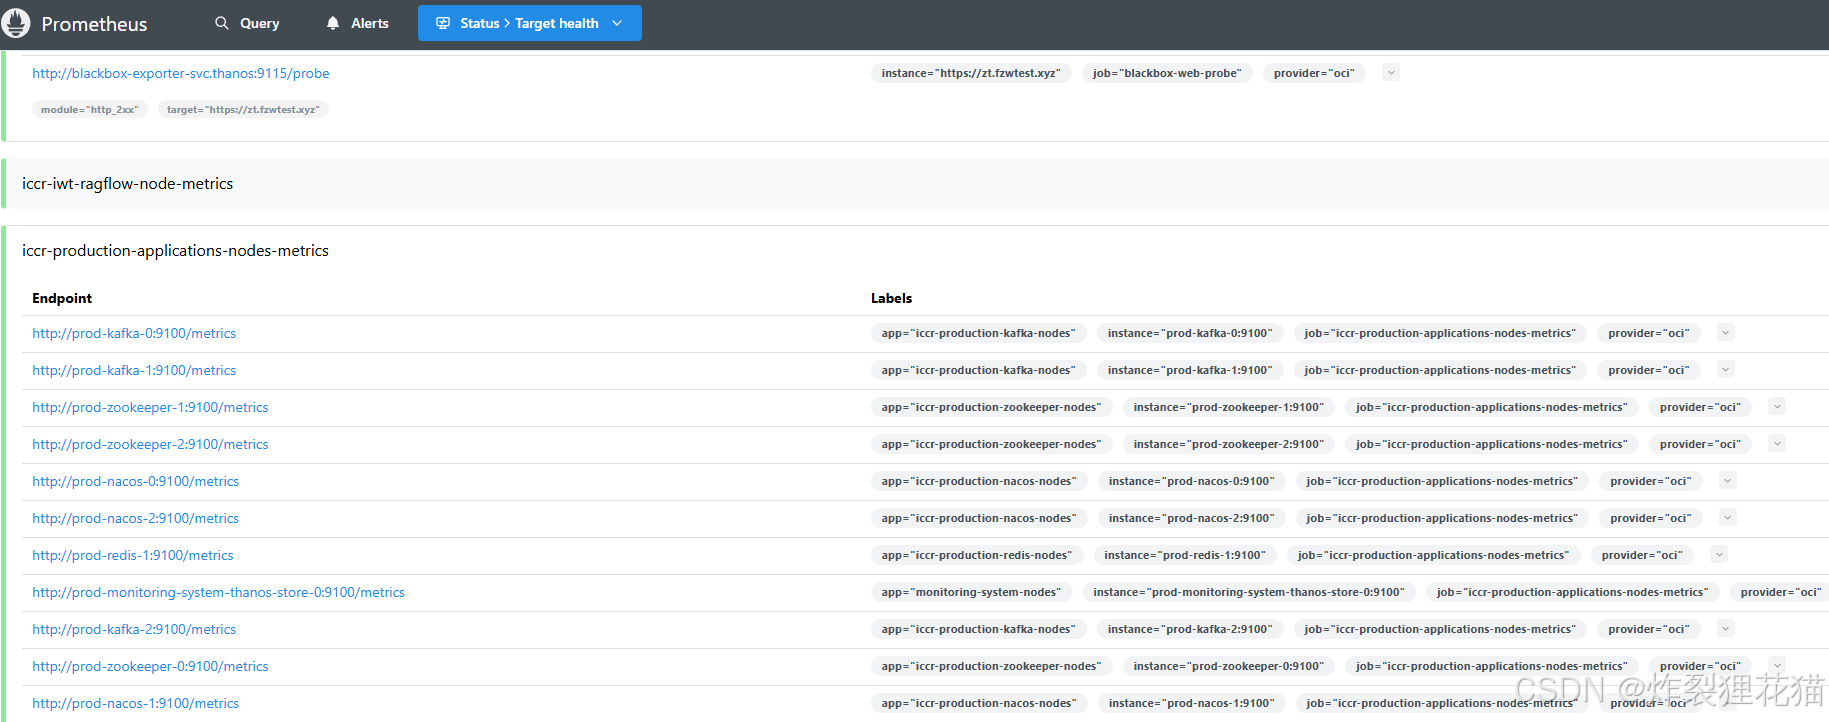
Prometheus Web UI
可以看到告警规则和监控数据来源的运行状态。由于我们环境中基本达到了稳定运行(每天出现的告警信息很少),所以之前Alertmanager的部署采用了Deployment而不是StatefulSet。
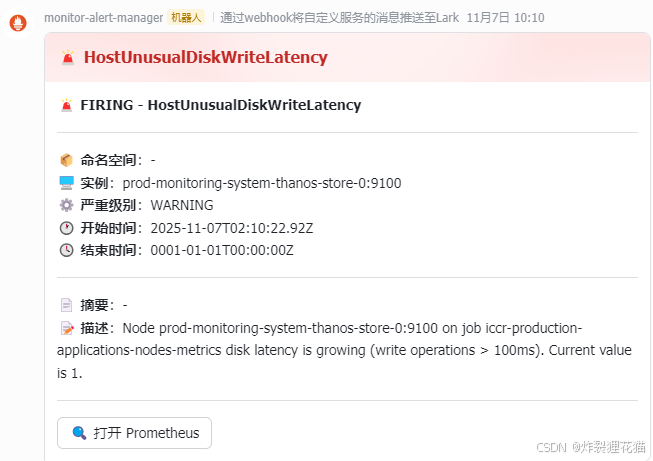
Alertmanager Web UI
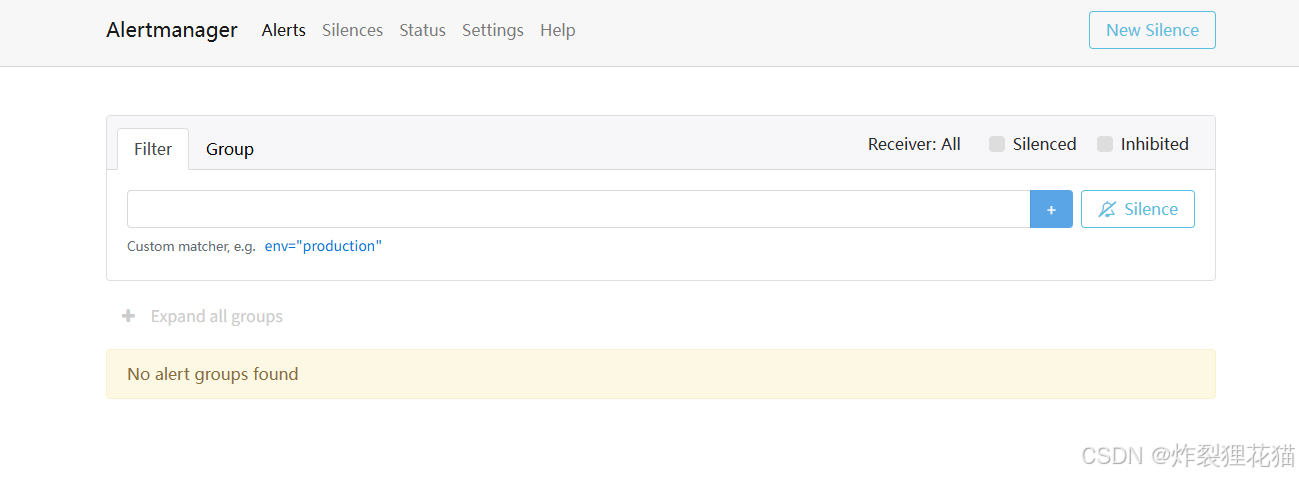
如果有告警信息会显示在上图的Alerts中,也会自动调用Webhook发送到接收平台,例如下图的Lark中:
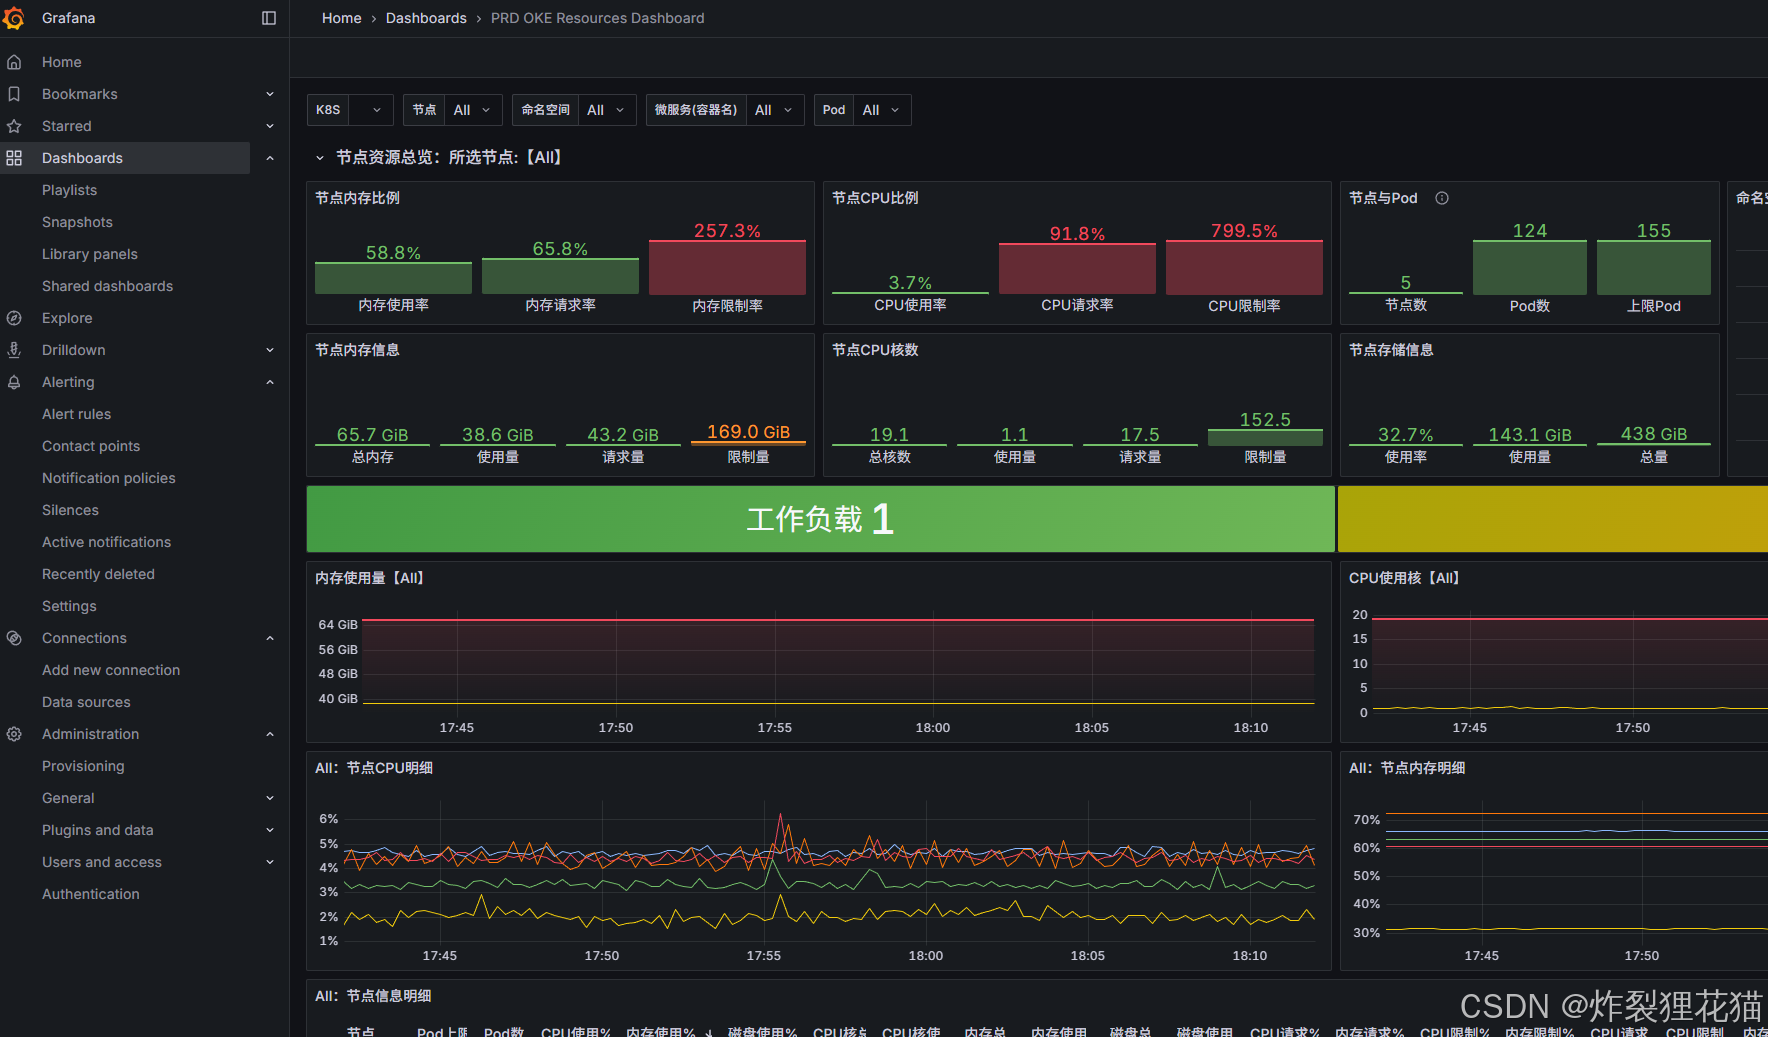
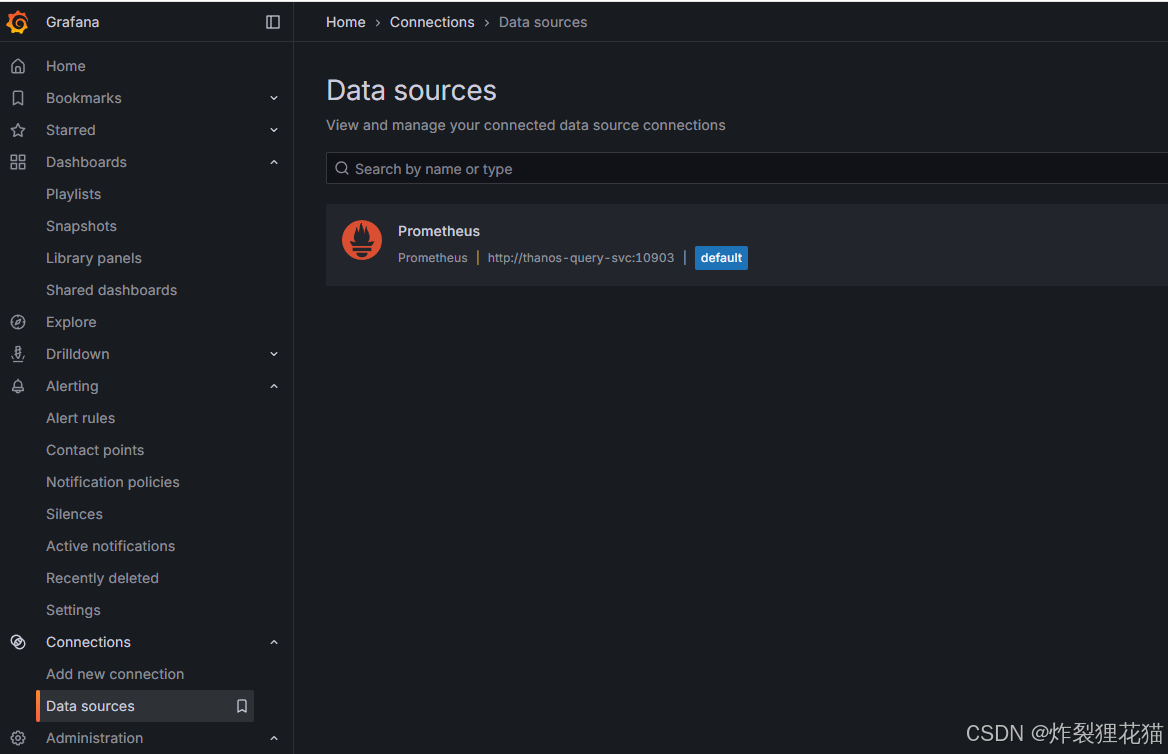
Grafana Web UI
Grafana数据源采用聚合所有数据的Thanos Query:
从Grafana社区加载一些Dashboard模板,然后稍作修改即可: