- 为什么要统计接口调用频率?
- 方案设计要考虑的关键因素
- 方案一:固定窗口计数器
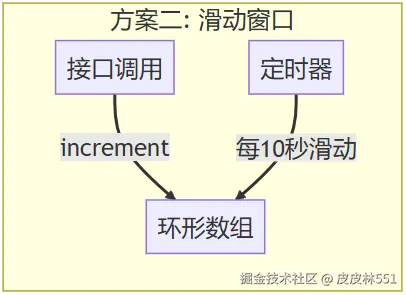
- 方案二:滑动窗口计数器(懒加载优化版)
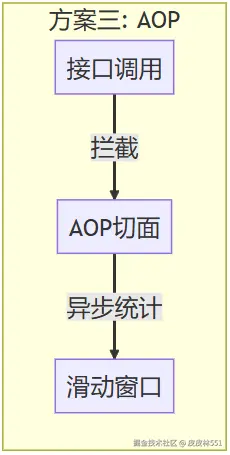
- 方案三:基于 AOP 的透明统计(异步优化版)
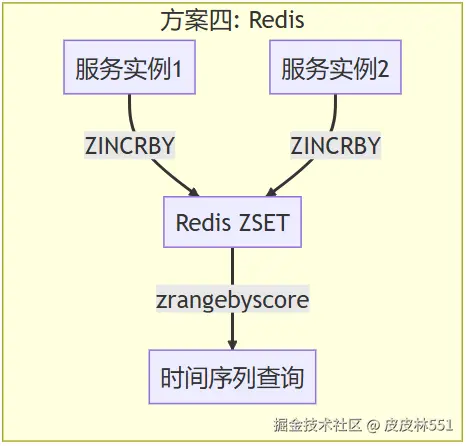
- 方案四:使用 Redis 实现分布式统计(时序优化版)
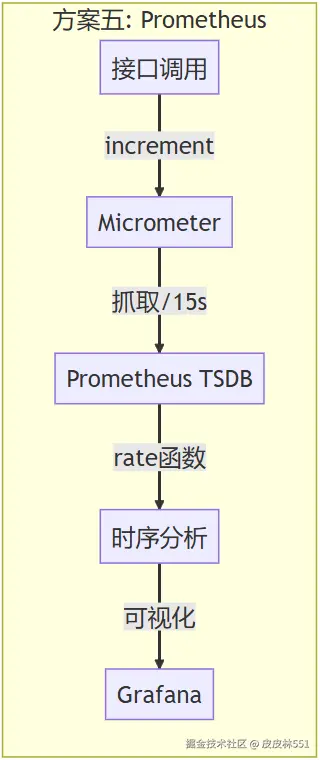
- 方案五:使用 Micrometer + Prometheus 实现监控可视化(多维优化版)
- 五种方案的数据流架构对比
- 混合方案:完整监控体系
- 进阶:接口调用监控的实战经验与性能对比
- 容量规划建议
作为一线开发,你是不是经常碰到这样的场景:
- 运维半夜打电话说某个接口被疯狂调用,系统扛不住了
- 产品经理抱怨页面越来越慢,怀疑是接口性能问题
- 老板突然要看各个接口的调用情况,想了解系统热点
这时候,如果有一套能精确统计"每个接口每分钟调用次数"的监控系统,就能快速定位问题了。今天我就把自己在项目中实践的几种方案和踩过的坑分享给大家。
为什么要统计接口调用频率?
在深入技术方案前,我们先聊聊为什么需要这样的统计:
- 性能瓶颈发现 - 哪些接口调用最频繁,是不是要优化或加缓存
- 容量规划 - 根据调用趋势决定啥时候该加机器了
- 安全预警 - 接口突然被猛调用,可能是遭受攻击
- 计费依据 - 对外 API 往往按调用次数收费
- 问题排查 - 系统出问题时,先看看哪些接口最忙
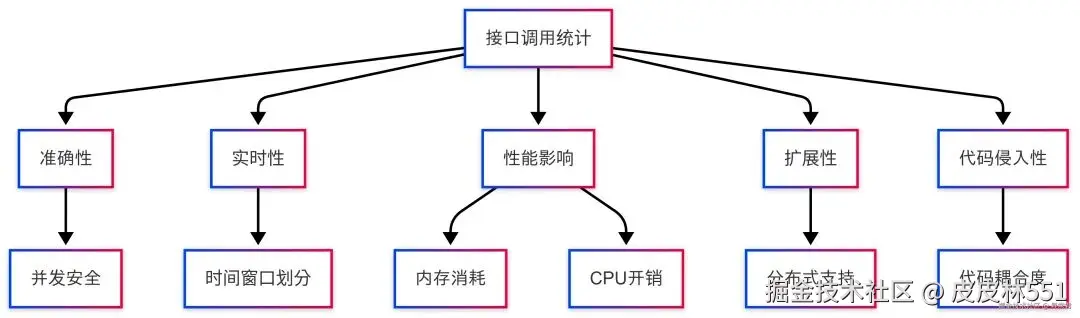
方案设计要考虑的关键因素
实现这种监控时,有几个问题得权衡:
图片
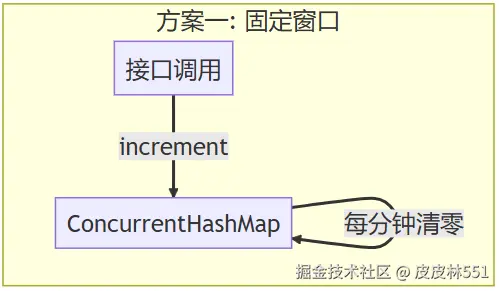
方案一:固定窗口计数器
最直观的方案是用个 Map 记录每个接口调用次数,每分钟清零一次:
typescript
public class SimpleCounter {
    // 用ConcurrentHashMap保证线程安全
    private ConcurrentHashMap<String, AtomicLong> counters = new ConcurrentHashMap<>();

    // 记录接口调用
    public void increment(String apiName) {
        counters.computeIfAbsent(apiName, k -> new AtomicLong(0)).incrementAndGet();
    }

    // 获取接口调用次数
    public long getCount(String apiName) {
        // 用getOrDefault避免频繁computeIfAbsent
        return counters.getOrDefault(apiName, new AtomicLong(0)).get();
    }

    // 定时任务,每分钟执行一次,打印并清零
    @Scheduled(fixedRate = 60000)
    public void printAndReset() {
        System.out.println("=== 接口分钟调用统计 ===");
        counters.forEach((api, count) -> {
            System.out.println(api + ": " + count.getAndSet(0));
        });
    }
}
这种方案实现超简单,但有个明显问题:假设定时器在 8:59:59 触发清零,9:00:01 有次调用,这次调用会被算到 9:01 才清零的那个窗口里,统计就不准了。就像公司打卡,你 8:59 到了,打卡机 9:00 重置,系统硬是把你算成下一个小时的人了。
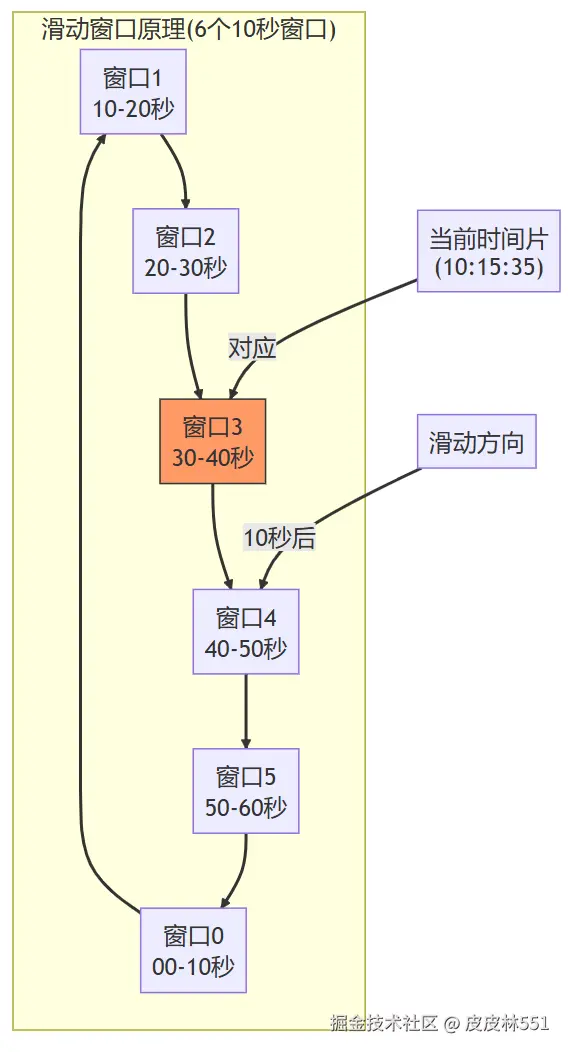
方案二:滑动窗口计数器(懒加载优化版)
滑动窗口能解决时间边界问题。我们把一分钟(60 秒)拆成 6 个 10 秒窗口,像传送带一样滑动:
scss
public class SlidingWindowCounter {
    // 记录每个接口在各个时间片的调用次数
    privatefinal ConcurrentHashMap<String, CounterEntry> apiCounters = new ConcurrentHashMap<>();
    // 每个窗口的时长(秒)
    privatefinalint WINDOW_SIZE_SECONDS = 10;
    // 窗口数量(1分钟=60秒,分成6个窗口,每个10秒)
    privatefinalint WINDOW_COUNT = 6;
    // 当前系统时间片索引
    privatevolatileint currentTimeSlice;

    public SlidingWindowCounter() {
        // 计算初始时间片索引,对齐系统时间
        // 时间片索引公式:当前时间秒数 / 窗口大小(10秒) = 第几个时间片
        currentTimeSlice = (int)(System.currentTimeMillis() / 1000 / WINDOW_SIZE_SECONDS);

        // 启动定时器,每10秒滑动一次窗口
        ScheduledExecutorService scheduler = Executors.newScheduledThreadPool(1);

        // 计算第一次执行延迟,让窗口边界对齐整10秒
        long initialDelay = WINDOW_SIZE_SECONDS - (System.currentTimeMillis() / 1000 % WINDOW_SIZE_SECONDS);

        scheduler.scheduleAtFixedRate(this::slideWindow,
            initialDelay, WINDOW_SIZE_SECONDS, TimeUnit.SECONDS);
    }

    // 记录接口调用
    public void increment(String apiName) {
        // 获取当前时间片索引
        int timeSlice = currentTimeSlice;

        // 获取或创建接口计数器,懒加载更新窗口
        CounterEntry entry = apiCounters.computeIfAbsent(apiName, k -> new CounterEntry());
        entry.increment(timeSlice);
    }

    // 获取一分钟内的调用次数
    public long getMinuteCount(String apiName) {
        CounterEntry entry = apiCounters.get(apiName);
        if (entry == null) {
            return0;
        }

        // 获取当前时间片之前的6个窗口总和
        return entry.getTotal(currentTimeSlice);
    }

    // 窗口滑动(只更新时间片索引,窗口数据懒加载更新)
    private void slideWindow() {
        try {
            // 计算最新的时间片索引
            int newSlice = (int)(System.currentTimeMillis() / 1000 / WINDOW_SIZE_SECONDS);

            // 处理时钟回拨情况
            if (newSlice <= currentTimeSlice) {
                // 时钟回拨了,打日志但不更新时间片
                System.err.println("Clock skew detected: " + newSlice + " <= " + currentTimeSlice);
                return;
            }

            // 更新当前时间片索引
            currentTimeSlice = newSlice;

            // 定期清理长时间未使用的接口统计
            cleanupIdleCounters();
        } catch (Exception e) {
            // 异常处理,避免定时任务中断
            System.err.println("Error in slideWindow: " + e.getMessage());
        }
    }

    // 计数器条目内部类,支持懒加载窗口更新
    privateclass CounterEntry {
        // 时间片计数数组
        privatefinal AtomicLong[] counters = new AtomicLong[WINDOW_COUNT];
        // 最后访问的时间片索引
        privatevolatileint lastAccessedSlice;
        // 最后更新时间
        privatevolatilelong lastUpdateTime;

        public CounterEntry() {
            for (int i = 0; i < WINDOW_COUNT; i++) {
                counters[i] = new AtomicLong(0);
            }
            lastAccessedSlice = currentTimeSlice;
            lastUpdateTime = System.currentTimeMillis();
        }

        // 增加当前时间片的计数
        public void increment(int timeSlice) {
            // 先更新窗口(如果需要)
            updateWindowsIfNeeded(timeSlice);

            // 增加当前时间片的计数
            // 环形数组索引 = 时间片索引 % 窗口数量
            // 这里是关键:通过取模运算使得数组索引在0-5间循环,形成环形结构
            int index = timeSlice % WINDOW_COUNT;
            counters[index].incrementAndGet();

            // 更新访问信息
            lastAccessedSlice = timeSlice;
            lastUpdateTime = System.currentTimeMillis();
        }

        // 获取所有窗口的总计数
        public long getTotal(int currentSlice) {
            // 先更新窗口(如果需要)
            updateWindowsIfNeeded(currentSlice);

            // 计算总和
            long total = 0;
            for (AtomicLong counter : counters) {
                total += counter.get();
            }
            return total;
        }

        // 懒加载更新窗口 - 只在实际访问时更新
        private void updateWindowsIfNeeded(int currentSlice) {
            int sliceDiff = currentSlice - lastAccessedSlice;

            if (sliceDiff <= 0) {
                // 时间片未变或异常情况(时钟回拨),无需更新
                return;
            }

            if (sliceDiff >= WINDOW_COUNT) {
                // 如果时间差超过窗口数,直接清零所有窗口
                for (AtomicLong counter : counters) {
                    counter.set(0);
                }
            } else {
                // 部分窗口需要清零
                for (int i = 1; i <= sliceDiff; i++) {
                    int indexToClear = (lastAccessedSlice + i) % WINDOW_COUNT;
                    counters[indexToClear].set(0);
                }
            }
        }
    }

    // 清理长时间未使用的计数器,避免内存泄漏
    private void cleanupIdleCounters() {
        finallong IDLE_THRESHOLD_MS = 300000; // 5分钟无调用则清理
        long now = System.currentTimeMillis();

        Iterator<Map.Entry<String, CounterEntry>> it = apiCounters.entrySet().iterator();
        while (it.hasNext()) {
            Map.Entry<String, CounterEntry> entry = it.next();
            CounterEntry counterEntry = entry.getValue();

            if (now - counterEntry.lastUpdateTime > IDLE_THRESHOLD_MS) {
                // 如果5分钟未更新,移除此接口的统计
                it.remove();
            }
        }
    }
}
这个懒加载滑动窗口方案的优点是时间精度高,边界平滑,性能也不错。懒加载是啥意思?就是只有你真来访问了,我才去更新那个窗口,不像传统方案每次滑动都要遍历所有接口。
滑动窗口就像环形跑道上的 6 个区域,随着时间推移,我们只清空前方的区域,保留最近一分钟的统计数据。
图片
方案三:基于 AOP 的透明统计(异步优化版)
前面的方案都要在代码里手动调用 increment 方法,太麻烦了。用 Spring AOP,可以实现无侵入的接口调用统计:
java
@Aspect
@Component
publicclass ApiMonitorAspect {
    privatefinal Logger logger = LoggerFactory.getLogger(ApiMonitorAspect.class);

    // 依赖注入单例计数器
    @Autowired
    private SlidingWindowCounter counter;

    // 创建线程池,配置拒绝策略
    privatefinal ThreadPoolExecutor asyncExecutor = new ThreadPoolExecutor(
        2, 5, 60, TimeUnit.SECONDS,
        new LinkedBlockingQueue<>(1000),
        Executors.defaultThreadFactory(),
        new ThreadPoolExecutor.CallerRunsPolicy() // 拒绝策略:调用者执行
    );

    // 定义切点,精确匹配只统计HTTP接口
    @Pointcut("@within(org.springframework.web.bind.annotation.RestController) || " +
              "@within(org.springframework.stereotype.Controller)")
    public void apiPointcut() {}

    @Around("apiPointcut()")
    public Object around(ProceedingJoinPoint joinPoint) throws Throwable {
        long startTime = System.currentTimeMillis();
        Object result = null;
        boolean success = false;

        // 获取完整方法签名(包含包名),避免同名冲突
        MethodSignature signature = (MethodSignature) joinPoint.getSignature();
        String methodName = signature.getDeclaringType().getName() + "." + signature.getName();

        try {
            // 执行原方法
            result = joinPoint.proceed();
            success = true;
            return result;
        } catch (Exception e) {
            // 记录异常信息
            success = false;
            throw e;
        } finally {
            finallong executionTime = System.currentTimeMillis() - startTime;
            finalboolean finalSuccess = success;

            // 异步记录统计信息,避免影响主流程性能
            asyncExecutor.execute(() -> {
                try {
                    // 记录总调用
                    counter.increment(methodName);

                    // 成功/失败分类
                    counter.increment(methodName + ":" + (finalSuccess ? "success" : "failure"));

                    // 执行时间分类
                    String speedCategory;
                    if (executionTime < 100) {
                        speedCategory = "fast";
                    } elseif (executionTime < 1000) {
                        speedCategory = "medium";
                    } else {
                        speedCategory = "slow";
                    }
                    counter.increment(methodName + ":" + speedCategory);
                } catch (Exception ex) {
                    // 确保统计逻辑异常不影响业务
                    logger.error("Failed to record API metrics", ex);
                }
            });
        }
    }

    // 提供查询接口
    public long getApiCallCount(String apiName) {
        return counter.getMinuteCount(apiName);
    }
}
这种 AOP 方案就像在小区门口装了个"隐形摄像头",进出的人都被记录,但完全感觉不到它的存在。我优化了线程池配置,加了拒绝策略,防止高并发时队列爆满。切点表达式也做了精确匹配,确保只统计真正的 HTTP 接口,不会误统计内部服务方法。
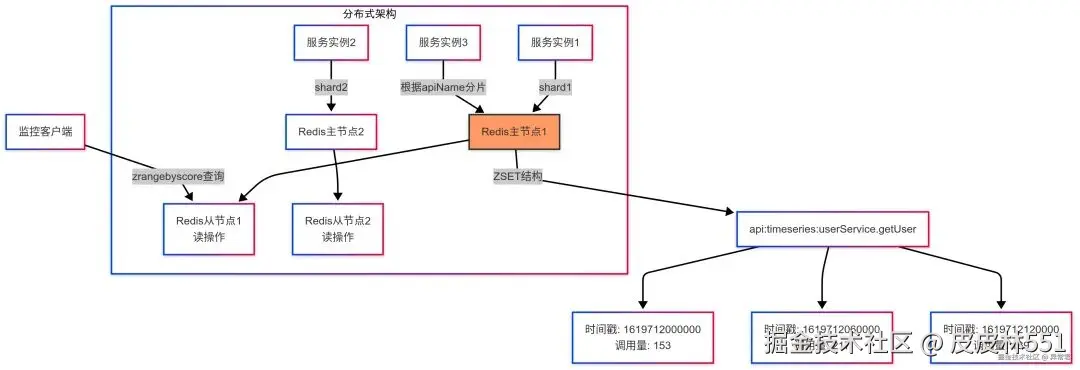
方案四:使用 Redis 实现分布式统计(时序优化版)
前面的方案在单机应用里都挺好用,但放到分布式系统里,每台机器都有自己的计数器,统计就不全了。用 Redis 可以实现分布式计数:
ini
@Service
publicclass RedisTimeSeriesCounter {
    @Autowired
    private StringRedisTemplate redisTemplate;

    // Redis连接池配置(在应用配置文件中设置)
    // spring.redis.jedis.pool.max-active=100
    // spring.redis.jedis.pool.max-idle=20
    // spring.redis.jedis.pool.min-idle=5
    // spring.redis.jedis.pool.max-wait=1000ms

    // 重试配置
    privatefinalint MAX_RETRIES = 3;
    privatefinallong[] RETRY_DELAYS = {10L, 50L, 200L}; // 指数退避延迟

    // 记录接口调用
    public void increment(String apiName) {
        long timestamp = System.currentTimeMillis();
        String key = getBaseKey(apiName);

        // 使用Lua脚本原子操作:将当前分钟的调用记录到有序集合中
        String script =
            "local minute = math.floor(ARGV[1]/60000)*60000; " + // 取整到分钟
            "redis.call('ZINCRBY', KEYS[1], 1, minute); " +      // 增加计数
            "redis.call('EXPIRE', KEYS[1], 86400); " +           // 设置24小时过期
            "return 1;";

        // 带重试的执行Lua脚本
        Exception lastException = null;
        for (int attempt = 0; attempt < MAX_RETRIES; attempt++) {
            try {
                redisTemplate.execute(
                    new DefaultRedisScript<>(script, Long.class),
                    Collections.singletonList(key),
                    String.valueOf(timestamp)
                );
                return; // 成功则直接返回
            } catch (Exception e) {
                lastException = e;
                // 重试前等待一段时间(指数退避)
                if (attempt < MAX_RETRIES - 1) {
                    try {
                        Thread.sleep(RETRY_DELAYS[attempt]);
                    } catch (InterruptedException ie) {
                        Thread.currentThread().interrupt();
                        break;
                    }
                }
            }
        }

        // 所有重试都失败,降级处理
        try {
            logger.warn("Failed to execute Redis script after {} retries, falling back to basic operations", MAX_RETRIES, lastException);
            String minuteKey = String.valueOf(Math.floor(timestamp/60000)*60000);
            redisTemplate.opsForZSet().incrementScore(key, minuteKey, 1);
            redisTemplate.expire(key, 1, TimeUnit.DAYS);
        } catch (Exception e) {
            logger.error("Failed to increment API counter for {}", apiName, e);
            // 本地计数器备份可以在这里实现
        }
    }

    // 获取当前分钟的调用次数
    public long getCurrentMinuteCount(String apiName) {
        long currentMinute = Math.floor(System.currentTimeMillis()/60000)*60000;
        return getCountByMinute(apiName, currentMinute);
    }

    // 获取指定分钟的调用次数
    public long getCountByMinute(String apiName, long minuteTimestamp) {
        String key = getBaseKey(apiName);
        Double score = redisTemplate.opsForZSet().score(key, String.valueOf(minuteTimestamp));
        return score == null ? 0 : score.longValue();
    }

    // 获取一段时间内的调用趋势
    public Map<Long, Long> getCountTrend(String apiName, long startTime, long endTime) {
        String key = getBaseKey(apiName);

        // 将时间戳取整到分钟
        long startMinute = Math.floor(startTime/60000)*60000;
        long endMinute = Math.floor(endTime/60000)*60000;

        // 查询Redis中的时间序列数据
        Set<ZSetOperations.TypedTuple<String>> results = redisTemplate.opsForZSet()
            .rangeByScoreWithScores(key, startMinute, endMinute);

        // 构建结果Map
        Map<Long, Long> trend = new TreeMap<>();
        if (results != null) {
            for (ZSetOperations.TypedTuple<String> tuple : results) {
                trend.put(Long.parseLong(tuple.getValue()), tuple.getScore().longValue());
            }
        }

        return trend;
    }

    // 生成Redis基础key
    private String getBaseKey(String apiName) {
        return"api:timeseries:" + apiName;
    }
}
Redis 时序数据方案不仅支持分布式环境,还能超高效地存储和查询历史趋势。我加了重试机制,防止网络抖动导致计数失败,并且提供了 Redis 连接池配置建议。有序集合(ZSET)比简单计数器厉害的地方是,它能按时间戳自然排序,一个接口所有时间点的调用数据都在一个结构里,查询很方便。
图片
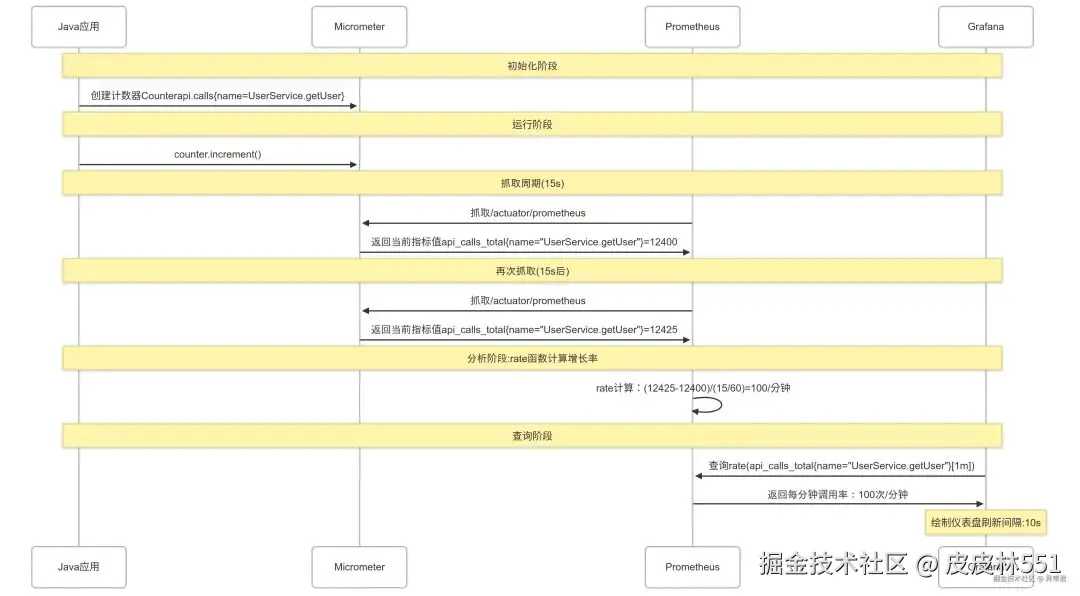
方案五:使用 Micrometer + Prometheus 实现监控可视化(多维优化版)
如果你不只是想统计调用次数,还想做可视化监控和多维度分析,Micrometer + Prometheus 是个好选择:
typescript
@Configuration
publicclass MetricsConfig {
    @Bean
    public MeterRegistry meterRegistry() {
        // 定义通用标签,如应用名、环境等
        returnnew PrometheusMeterRegistry(
            PrometheusConfig.DEFAULT,
            new CollectorRegistry(),
            Clock.SYSTEM,
            new CommonTags("application", "my-app", "env", "prod")
        );
    }

    // 添加维度标签过滤器,防止基数爆炸
    @Bean
    public MeterFilter dimensionFilter() {
        // 一个指标最多100个uri维度,避免内存爆炸
        return MeterFilter.maximumAllowableTags("api.calls", "uri", 100);
    }

    // 基数控制:限制name标签组合不超过5000个
    @Bean
    public MeterFilter cardinalityLimiter() {
        returnnew MeterFilter() {
            @Override
            public Meter.Id map(Meter.Id id) {
                if (id.getName().equals("api.calls") &&
                    meterRegistry.find(id.getName()).tagKeys().size() > 5000) {
                    // 当标签组合超过5000时,归入"other"类别
                    return id.withTag("name", "other");
                }
                return id;
            }
        };
    }
}

@Component
publicclass ApiMetricsInterceptor implements HandlerInterceptor {
    privatefinal MeterRegistry meterRegistry;
    privatefinal ThreadLocal<Long> startTimeHolder = new ThreadLocal<>();

    // 路径参数解析器 - 避免误判合法数字
    privatefinal PathParameterResolver pathResolver = new PathParameterResolver();

    public ApiMetricsInterceptor(MeterRegistry meterRegistry) {
        this.meterRegistry = meterRegistry;
    }

    @Override
    public boolean preHandle(HttpServletRequest request, HttpServletResponse response, Object handler) {
        startTimeHolder.set(System.currentTimeMillis());

        if (handler instanceof HandlerMethod) {
            HandlerMethod handlerMethod = (HandlerMethod) handler;
            // 使用全限定类名避免冲突
            String apiName = handlerMethod.getBeanType().getName() + "." + handlerMethod.getMethod().getName();

            // 路径参数标准化
            String uri = pathResolver.standardizePath(request.getRequestURI());

            // 记录接口调用次数,使用标签而非字符串拼接
            meterRegistry.counter("api.calls",
                "name", apiName,
                "method", request.getMethod(),
                "uri", uri
            ).increment();
        }
        returntrue;
    }

    @Override
    public void afterCompletion(HttpServletRequest request, HttpServletResponse response, Object handler, Exception ex) {
        if (handler instanceof HandlerMethod && startTimeHolder.get() != null) {
            HandlerMethod handlerMethod = (HandlerMethod) handler;
            String apiName = handlerMethod.getBeanType().getName() + "." + handlerMethod.getMethod().getName();

            // 记录响应状态码
            String status = String.valueOf(response.getStatus());

            // 记录执行耗时
            long executionTime = System.currentTimeMillis() - startTimeHolder.get();
            meterRegistry.timer("api.latency",
                "name", apiName,
                "status", status
            ).record(executionTime, TimeUnit.MILLISECONDS);

            // 清理ThreadLocal避免内存泄漏
            startTimeHolder.remove();
        }
    }

    // 路径参数解析器内部类
    privatestaticclass PathParameterResolver {
        // 路径参数模式,如/user/{id}中的{id}
        privatefinal Pattern pathParamPattern = Pattern.compile("/\d+(/|$)");

        // 需要保留的数字路径(避免误判合法数字路径)
        privatefinal Set<String> preservedNumberPaths = Set.of(
            "/v1", "/v2", "/v3", // API版本
            "/2fa", "/oauth2"    // 特定路径
        );

        public String standardizePath(String uri) {
            // 对于需要保留的数字路径,直接返回
            for (String path : preservedNumberPaths) {
                if (uri.contains(path)) {
                    return uri;
                }
            }

            // 替换疑似ID参数,如/users/123 -> /users/{id}
            Matcher matcher = pathParamPattern.matcher(uri);
            StringBuffer sb = new StringBuffer();
            while (matcher.find()) {
                String match = matcher.group(0);
                String replacement = match.endsWith("/") ? "/{id}/" : "/{id}";
                matcher.appendReplacement(sb, replacement);
            }
            matcher.appendTail(sb);
            return sb.toString();
        }
    }
}
在 application.properties 中添加配置:
ini
management.endpoints.web.exposure.include=prometheus,health,info
management.metrics.export.prometheus.enabled=true
management.metrics.tags.application=${spring.application.name}
management.metrics.distribution.percentiles-histogram.http.server.requests=true
# 设置Prometheus抓取间隔与数据保留时间
# prometheus.yml中设置:
# scrape_interval: 15s
# storage.tsdb.retention.time: 15d
Prometheus 计数器是单调递增的,像汽车里程表一样只增不减。这设计很巧妙:即使服务重启,也不会丢失统计数据。
举个例子:假设一个接口 10 分钟内每分钟调用 100 次。传统方式直接记录"100"这个值,服务重启会丢失;
而 Prometheus 记录的是累计值,从 0 开始不断增加(100,200,300...)。重启后从新值开始继续累加,通过rate()函数计算两次采集间的变化率,依然能得到准确的"每分钟 100 次"这个结果。
图片
Prometheus 查询示例
ini
# 查询UserService.getUser接口每分钟调用率
rate(api_calls_total{name="UserService.getUser"}[1m])

# 查询接口95分位延迟
histogram_quantile(0.95, sum(rate(api_latency_seconds_bucket{name="UserService.getUser"}[5m])) by (le))

# 按状态码统计接口调用
sum(rate(api_calls_total{name="UserService.getUser"}[5m])) by (status)
五种方案的数据流架构对比
图片
图片
图片
图片
图片
混合方案:完整监控体系
在实际项目中,我发现单一方案往往不能满足所有需求,最佳组合是:
- 滑动窗口 - 服务内部的实时统计(毫秒级响应)
- Redis 存储 - 分布式聚合和短期历史查询(分钟级)
- Prometheus - 长期趋势和多维分析(小时/天级)
具体实现:
typescript
@Service
publicclass HybridApiMonitor {
    @Autowired
    private SlidingWindowCounter localCounter;

    @Autowired
    private RedisTimeSeriesCounter redisCounter;

    @Autowired
    private MeterRegistry meterRegistry;

    // 记录API调用
    public void recordApiCall(String apiName) {
        // 本地滑动窗口统计 - 实时查询用
        localCounter.increment(apiName);

        // Redis异步批量写入 - 本地缓冲后批量写Redis
        batchRedisWriter.add(apiName);

        // Prometheus长期趋势 - 加标签维度
        meterRegistry.counter("api.calls", "name", apiName).increment();
    }

    // 定时任务:每分钟将滑动窗口数据写入Redis
    @Scheduled(fixedRate = 60000)
    public void flushToRedis() {
        // 获取所有接口的分钟统计,批量写入Redis
        // 实现略
    }

    // 查询接口(提供多级统计数据)
    public ApiStats getApiStats(String apiName) {
        return ApiStats.builder()
            .realtimeQps(localCounter.getMinuteCount(apiName) / 60.0) // 实时QPS
            .last5MinutesTrend(redisCounter.getCountTrend(apiName, /* 时间范围 */)) // 分钟级趋势
            .prometheusQueryUrl("/grafana/d/apis?var-name=" + apiName) // 长期趋势查询链接
            .build();
    }
}
这种混合方案可以满足从秒级实时监控到月度趋势分析的全场景需求,各层级数据互为补充。
进阶:接口调用监控的实战经验与性能对比
我用 JMeter 对各方案做了次压测,配置如下:
- 测试环境: 4 核 8G 云服务器,JMeter 100 个并发线程,持续 10 分钟
- 测试数据: 随机访问 100 个不同接口,共生成 1000 万次调用
- 边界测试: 在稳定运行后突增至 500%流量,维持 30 秒
| 方案 | 内存占用(MB) | CPU 使用率 | QPS 上限 | 数据持久化 | 跨语言支持 | 监控延迟 | 适用场景 |
|---|---|---|---|---|---|---|---|
| 固定窗口计数器 | ~10 | ~2% | >20000 | 无 | 仅 Java | 实时 | 简单场景,单机应用 |
| 滑动窗口(标准版) | ~15 | ~5% | ~15000 | 无 | 仅 Java | 实时 | 需精确统计的单体应用 |
| 滑动窗口(懒加载版) | ~12 | ~3% | >18000 | 无 | 仅 Java | 实时 | 高性能需求场景 |
| AOP 透明统计 | ~20 | ~7% | ~10000 | 无 | Spring 框架 | 实时 | 代码零侵入需求 |
| Redis 分布式统计 | ~5(客户端) | ~4% | ~5000 | 24 小时 | 全语言 | <100ms | 分布式系统,集群环境 |
| Micrometer+Prometheus | ~30 | ~10% | ~8000 | 可配置 | 全语言 | 15-30 秒 | 需要可视化和告警场景 |
不同接口数量下的内存增长情况:
| 接口数量 | 固定窗口 | 标准滑动窗口 | 懒加载滑动窗口 |
|---|---|---|---|
| 1千 | 1MB | 2MB | 2MB |
| 1万 | 8MB | 20MB | 15MB |
| 10万 | 70MB | 200MB | 140MB |
| 100万 | OOM | OOM | 1.3GB |
实战中的典型问题与解决方案
1.内存溢出问题
生产环境中遇到过一次严重 OOM,排查发现是接口 URL 中包含大量随机参数(用户 ID、订单号等),导致 Map 键爆炸:
typescript
// 解决方案:使用Guava Cache限制Map大小
private LoadingCache<String, AtomicLong> counters = CacheBuilder.newBuilder()
    .maximumSize(10000)  // 最多存储10000个接口
    .expireAfterAccess(30, TimeUnit.MINUTES)  // 30分钟未访问自动清除
    .build(new CacheLoader<String, AtomicLong>() {
        @Override
        public AtomicLong load(String key) {
            return new AtomicLong(0);
        }
    });
2.分布式环境中的时钟漂移
我们在 K8s 环境中发现,不同 Pod 的时钟可能相差几秒,导致窗口边界不一致:
kotlin
// 解决方案:时钟同步方案对比
// 1. NTP同步(物理机最佳):apt install ntp
// 2. Redis时间服务(混合环境推荐)
@Service
publicclass RedisClockService implements ClockService {
    @Autowired
    private StringRedisTemplate redisTemplate;

    @Override
    public long currentTimeMillis() {
        return redisTemplate.execute((RedisCallback<Long>) connection ->
            connection.time()
        );
    }
}
// 3. K8s环境(容器集群最佳):使用PTP协议和NodeTime DaemonSet
3.高并发下的 Redis 性能问题
订单系统高峰期每秒 10 万+API 调用,每次都写 Redis 吃不消:
arduino
// 解决方案:本地缓冲+批量写入
publicclass BufferedRedisCounter {
    privatefinal ConcurrentHashMap<String, AtomicLong> buffer = new ConcurrentHashMap<>();
    privatefinal ScheduledExecutorService scheduler = Executors.newScheduledThreadPool(1);

    @Autowired
    private RedisTemplate<String, String> redisTemplate;

    public BufferedRedisCounter() {
        // 每秒批量写入Redis
        scheduler.scheduleAtFixedRate(this::flushToRedis, 1, 1, TimeUnit.SECONDS);
    }

    public void increment(String apiName) {
        // 本地增加计数
        buffer.computeIfAbsent(apiName, k -> new AtomicLong(0)).incrementAndGet();
    }

    private void flushToRedis() {
        if (buffer.isEmpty()) {
            return;
        }

        // 创建Redis管道,批量执行命令
        redisTemplate.executePipelined((RedisCallback<Object>) connection -> {
            buffer.forEach((api, count) -> {
                long value = count.getAndSet(0); // 重置缓冲区
                if (value > 0) {
                    String key = "api:counter:" + api + ":" +
                        ZonedDateTime.now(ZoneOffset.UTC).format(DateTimeFormatter.ofPattern("yyyyMMddHHmm"));
                    connection.incrBy(key.getBytes(), value);
                    connection.expire(key.getBytes(), 3600); // 1小时过期
                }
            });
            returnnull;
        });
    }
}
容量规划建议
基于压测数据,以下是各方案的容量规划建议:
1.固定/滑动窗口: 每 1 万个接口约需 15-20MB 内存,JVM 堆建议为:
接口数 < 1万:堆内存 >= 512MB
接口数 < 10万:堆内存 >= 2GB
接口数 > 10万:建议使用Redis方案
2.Redis 分布式统计: 按每个接口每分钟 100 字节估算:
1千接口,保留7天:~1GB
1万接口,保留7天:~10GB
推荐Redis集群配置:3主3从,每节点16GB
3.Prometheus: 时序数据库容量:
公式:磁盘空间 ≈ 每秒样本数 × 样本大小 × 保留时间
1千接口,15秒采集,保留30天:~50GB
高基数限制:单指标标签组合不超过5000
总结
| 方案 | 复杂度 | 核心优点 | 核心缺点 | 适用场景 |
|---|---|---|---|---|
| 固定窗口计数器 | 低 | 实现极简,代码量少,资源消耗最低 | 窗口重置时统计出现边界误差,跨窗口调用统计不准确 | 单机测试、原型验证场景 |
| 滑动窗口计数器 | 中 | 时间精度高(秒级分片),无边界误差,支持懒加载优化 | synchronized 方法在高并发下形成锁竞争,内存消耗随窗口数量增加 | 单体应用精确统计需求 |
| AOP 透明统计 | 中 | 无侵入式集成,与业务代码解耦,支持多维度标签 | 引入 AOP 代理会增加方法调用开销,Spring 框架依赖较强 | Spring 生态中追求开发便捷性场景 |
| Redis 分布式统计 | 高 | 跨实例聚合数据,支持集群环境,可存储历史趋势 | Redis 网络延迟导致实时性降低,依赖外部存储,故障时数据可能丢失 | 微服务架构、需要历史查询能力场景 |
| Micrometer+Prometheus | 高 | 完整监控生态,支持多维标签、告警、可视化仪表盘,可自定义各种聚合分析 | 配置复杂,资源消耗较大,需要部署监控系统,学习成本高 | 企业级生产环境、需完整监控链路场景 |