硬件:
- ESP32,再用一个IO扩展板,板子的弹簧端子用起来不方便。
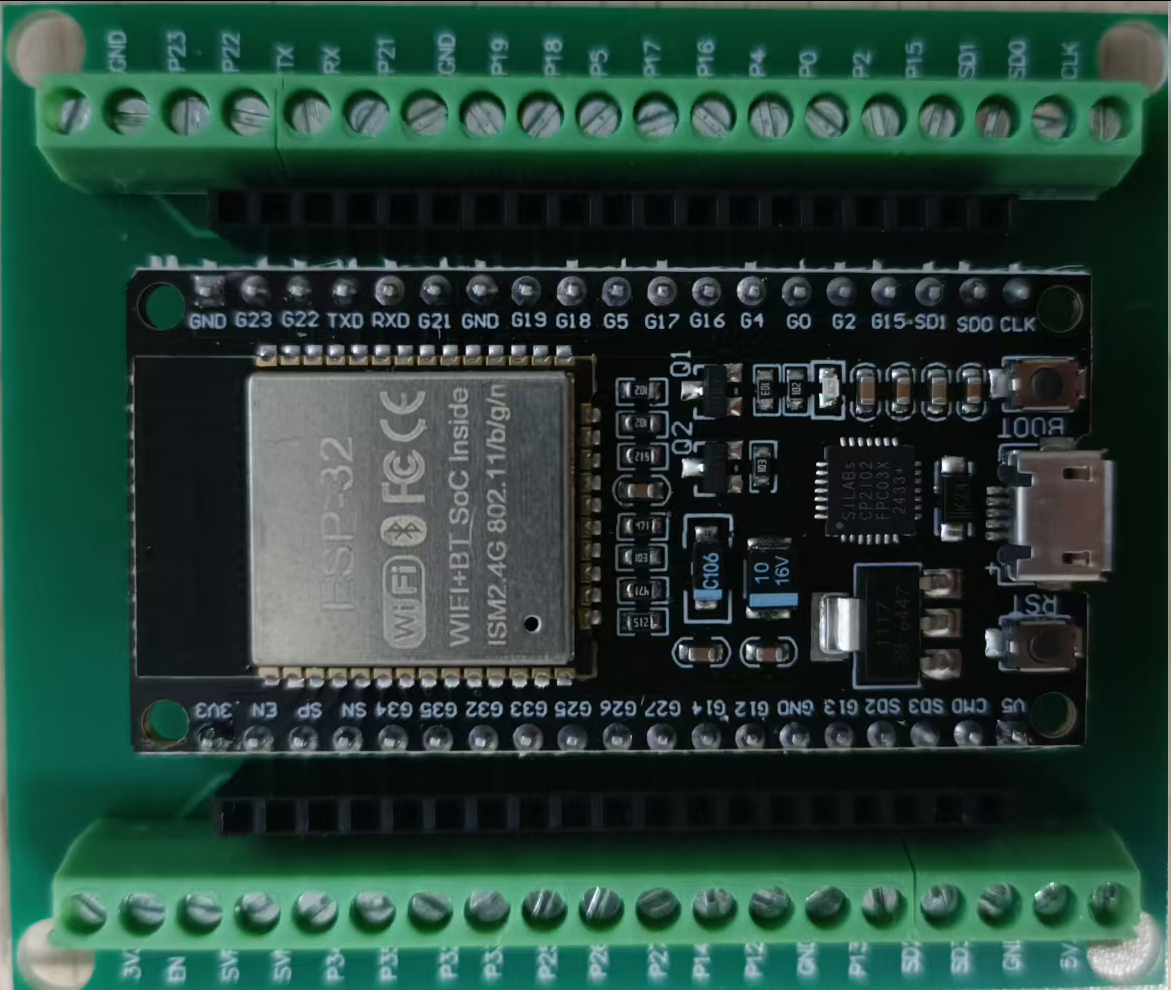
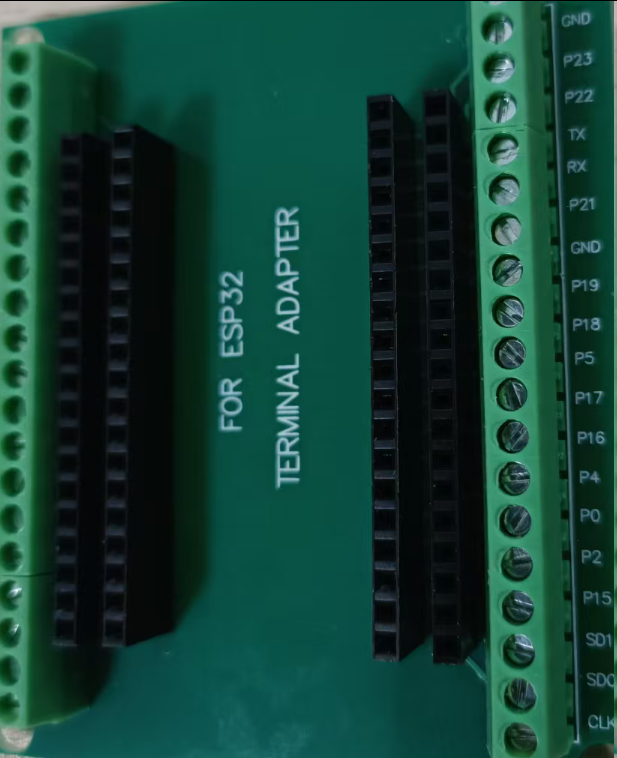
内侧两列针脚距离是26mm,开发板针脚丝印标记在前面的宽度都差不多。
-二氧化碳传感器MH-Z19E,是NDIR(非分散红外技术),需要预热2-3分钟后出正确数据,测量范围是400~5000。通电正常,会闪烁光芒。
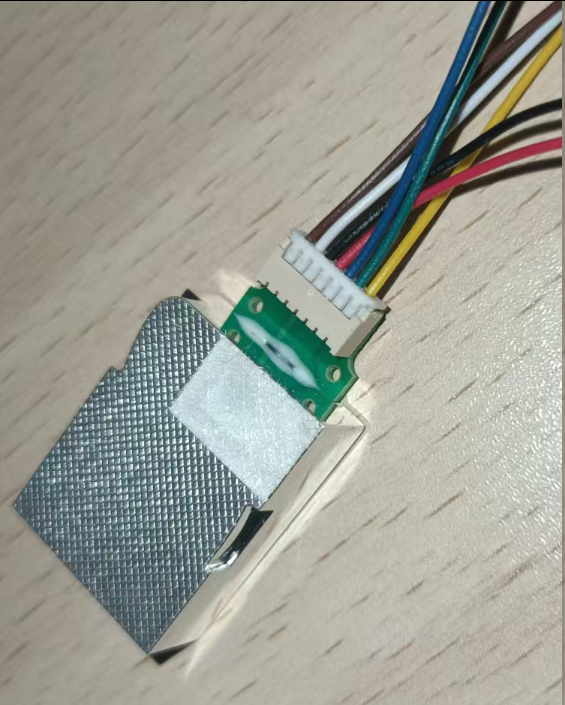
接4根线,两根是电源,用板子的5V.
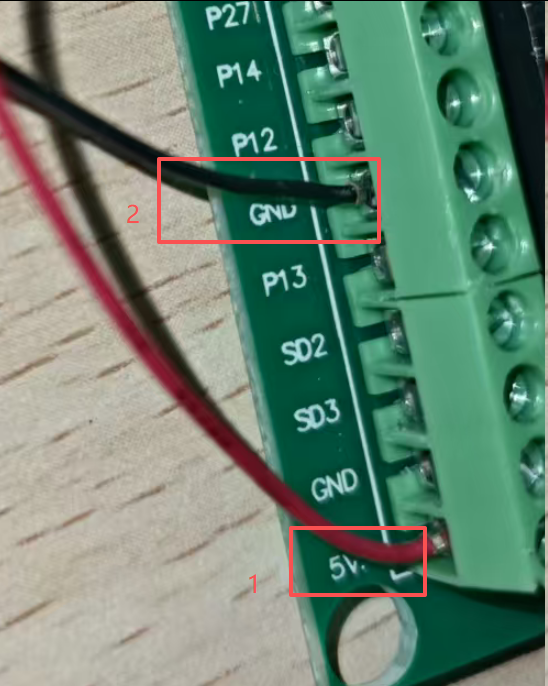
5V顶头的是CND,不能用。
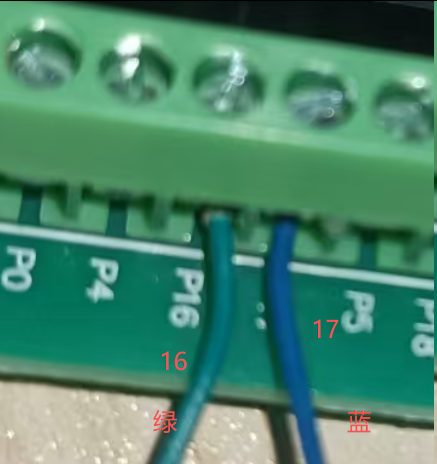
选择UART2,不能选择UART0(被USB调试占用)
- 电源,可以用5V充电器,也可以电脑USB供电。
软件
系统是micropython,用异步任务比较方便。Web框架还是microdot,用它自带的websocket类。
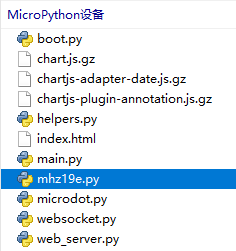
microdot的src目录找到microdot.py, websocket.py,helper.py上传。
chartjs的文件从web链接保存下来的。问智谱(GLM-4.6),让它写个chartjs的例子,代码会给出链接,或者到官方网站去。
按照惯例,使用7zip进行压缩,要选择"添加到压缩包...",注意后缀是.gz 。
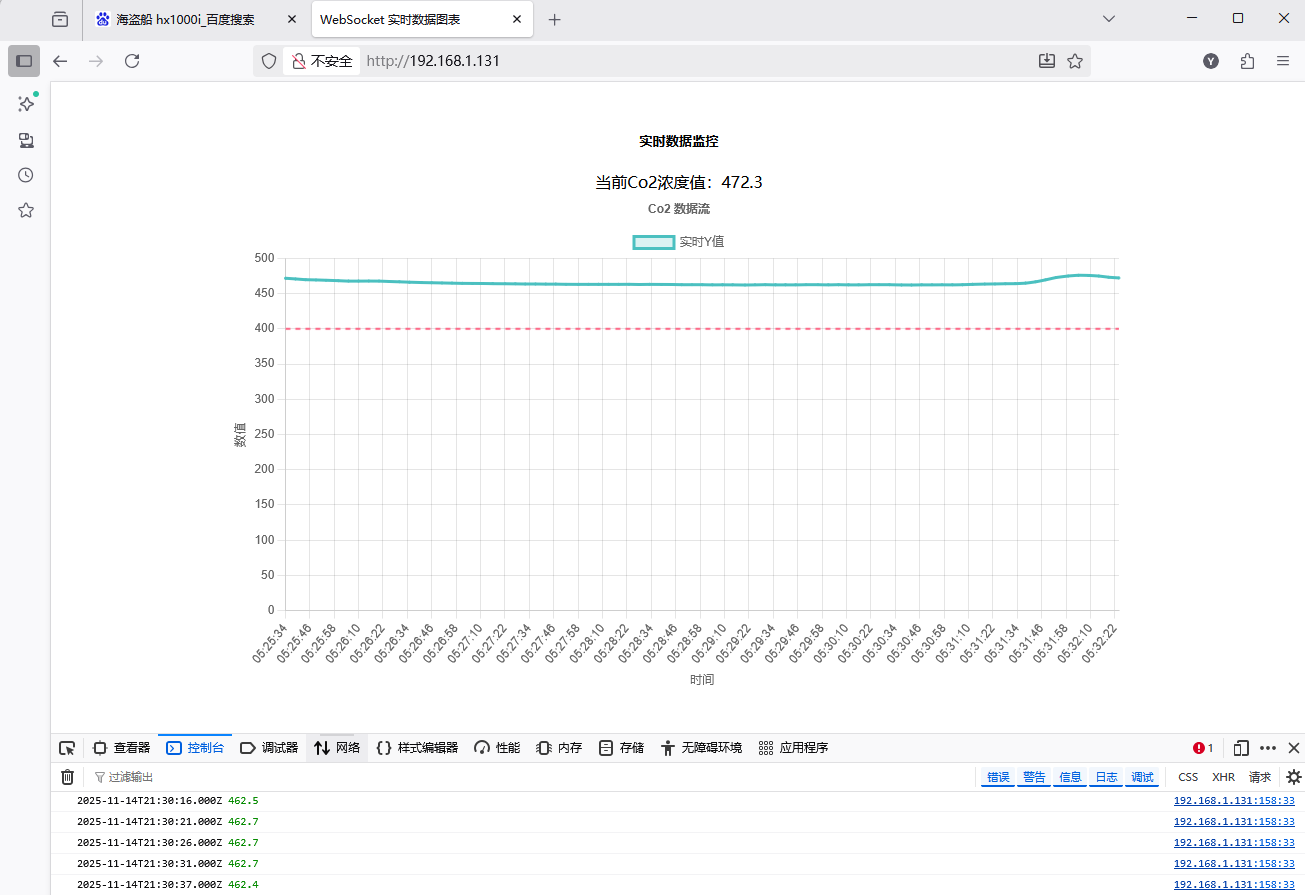
使用F12查看控制台错误和websocket的响应。
代码
代码是描述给ai,让它给咱打工,咱只是负责检查、反馈。
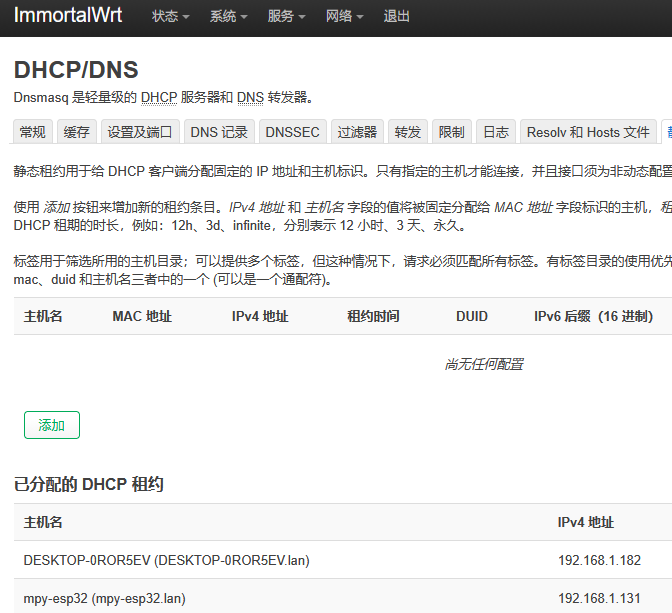
wifi为简单起见,直接连自家路由,ip是在openwrt的DHCP里面直接看的。
- 主函数
python
from web_server import WebServerMicrodot
from mhz19e import  MHZ19E
import uasyncio
import network

# main
async def main():
    wlan = network.WLAN(network.STA_IF)
    wlan.active(True)
    if not wlan.isconnected():
        print('connecting to network...')
        try:
            wlan.connect('fengy09', '01234567')
        except:
                ap = network.WLAN(network.WLAN.IF_AP)
                ap.config(ssid='ESP-AP')
                ap.config(max_clients=10)
                ap.active(True)
    else:
        print('ip:',   wlan.ifconfig()[0] )

    co2_sensor=MHZ19E()
     # 初始化 Web 服务器,并将传感器实例传入
    web_server = WebServerMicrodot(co2=co2_sensor)
    #启动服务器 (这个函数内部会启动生产者任务)
    await web_server.start_server()


if __name__ == "__main__":
    uasyncio.run(main())
只有一个web task。
- 后端
读串口的函数也写在web类里。要求第1次websocket连接时,发送历史数据给web,然后就只发1个当前数据。
web_server.py
python
from microdot import Microdot, send_file
from websocket import with_websocket
from collections import deque
from mhz19e import MHZ19E
import ujson
import uasyncio
import time


MAX_HISTORY_POINTS = 500

class WebServerMicrodot:
    def __init__(self, co2: MHZ19E):
        self.app = Microdot()
        self.co2 = co2

        # 队列: 用于存储历史数据,供客户端首次连接时使用
        self.history_queue = deque([], MAX_HISTORY_POINTS)
        # 存储所有活动WebSocket连接的集合
        self.connected_websockets = set()

        self.setup_routes()

    async def read_mhz19(self):
        """
       任务:每5秒读取一次传感器数据,并将其放入队列。
        """

        while True:
            try:
                # 1. 读取传感器数据
                # mhz19e.py 中的 read_data 是一个 async 函数,所以需要 await
                co2_value = await self.co2.read_data()
                co2_value=round(co2_value,1)

                if co2_value is not None:
                    # 2. 创建带时间戳的数据点
                    timestamp = time.time()
                    dt = time.gmtime(timestamp)
                    now_iso = f'{dt[0]:04d}-{dt[1]:02d}-{dt[2]:02d}T{dt[3]:02d}:{dt[4]:02d}:{dt[5]:02d}.000Z'
                    new_data_point = {'x': now_iso, 'y': co2_value}
                    print(now_iso,co2_value)
                    # 3. 将新数据点加入历史队列
                    self.history_queue.append(new_data_point)
                     # 2. 将新数据广播给所有连接的客户端
                    if self.connected_websockets:
                        message = ujson.dumps({'type': 'update', 'data': new_data_point})
                        # 创建一个副本进行迭代,防止在迭代过程中集合被修改
                        for ws in list(self.connected_websockets):
                            try:
                                await ws.send(message)
                            except Exception as e:
                                print(f"Error sending to a client: {e}. Client might be disconnected.")
                                # 发送失败,从集合中移除
                                self.connected_websockets.discard(ws)
            except  Exception as e:
                  print(f'读传感器时错误:{e}')
            # 5. 等待5秒
            await uasyncio.sleep(5)

    def setup_routes(self):
        """设置路由"""
        @self.app.route('/')
        async def index(request):
            return send_file('index.html')

        # ... 其他静态文件路由保持不变 ...
        @self.app.route('/chart.js')
        async def script_chart(request):
            return send_file('chart.js.gz', compressed=True)

        @self.app.route('/chartjs-adapter-date.js')
        async def script_chart(request):
            return send_file('/chartjs-adapter-date.js.gz', compressed=True)

        @self.app.route('/chartjs-plugin-annotation.js')
        async def script_chart(request):
            return send_file('/chartjs-plugin-annotation.js.gz', compressed=True)

        @self.app.errorhandler(404)
        async def not_found(request):
            return '页面未找到', 404

        @self.app.route('/ws')
        @with_websocket
        async def handle_websocket(request, ws):
            """
            处理WebSocket连接。
            1. 首次连接时发送所有历史数据。
            2. 将连接加入活动连接池。
            3. 维持连接直到断开。
            """
            print(f"New WebSocket connection from {request.client_addr}")

            # 1. 发送历史数据
            if self.history_queue:
                initial_data = list(self.history_queue)
                initial_message = ujson.dumps({'type': 'initial', 'data': initial_data})
                await ws.send(initial_message)
                print(f"Sent {len(initial_data)} historical data points to new client.")
            else:
                print("No historical data to send.")

            # 2. 将连接加入活动连接池
            self.connected_websockets.add(ws)
            print(f"Total connected clients: {len(self.connected_websockets)}")

            try:
                # 3. 循环接收消息以保持连接活跃,并检测断开
                while True:
                    # 使用 receive() 等待消息,如果客户端断开,会引发异常
                    msg = await ws.receive()
                    # 这里可以处理来自客户端的消息,例如心跳包
                    print(f"Received message from client: {msg}")
            except Exception as e:
                # 连接关闭时会触发异常
                print(f"WebSocket connection closed or error: {e}")
            finally:
                # 4. 确保连接从池中移除
                self.connected_websockets.discard(ws)
                print(f"Client disconnected. Total connected clients: {len(self.connected_websockets)}")


    async def start_server(self):
        """启动Microdot服务"""
        print("启动Microdot服务...")
        # 创建并启动数据任务
        uasyncio.create_task(self.read_mhz19())
        # 启动Web服务器,这会阻塞直到服务器停止
await self.app.start_server(port=80, debug=False)好多例子都是读了两个字节,直接计算二氧化碳值。这里需要进行转换,0对应400,0xff对应5000,为节省资源直接写了sclale值。
python
from machine import UART
#import time
import uasyncio


class MHZ19E:
    """
    用于与 MH-Z19E CO2 传感器通信的驱动类。
    该类封装了通过 UART 发送命令、读取响应、校验数据以及解析 CO2 和温度值的全部功能。
    """

    def __init__(self, uart_id=2, tx=17, rx=16, baudrate=9600):
        """
        初始化 MH-Z19E 传感器。

        参数:
            uart_id (int): 要使用的 UART 端口号,默认为 2。
            tx (int): 连接到传感器 RXD 的 ESP32 引脚号,默认为 17。
            rx (int): 连接到传感器 TXD 的 ESP32 引脚号,默认为 16。
            baudrate (int): 通信波特率,默认为 9600。
        """
        self.tx_pin = tx
        self.rx_pin = rx
        self.baudrate = baudrate
        # 构建读取命令: 0xFF 0x01 0x86 ...
        self.cmd = bytearray([0xFF, 0x01, 0x86, 0x00, 0x00, 0x00, 0x00, 0x00])
        self.cmd.append(self._calculate_checksum(self.cmd))

        # 初始化 UART,推荐使用 UART2 以避免与 REPL 冲突
        self.uart = UART(uart_id, baudrate=self.baudrate, tx=self.tx_pin, rx=self.rx_pin)
        print(f"MH-Z19E 传感器已在 UART{uart_id} (TX: {tx}, RX: {rx}) 上初始化。")

    def convert(self,  analog_value: int) -> float:
        """
        将0-65535范围的模拟量线性转换为400-5000范围的物理量。
        """
        # 定义输入和输出范围
        in_min = 0
        in_max = 65535  # 16位无符号整数的最大值
        out_min = 400.0
        out_max = 5000.0

        # 计算比例因子
        scale = 0.07019  # (out_max - out_min) / (in_max - in_min)
        # 执行线性转换
        physical_value = out_min + scale * (analog_value - in_min)
        return physical_value

    def _calculate_checksum(self, data):
        """
        计算命令或响应的校验和。
        这是 MH-Z19E 协议的内部方法。
        """
        return 0xFF - (sum(data) & 0xFF)

    async def read_data(self):
        """
        从传感器读取 CO2 浓度和温度。

        返回:
            tuple: (co2_ppm, temperature_celsius) 如果读取成功。
            None: 如果读取失败、校验错误或无响应。
        """
        #  发送命令
        self.uart.write(self.cmd)

        # 3. 等待并读取响应
        #time.sleep_ms(100)  # 给传感器一些时间响应
        await uasyncio.sleep_ms(100)
        if self.uart.any() >= 9:
            response = self.uart.read(9)

            if response is None or len(response) != 9:
                print("错误: 响应数据长度不正确。")
                return None

            # 4. 验证校验和
            if response[8] != self._calculate_checksum(response[:8]):
                print(f"错误: 校验和不匹配!")
                return None

            # 5. 解析数据
            # 响应格式: 0xFF 0x01 0x86 <CO2_H> <CO2_L> <Temp> <Status> <...> <Checksum>
            co2_raw = (response[2] << 8) | response[3]
            co2_value=self.convert(co2_raw)

            # 6. 检查状态
            status_byte = response[5]
            if status_byte == 0x40:
                print("警告: 传感器正在预热中,读数可能不准确。")
            elif status_byte != 0x00:
                print(f"警告: 传感器状态异常,状态码: {hex(status_byte)}")

            # print (f'Co2:{co2_value}',)
            return co2_value
        else:
            print("错误: 未收到传感器响应。")

    def calibrate_zero_point(self):
        """
        在 400ppm 环境下进行零点校准。
        请将传感器置于室外清新空气中(约400ppm)3分钟后执行此命令。
        """
        print("开始零点校准... (请确保传感器在400ppm环境中)")
        cmd = bytearray([0xFF, 0x01, 0x87, 0x00, 0x00, 0x00, 0x00, 0x00])
        cmd.append(self._calculate_checksum(cmd))
        self.uart.write(cmd)
        print("零点校准命令已发送。")
index.html
没有使用js和css库。
html
<!-- index.html -->

<!DOCTYPE html>
<html lang="zh-CN">
<head>
    <meta charset="UTF-8">
    <meta name="viewport" content="width=device-width, initial-scale=1.0">
    <title>WebSocket 实时数据图表</title>
    <!-- 1. 引入 Chart.js 库 -->
    <script src="/chart.js"></script>
    <!-- 引入日期适配器,用于处理时间轴 -->
    <script src="/chartjs-adapter-date.js"></script>
    <script src="/chartjs-plugin-annotation.js"></script>
    <style>
        body {
            font-family: sans-serif;
            display: flex;
            flex-direction: column;
            align-items: center;
            padding: 20px;
        }
        #chart-container {
            width: 90%;
            max-width: 900px;
            height: 500px; /* 给容器一个固定高度 */
        }
    </style>
</head>
<body>

    <h5>实时数据监控</h5>
    <!-- Co2值 -->
    <div id="co2_value">
    </div>
    <!-- 2. 用于绘制图表的 Canvas 元素 -->
    <div id="chart-container">
        <canvas id="myChart"></canvas>
    </div>

    <script>
        const maxDataPoints = 2000;
        // 3. 初始化 Chart.js 图表
        const ctx = document.getElementById('myChart').getContext('2d');
        const myChart = new Chart(ctx, {
            type: 'line', // 图表类型为折线图
            data: {
                // 数据集
                datasets: [{
                    label: '实时Y值', // 数据集的标签
                    data: [], // 初始数据为空,将由WebSocket填充
                    borderColor: 'rgb(75, 192, 192)', // 线条颜色
                    backgroundColor: 'rgba(75, 192, 192, 0.2)', // 填充区域颜色
                    tension: 0.1, // 线条弯曲度,0为直线
                    pointRadius: 1 // 数据点半径
                }]
            },
            options: {
                responsive: true,
                maintainAspectRatio: false, // 允许图表填满容器
                scales: {
                    // X轴配置
                    x: {
                        type: 'time', // 关键:设置X轴为时间轴
                        time: {
                            timezone: 'UTC',
                            unit: 'second', // 时间单位
                            displayFormats: {
                                second: 'HH:mm:ss' // 时间显示格式
                            }
                        },
                        title: {
                            display: true,
                            text: '时间'
                        }
                    },
                    // Y轴配置
                    y: {
                        beginAtZero: true, // Y轴从0开始
                        title: {
                            display: true,
                            text: '数值'
                        }
                    }
                },
                plugins: {
                    title: {
                        display: true,
                        text: 'Co2 数据流'
                    },
                    annotation: {
                        annotations: {
                            // 定义一个名为 'line1' 的注释
                            line1: {
                                type: 'line', // 类型是 'line'
                                yMin:400,     // 线的起始 y 值
                                yMax: 400,     // 线的结束 y 值 (与 yMin 相同即为水平线)
                                borderColor: 'rgb(255, 99, 132)', // 线的颜色
                                borderWidth: 2,                   // 线的宽度
                                borderDash: [5, 5],               // 虚线样式 (可选)
                                label: {
                                    // 为线条添加一个标签
                                    content: 'y = 50',
                                    enabled: true,
                                    position: 'end', // 标签位置 ('start', 'center', 'end')
                                    yAdjust: -10, // 微调标签y位置
                                    backgroundColor: 'rgba(255, 99, 132, 0.8)',
                                    font: {
                                        size: 12
                                    }
                                }
                            }
                        }
                    }
                } //plugin
            } //option
        });
        // 更新显示的CO2数值
         const co2_value= document.getElementById('co2_value')
        function updateCO2Display(currentCO2) {
            // 更新div内容
            co2_value.innerHTML = '当前Co2浓度值:' + currentCO2;
           }

        // 4. 创建 WebSocket 连接
        // 注意:地址和端口必须与Python服务器匹配
        let ws;
        function connect() {
            const ws = new WebSocket('ws://' + location.hostname + '/ws');
            ws.onopen = function(event) {
                console.log("WebSocket 连接已建立。");
                // 可以在这里发送一条初始化消息给服务器,如果需要的话
                ws.send("hi");
            };
            ws.onmessage = function(event) {
                  try {
                    // 解析收到的JSON数据
                    const message = JSON.parse(event.data);

                    // 检查数据类型
                    if (message.type === 'initial') {
                        // 处理数据队列(多个数据点)
                        const dataQueue = message.data;
                        if (Array.isArray(dataQueue)) {
                            // 将队列中的每个数据点添加到图表
                            dataQueue.forEach(point => {
                                myChart.data.datasets[0].data.push({
                                    x: point.x,
                                    y: point.y
                                });
                            });
                        }
                    } else  if (message.type === 'update'){
                            // 处理单个数据点
                        // 限制数据点数量,避免内存溢出和图表卡顿
                        if (myChart.data.datasets[0].data.length >= maxDataPoints) {
                            myChart.data.datasets[0].data.shift(); // 移除最旧的数据点
                        }
                        console.log(message.data.x,message.data.y);
                        myChart.data.datasets[0].data.push({
                            x: message.data.x,
                            y: message.data.y
                        });
                    }
                    //显示当前值
                    updateCO2Display(message.data.y);
                    // 更新图表显示
                    myChart.update('none'); // 使用 'none' 模式可以提高性能,避免动画

                } catch (error) {
                    console.error("处理WebSocket消息时出错:", error);
                }
            };

            ws.onerror = function(error) {
                console.error("WebSocket 错误:", error);
            };

            ws.onclose = function(event) {
                console.log("WebSocket 连接已关闭。", event.code, event.reason);
                // 可以在这里添加重连逻辑
            };
        }
         // 页面加载完成后立即尝试连接
        window.onload = connect;
    </script>

</body>
</html>
使用Chartjs,需要注意时区。返回的时间字符串末尾带z,会有时差。esp32没有校正时间,因此时间是不对的。
- 结论
冬天来了,新楼房密封好,睡一宿没有通风、净化,二氧化碳浓度还是很高的。
如果睡的不舒服,可以检查空气质量。
用esp32来做,打算让它控制松下空调的净化,结果松下空调净化只分解甲醛等,不吸收二氧化碳不送新风。