一、Pod 日志收集
1.开源方案 EFK
- Elasticsearch:开源的分布式搜索和分析引擎,建立在 Apache Lucene 库之上(保存端)
- Kibana:开源的数据可视化和分析平台,与Elasticsearch紧密集成(展示和搜索端)
- Filebeat:轻量级的开源日志数据收集器,收集、解析和发送日志文件和其他结构化数据到Elasticsearch或Logstash等目标系统进行处理和分析(采集端)
注:需要海量数据搜索、实时日志分析 → 选Elasticsearch;需要强事务、复杂关联查询 → 选MySQL
2.k8s日志收集
- 在k8s集群中,不建议应用写日志文件 ,建议打到stdout(标准输出)stderr(标准错误输出)
- 容器默认情况下就会把这些日志输出到宿主机上的一个 JSON 文件之中,同样我们也可以通过 docker logs 或者 kubectl logs 来查看到对应的日志信息
真正存放日志目录:
- container log: /var/log/containers/*.log
- Pod log:/var/log/pods
注:日志以文件的形式存在,有写满的风险;需要受 logrotate 控制,定期清空
3.集群级别日志架构
节点级日志代理
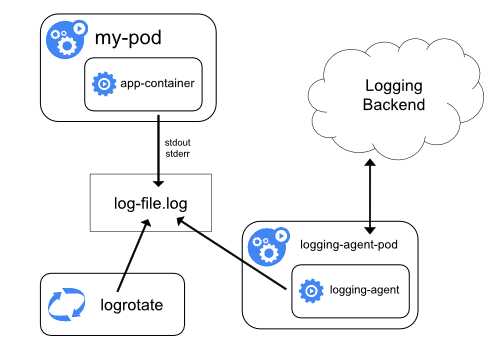
- 应用写日志:app-container 将日志写入容器内的 log-file.log
- 日志轮转管理:logrotate 定期处理日志文件(压缩、归档、删除旧日志)
- 日志采集转发:logging-agent(如 Filebeat/Fluentd)采集日志并发送到 Logging Backend(如 Elasticsearch)
边车容器运行日志代理 sidecar
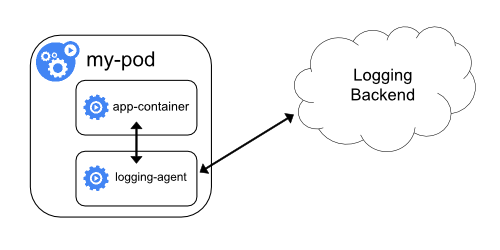
- 应用容器写日志:app-container 将日志输出到标准输出或日志文件
- Sidecar 容器采集:logging-agent(Sidecar容器)实时读取应用容器的日志
- 转发到日志后端:logging-agent 将采集的日志发送到 Logging Backend(如Elasticsearch)
应用中直接暴露日志目录
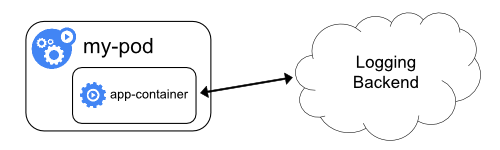
- 应用输出日志:app-container 直接将日志输出到 标准输出(stdout/stderr)
- 容器运行时采集:Kubernetes/容器平台自动捕获容器的标准输出日志,并发送到 Logging Backend
二、日志采集-传统架构
1.Elasticsearch 基础概念
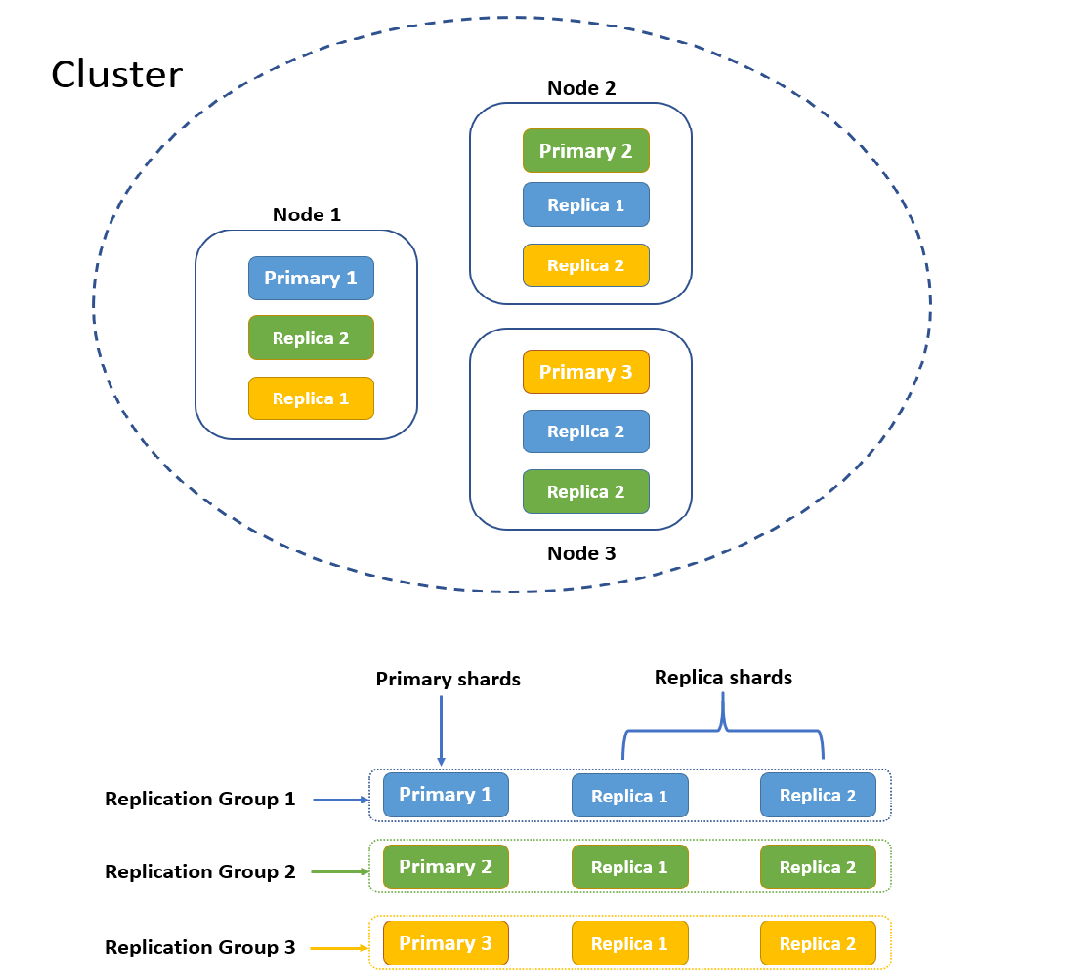
- 集群:Elasticsearch 集群是一组 Elasticsearch 节点的集合,目的是实现容错和高可用
- 节点 node:指一个Elasticsearch实例
- 索引 index:用于存储和管理相关数据的逻辑容器,可以看作数据库中的一个表
- 分片 shard:分片包含索引数据的一个子集,目的是分割巨大的索引,将数据分散到集群内各处;分片分为主分片和副本分片,一般情况,一个主分片有多个副本分片;主分片负责处理写入请求和存储数据 ,副本分片只负责存储数据
2.Elasticsearch 安装
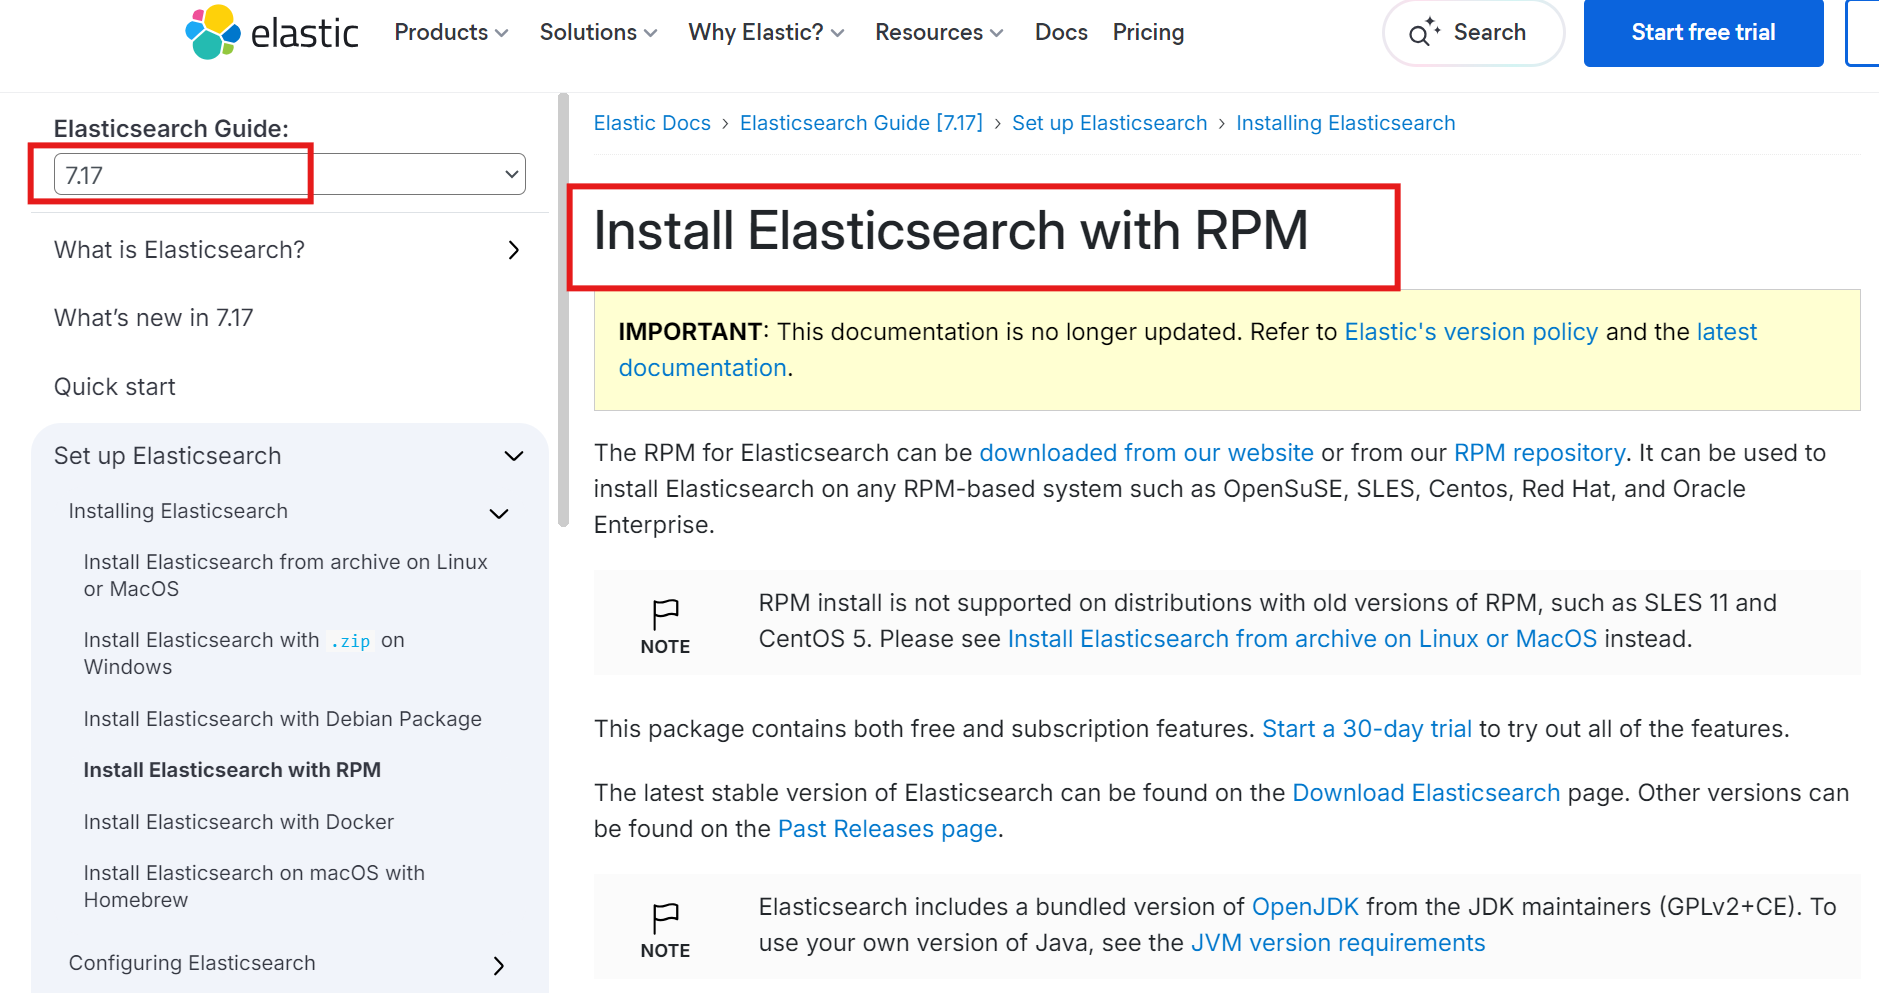
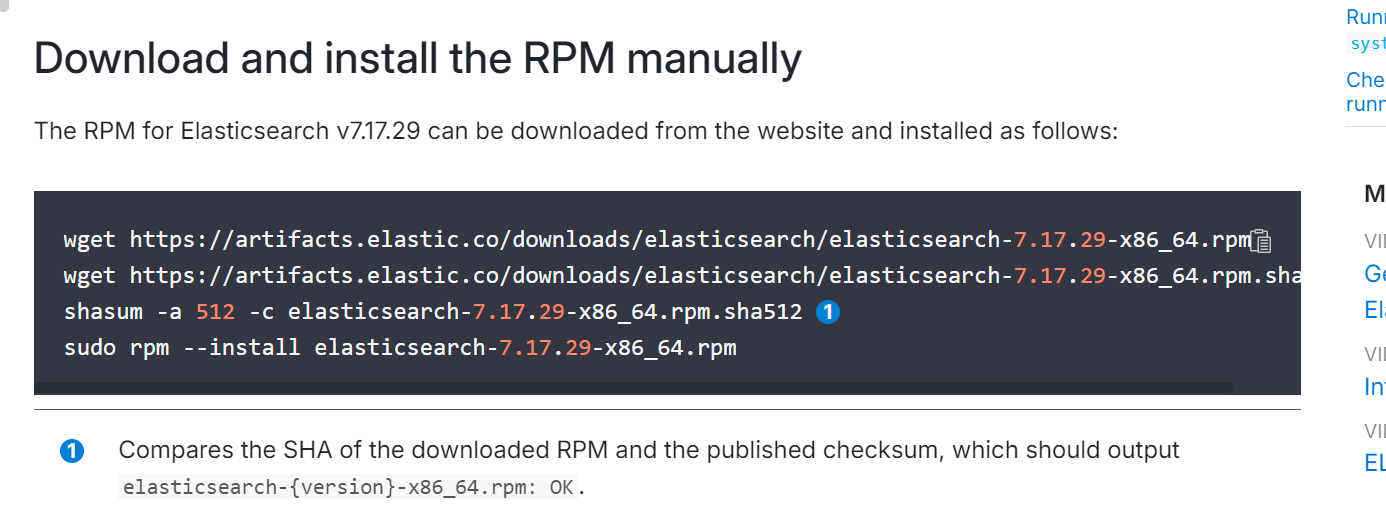
# 下载rpm包
[root@localhost ~]# wget https://artifacts.elastic.co/downloads/elasticsearch/elasticsearch-7.17.16-x86_64.rpm

# 安装rpm包
[root@localhost ~]# rpm -ivh elasticsearch-7.17.16-x86_64.rpm

[root@localhost ~]# cd /etc/elasticsearch/
[root@localhost elasticsearch]# vi elasticsearch.yml

cluster.name: my-cluster
node.name: node-1
path.data: /data/elasticsearch
network.host: 0.0.0.0
http.port: 9200
discovery.seed_hosts: ["192.168.5.5"]
cluster.initial_master_nodes: ["192.168.5.5"]


[root@localhost elasticsearch]# mkdir -p /data/elasticsearch

# 确保elasticsearch用户对目录有权限
[root@localhost elasticsearch]# chown -R elasticsearch:elasticsearch /data/elasticsearch

# 启动服务
[root@localhost elasticsearch]# systemctl start elasticsearch

# 查看集群日志
[root@localhost ~]# tail -f /var/log/elasticsearch/my-cluster.log

# 查看监听端口
[root@localhost ~]# netstat -nlpt | grep java
tcp6       0      0 :::9200                 :::*                    LISTEN      1373/java
tcp6       0      0 :::9300                 :::*                    LISTEN      1373/java
3.检查集群状态
[root@localhost ~]# curl -XGET 127.0.0.1:9200/_cluster/health\?pretty
{
"cluster_name" : "my-cluster",
"status" : "green", # 集群状态(正常),yellow是有问题但能正常使用,red是不能使用
"timed_out" : false,
"number_of_nodes" : 1,
"number_of_data_nodes" : 1,
"active_primary_shards" : 3,
"active_shards" : 3,
"relocating_shards" : 0,
"initializing_shards" : 0,
"unassigned_shards" : 0,
"delayed_unassigned_shards" : 0,
"number_of_pending_tasks" : 0,
"number_of_in_flight_fetch" : 0,
"task_max_waiting_in_queue_millis" : 0,
"active_shards_percent_as_number" : 100.0
}
补充命令:
# 列出节点健康状态
curl -XGET 127.0.0.1:9200/_cat/health?v
# 列出 master节点
curl -XGET 127.0.0.1:9200/_cat/master?v
# 列出节点及利用率
curl -XGET 127.0.0.1:9200/_cat/nodes?v
# 显示索引
curl localhost:9200/_cat/indices?v4.Kibana 安装
[root@localhost ~]# wget https://artifacts.elastic.co/downloads/kibana/kibana-7.17.16-x86_64.rpm
[root@localhost ~]# rpm -ivh kibana-7.17.16-x86_64.rpm

[root@localhost ~]# cd /etc/kibana/
[root@localhost kibana]# vi kibana.yml

server.port: 5601
server.host: "0.0.0.0"
elasticsearch.hosts: ["http://192.168.5.5:9200"]

[root@localhost kibana]# systemctl start kibana

[root@localhost ~]# netstat -nltp | grep 5601
tcp 0 0 0.0.0.0:5601 0.0.0.0:* LISTEN 1972/node 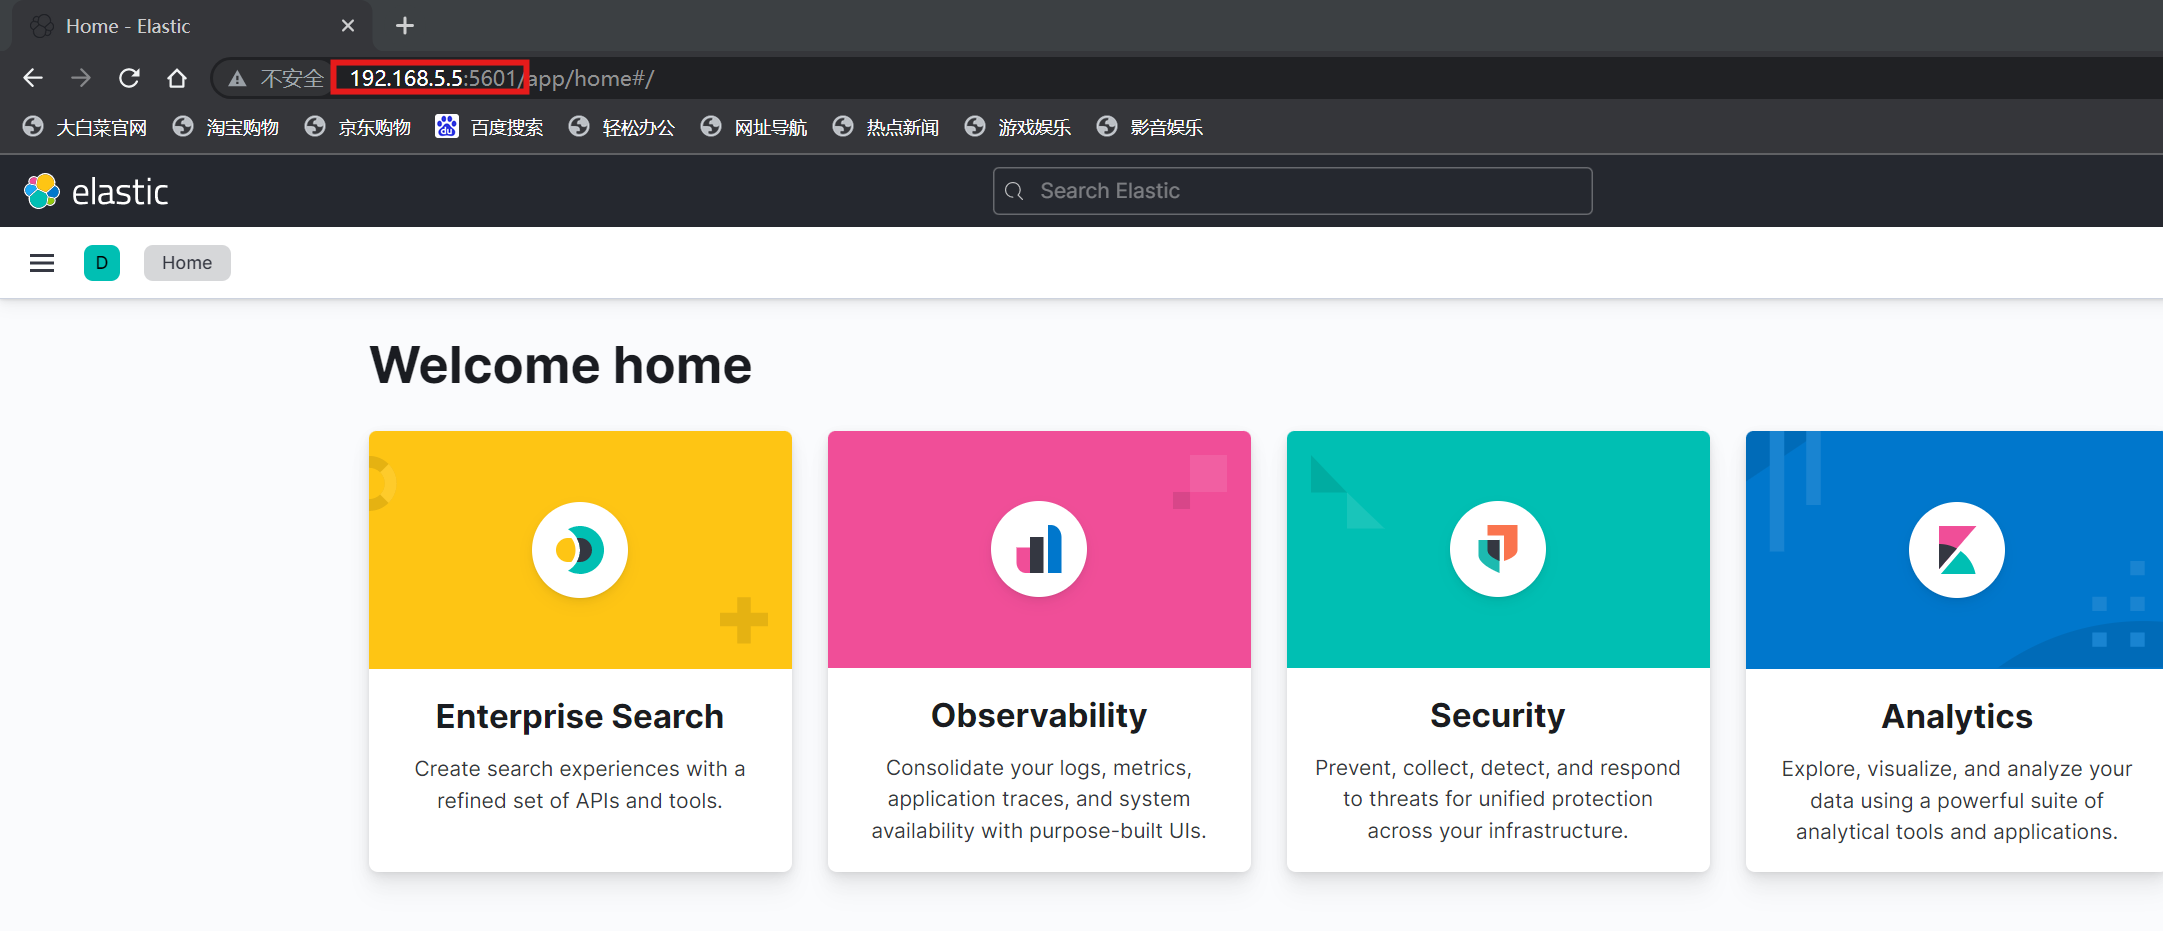
5.Filebeat 安装
注:filestream input------从日志文件中 采集
[root@localhost ~]# rpm --import https://artifacts.elastic.co/GPG-KEY-elasticsearch
[root@localhost ~]# cat > /etc/yum.repos.d/elastic.repo << EOF
[elastic-7.x]
name=Elastic repository for 7.x packages
baseurl=https://artifacts.elastic.co/packages/7.x/yum
gpgcheck=1
gpgkey=https://artifacts.elastic.co/GPG-KEY-elasticsearch
enabled=1
autorefresh=1
type=rpm-md
EOF
[root@localhost ~]# dnf -y install filebeat-7.17.15
[root@localhost ~]# cd /etc/filebeat/
[root@localhost filebeat]# vi filebeat.yml
enabled: true
paths:
- /var/log/*.log
- /var/log/messages*
- /var/log/elasticsearch/*.log
hosts: ["192.168.5.5:9200"]
[root@localhost filebeat]# systemctl start filebeat
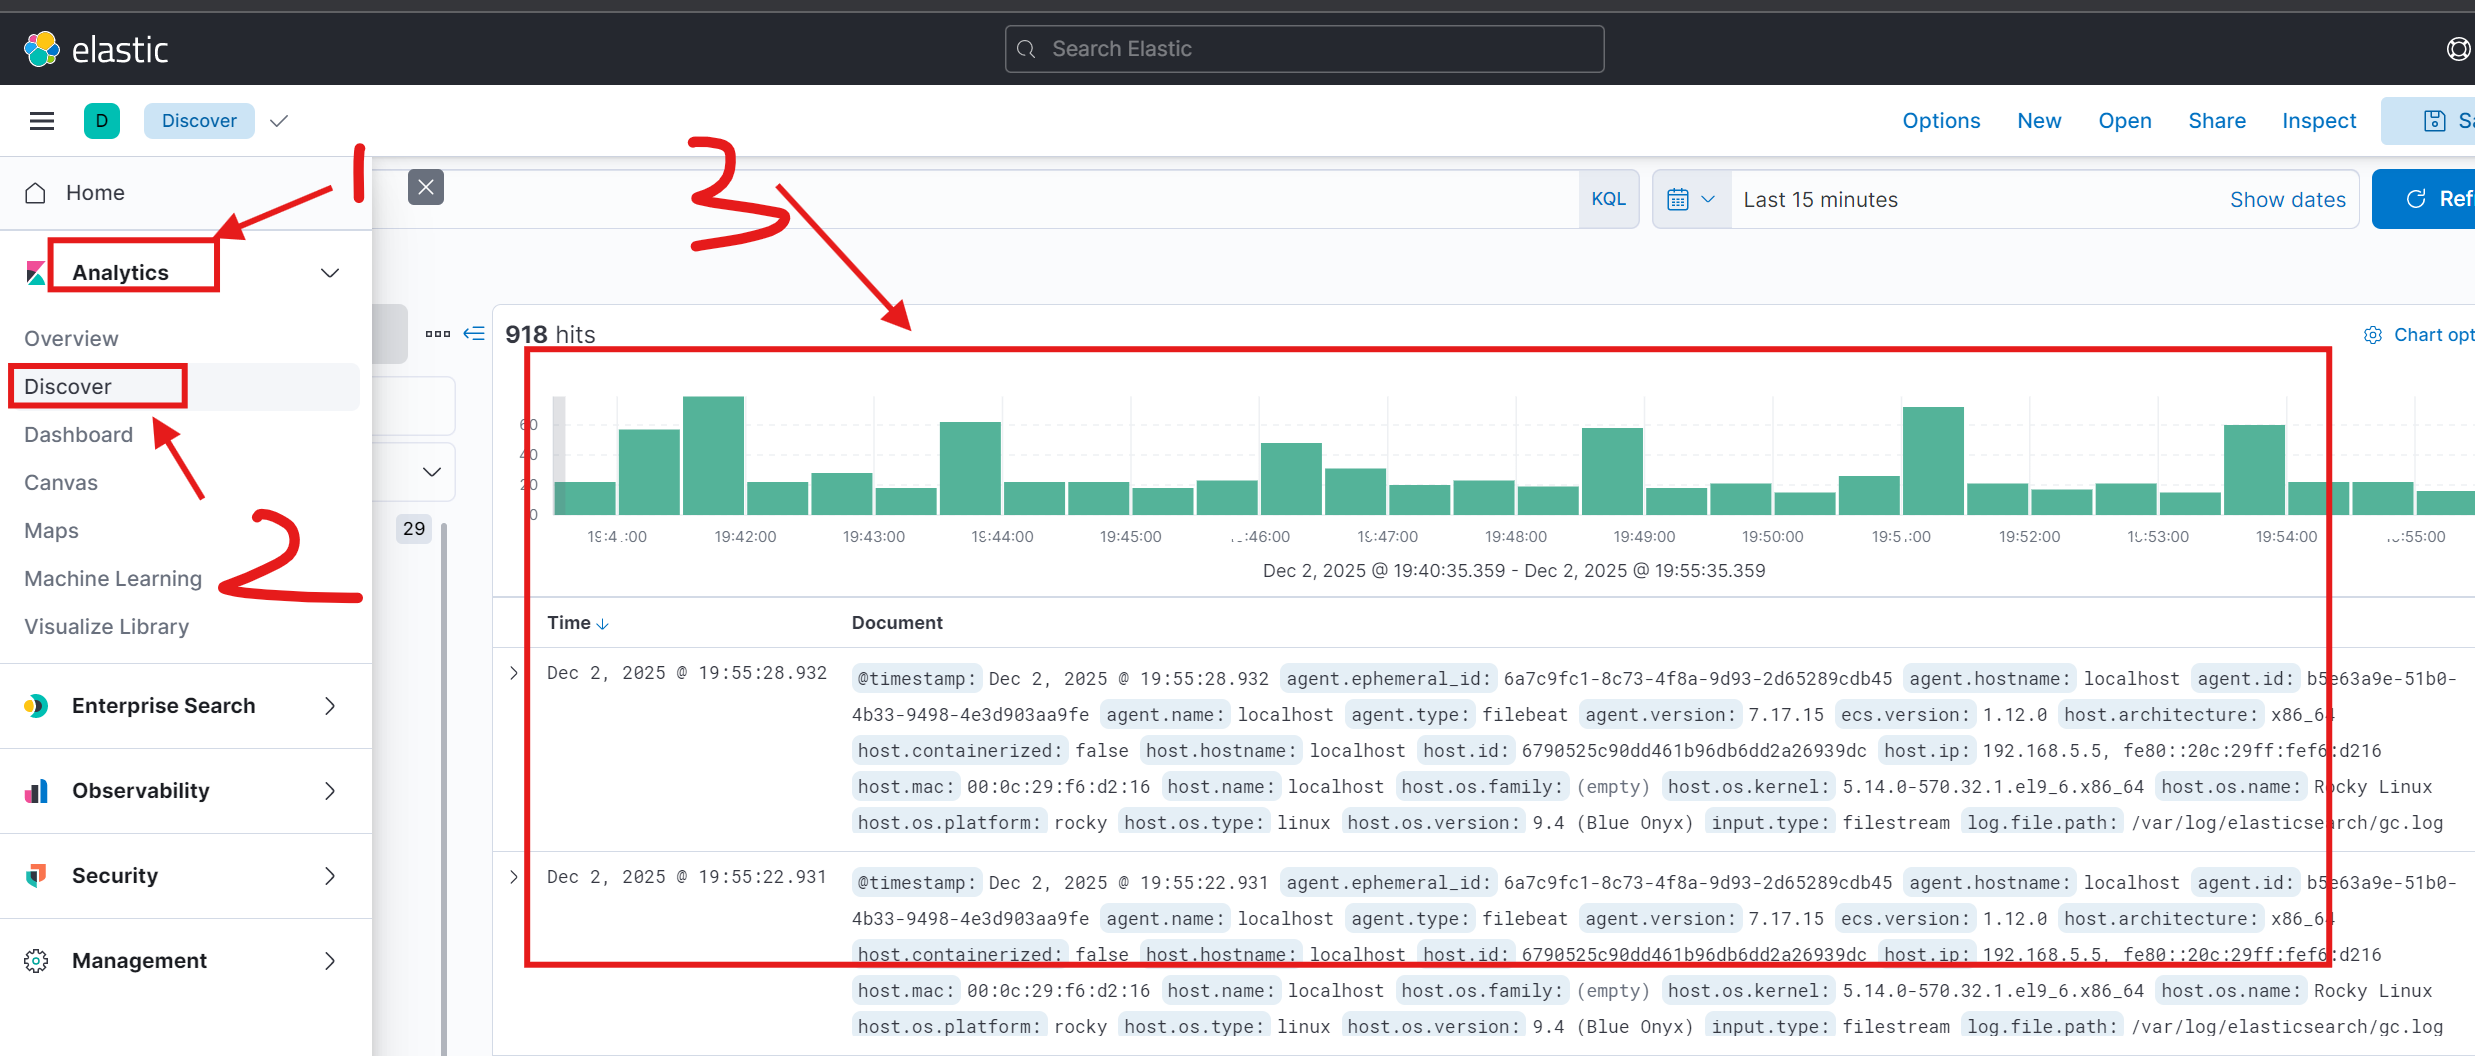
# 查看采集到的日志
[root@localhost filebeat]# tail -f /var/log/messages查看是否采集到数据:
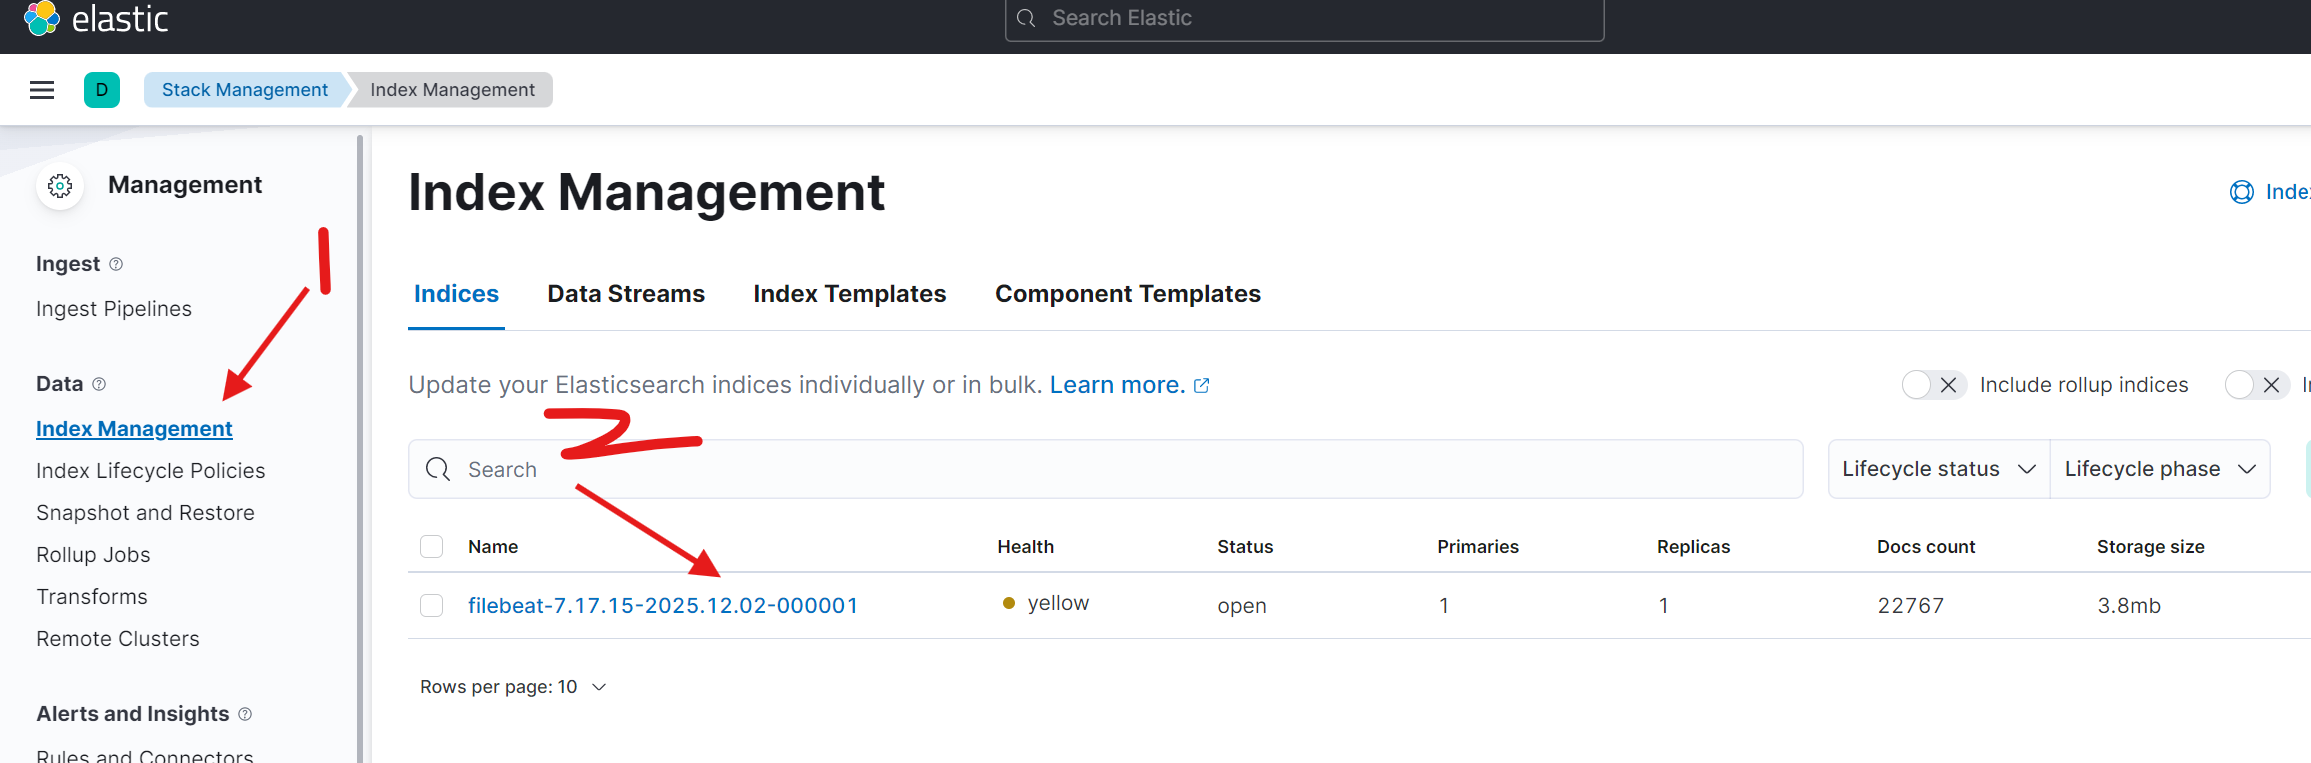
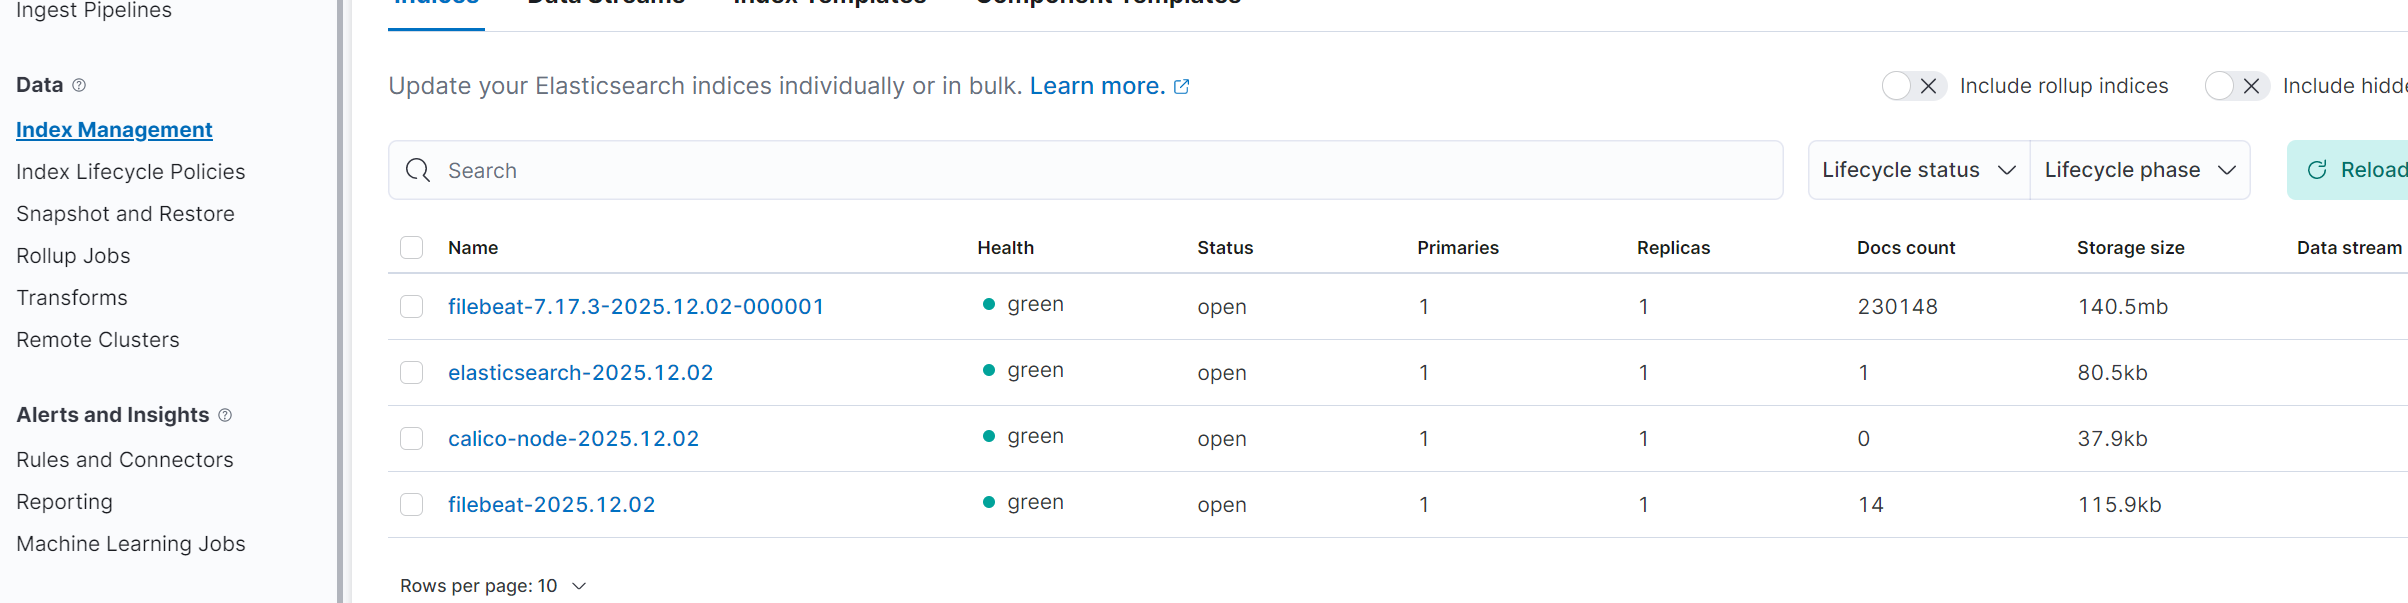
索引名字------filebeat-7.17.15-2025.12.02-000001
若每天创建索引,搜索日志时:
app-name-2025.12.02
app-name-2025.12.03
app-name-2025.12.04
app-name-2025.12.05
注:显示有内容,说明日志采集上来了,只不过因为我们当前只有一个节点,有两个分片(一个主分片和一个副分片),所以显示是yellow
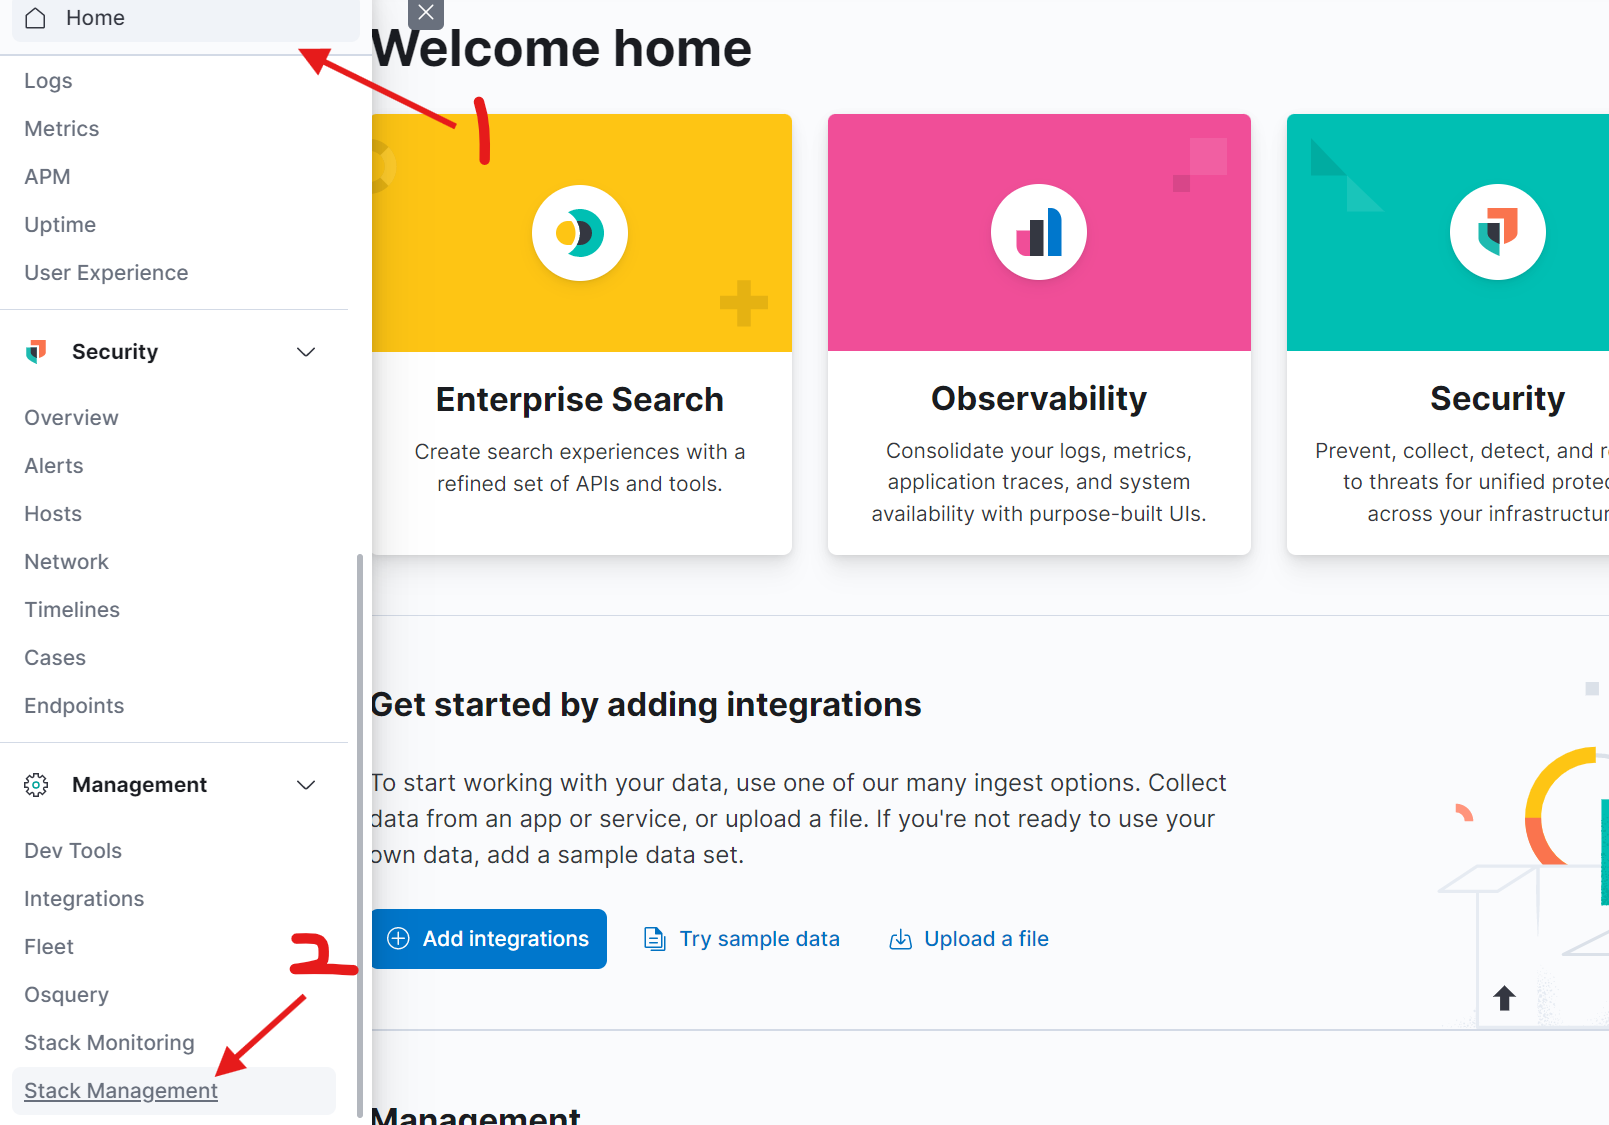
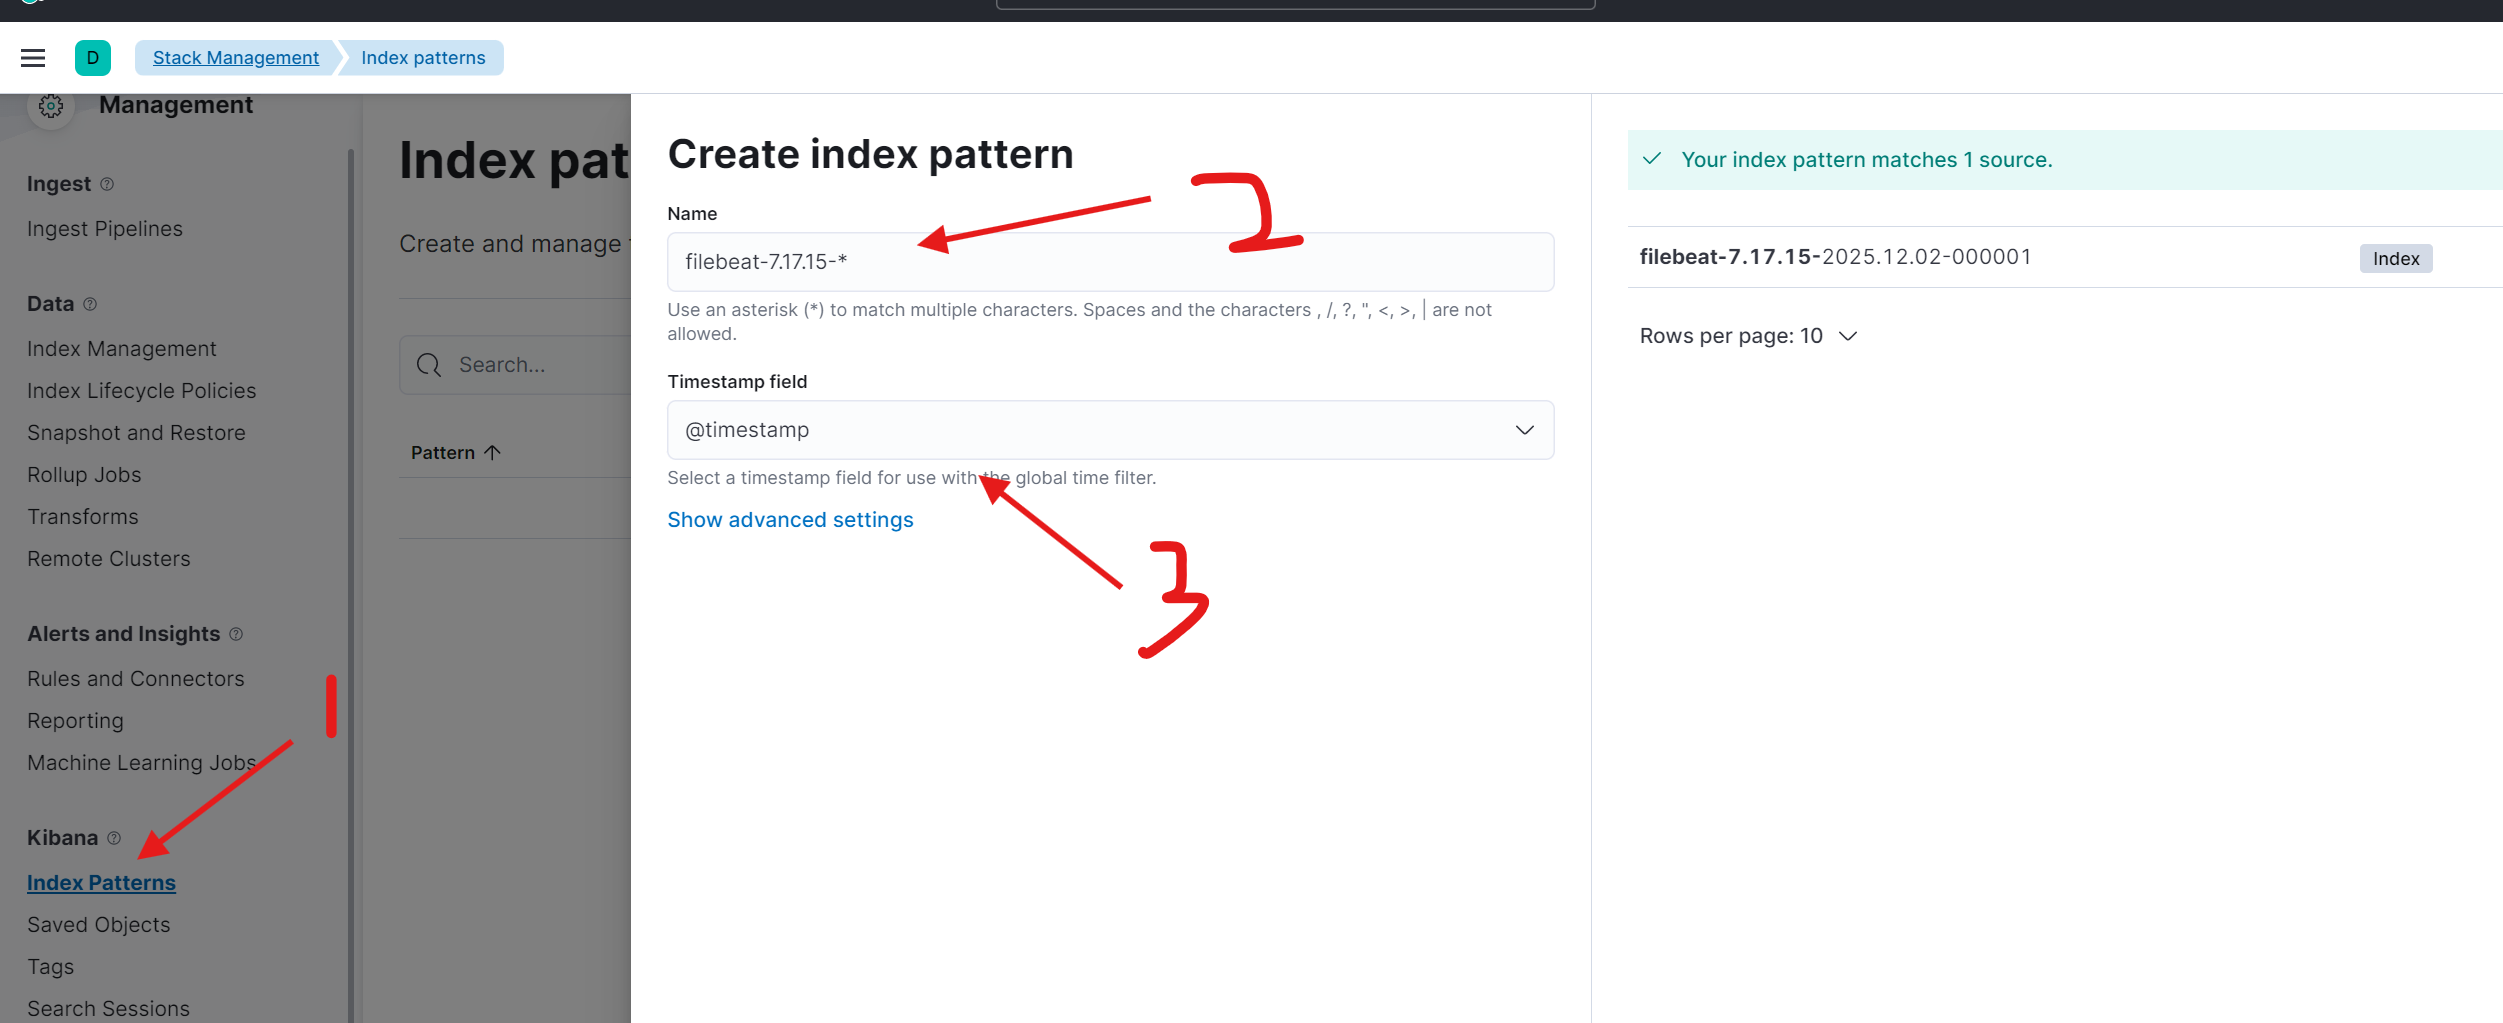
6.创建 index pattern
------匹配 索引
三、日志采集-k8s架构
1.安装 ElasticSearch
# Add the Elastic Helm charts repo
helm repo add elastic https://helm.elastic.co
# 查询版本 我们使用 7.17.3
helm search repo elastic/elasticsearch -l
# 拉取源码包
helm pull elastic/elasticsearch --version=7.17.3
[root@localhost ~]# tar xf elasticsearch-7.17.3.tgz
[root@localhost ~]# cd elasticsearch/
[root@localhost elasticsearch]# vi values.yaml
replicas: 2
resources:
requests:
cpu: "500m"
memory: "1Gi"
limits:
cpu: "500m"
memory: "1Gi"
persistence:
enabled: false
[root@localhost ~]# helm upgrade --install els -n logging ./elasticsearch --create-namespace --namespace logging
# values.yaml中配置了反亲和,所以一个节点只有一个pod
[root@localhost elasticsearch]# kubectl -n logging get pod -o wide
NAME READY STATUS RESTARTS AGE IP NODE NOMINATED NODE READINESS GATES
elasticsearch-master-0 0/1 Running 0 2m34s 172.17.189.74 worker2 <none> <none>
elasticsearch-master-1 0/1 Running 0 2m34s 172.17.171.98 worker <none> <none>
[root@localhost elasticsearch]# curl 172.17.189.74:9200/_cluster/health?pretty
{
"cluster_name" : "elasticsearch",
"status" : "green",
"timed_out" : false,
"number_of_nodes" : 2,
"number_of_data_nodes" : 2,
"active_primary_shards" : 1,
"active_shards" : 2,
"relocating_shards" : 0,
"initializing_shards" : 0,
"unassigned_shards" : 0,
"delayed_unassigned_shards" : 0,
"number_of_pending_tasks" : 0,
"number_of_in_flight_fetch" : 0,
"task_max_waiting_in_queue_millis" : 0,
"active_shards_percent_as_number" : 100.0
}2.安装 Kibana
[root@localhost ~]# helm pull elastic/kibana --version=7.17.3
[root@localhost ~]# tar xf kibana-7.17.3.tgz
[root@localhost ~]# cd kibana/

[root@localhost kibana]# vi values.yaml
resources:
  requests:
    cpu: "500m"
    memory: "1Gi"

service:
  type: NodePort

[root@localhost ~]# helm -n logging upgrade --install  kibana ./kibana
Release "kibana" does not exist. Installing it now.
NAME: kibana
LAST DEPLOYED: Tue Dec  2 21:01:56 2025
NAMESPACE: logging
STATUS: deployed
REVISION: 1
TEST SUITE: None

[root@localhost ~]# kubectl -n logging get svc
NAME                            TYPE        CLUSTER-IP        EXTERNAL-IP   PORT(S)             AGE
elasticsearch-master            ClusterIP   192.168.111.63    <none>        9200/TCP,9300/TCP   18m
elasticsearch-master-headless   ClusterIP   None              <none>        9200/TCP,9300/TCP   18m
kibana-kibana                   NodePort    192.168.111.207   <none>        5601:32051/TCP      7m9s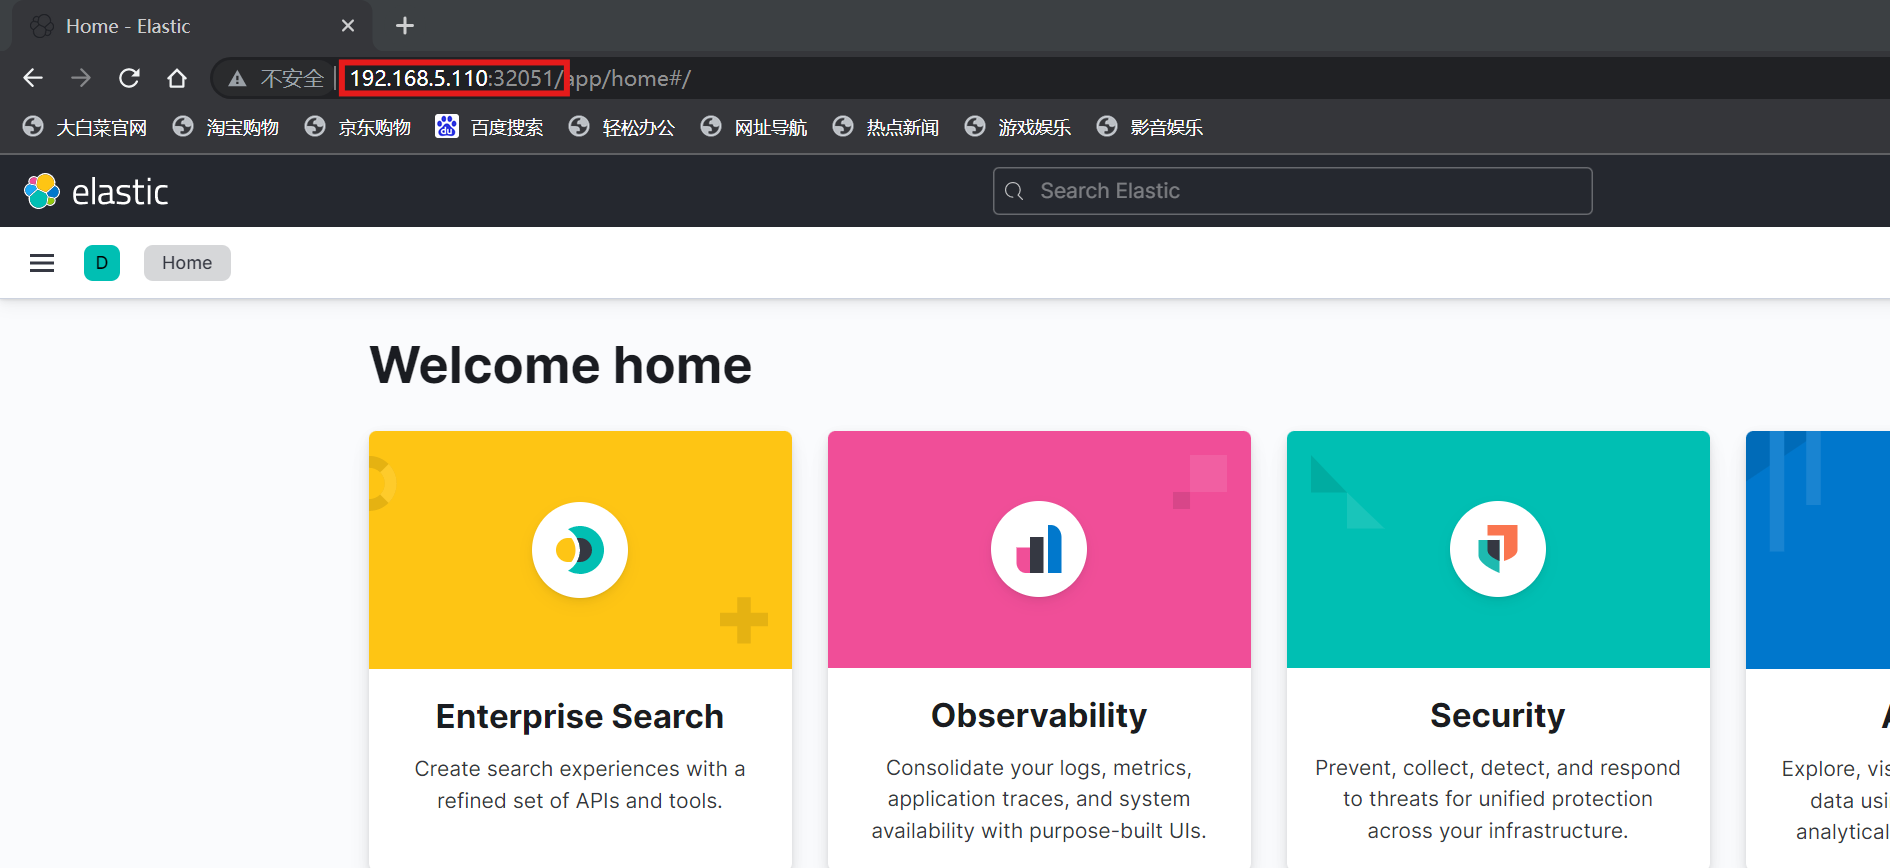
3.安装 Filebeat
[root@localhost ~]# helm pull elastic/filebeat --version=7.17.3
[root@localhost ~]# tar xf filebeat-7.17.3.tgz
[root@localhost ~]# cd filebeat/

[root@localhost filebeat]# vi values.yaml
      filebeat.inputs:
      - type: container
        paths:
          - /var/log/containers/*.log
        processors:
        - add_kubernetes_metadata:
            host: ${NODE_NAME}
            matchers:
            - logs_path:
                logs_path: "/var/log/containers/"

      output.elasticsearch:
        host: '${NODE_NAME}'
        hosts: '${ELASTICSEARCH_HOSTS:elasticsearch-master:9200}'

  resources:
    requests:
      cpu: "200m"
      memory: "200Mi"
    limits:
      cpu: "1000m"
      memory: "2000Mi"

[root@localhost ~]# helm -n logging install filebeat ./filebeat
NAME: filebeat
LAST DEPLOYED: Tue Dec  2 21:08:24 2025
NAMESPACE: logging
STATUS: deployed
REVISION: 1
TEST SUITE: None
NOTES:
1. Watch all containers come up.
  $ kubectl get pods --namespace=logging -l app=filebeat-filebeat -w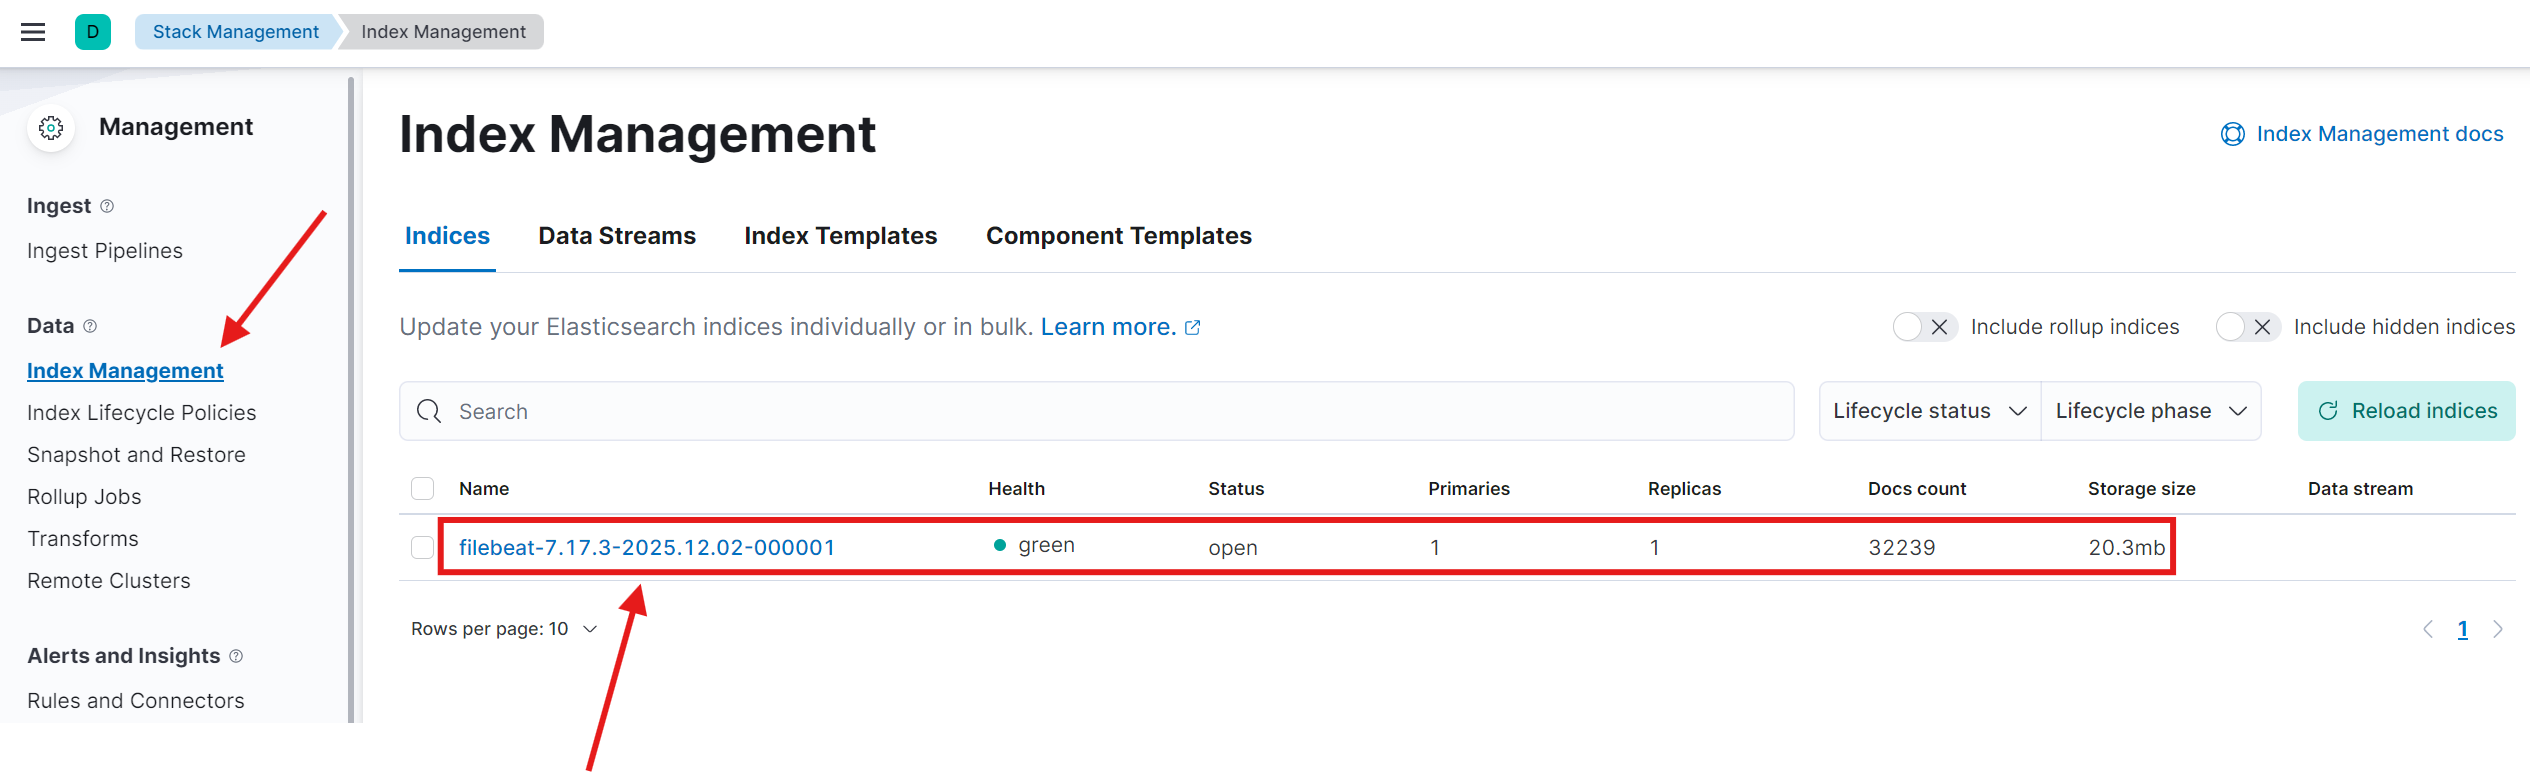
按照之前的步骤,创建 index pattern后查看采集到的日志 :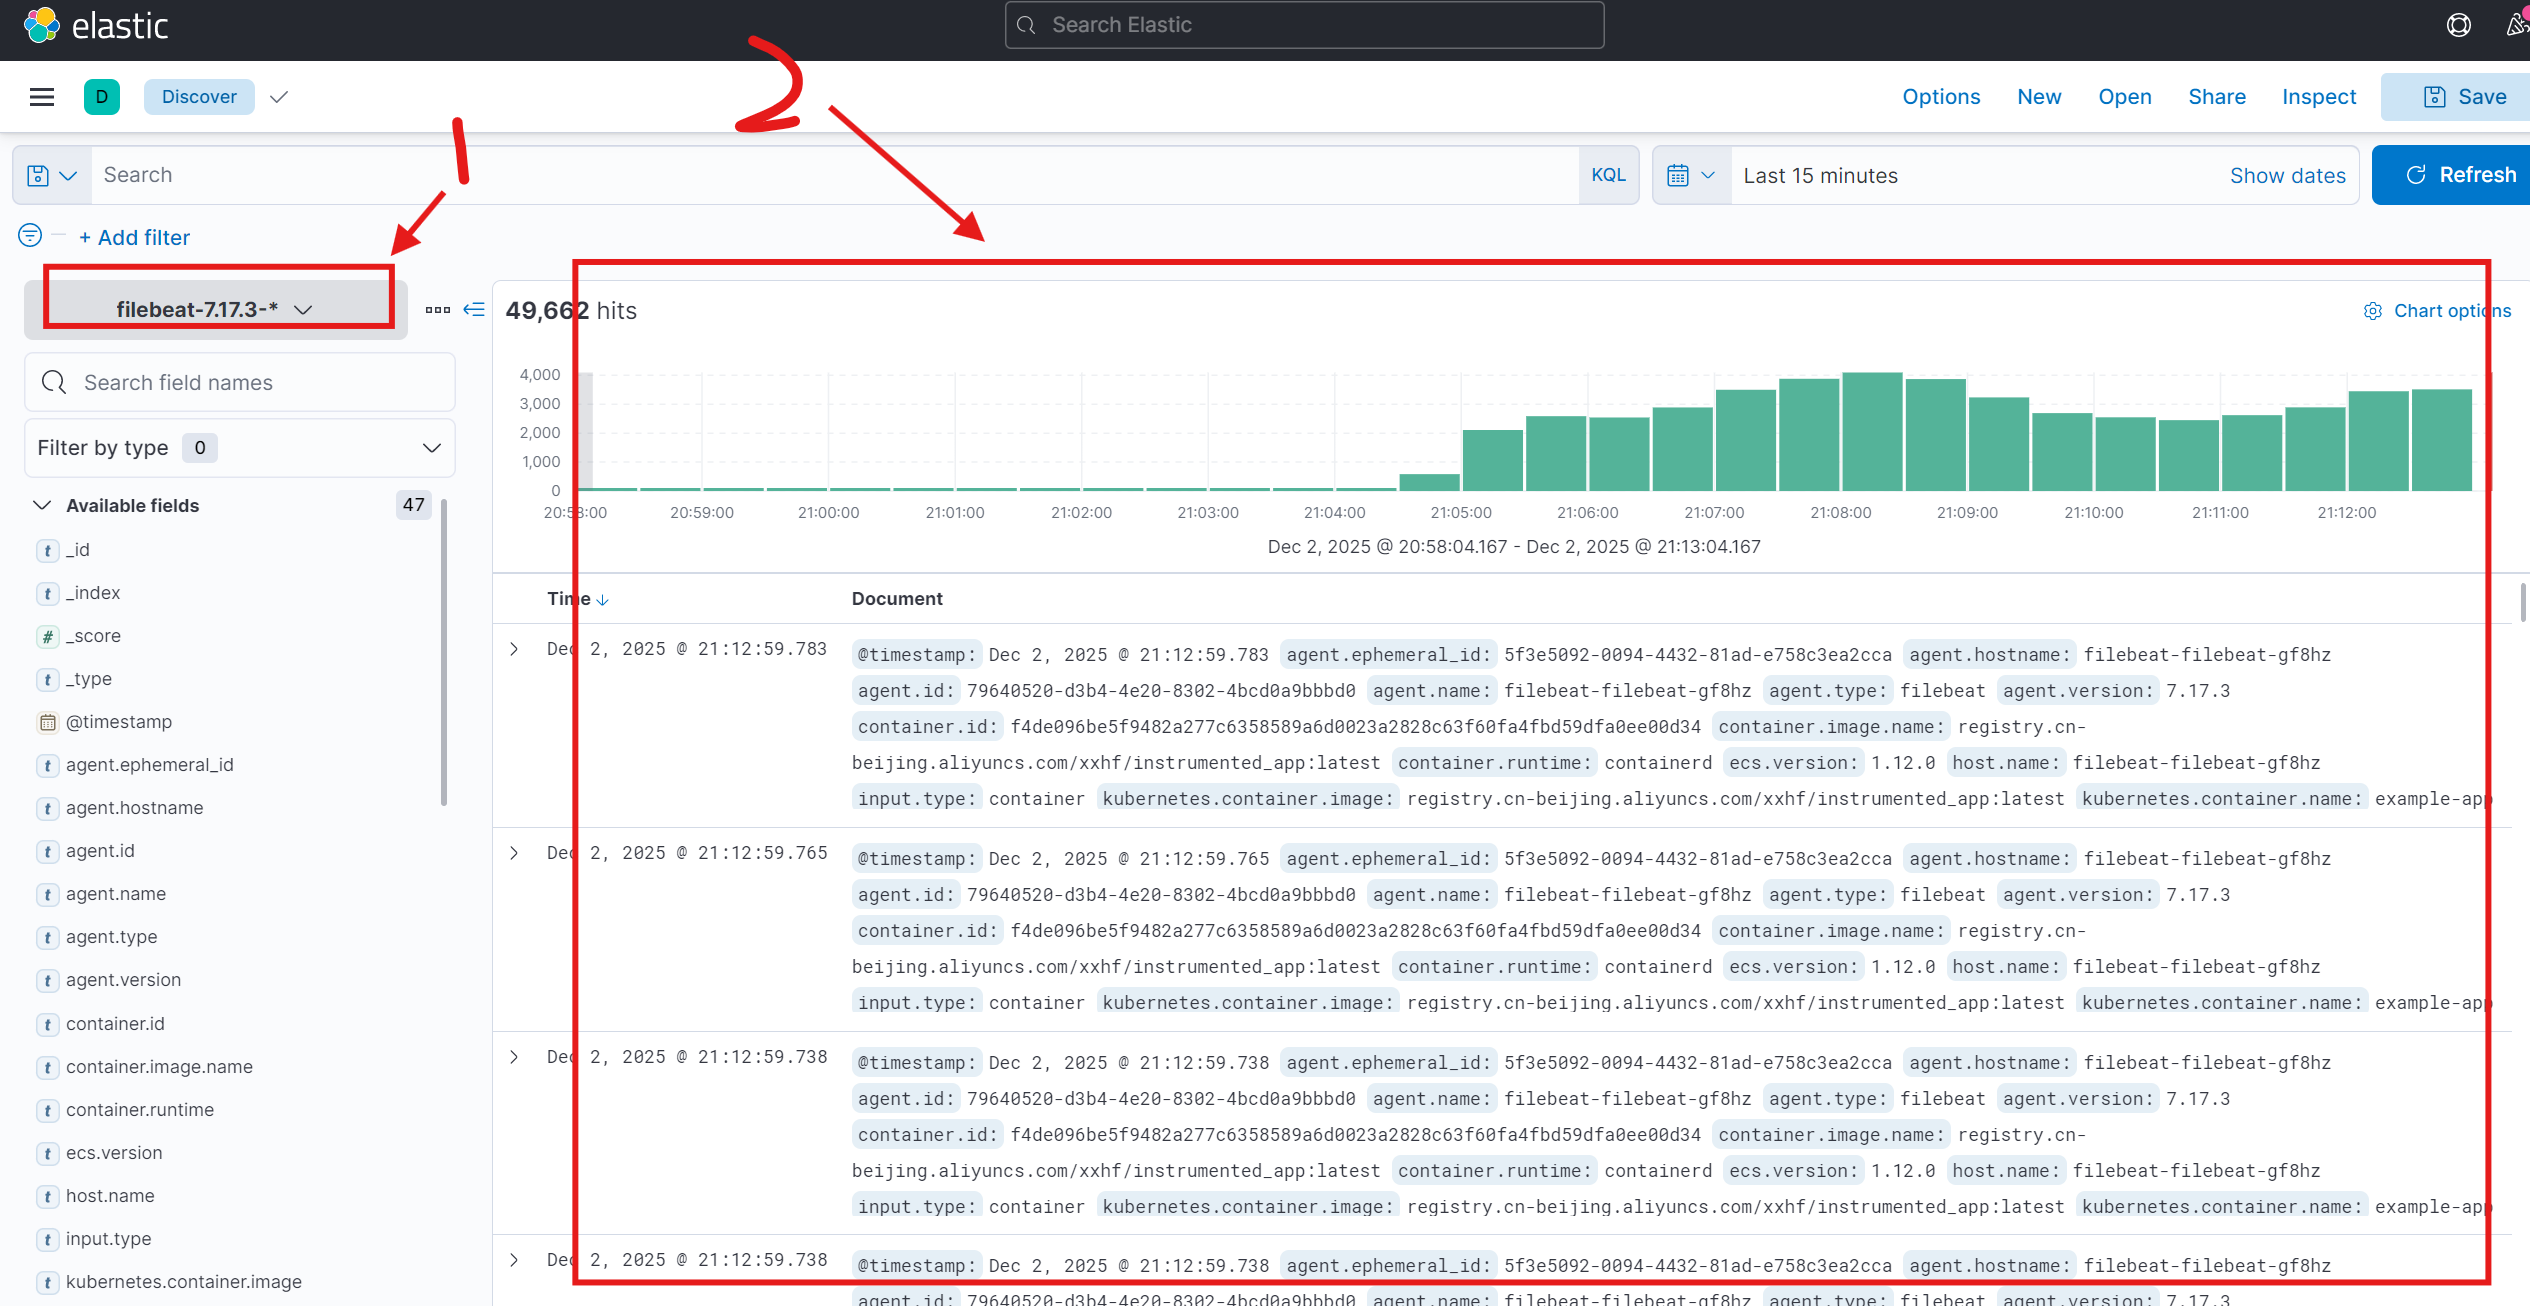
也可以按照应用创建索引:
[root@localhost filebeat]# vi filebeat-values.yaml
daemonset:
  enabled: true
  filebeatConfig:
    filebeat.yml: |
      filebeat.inputs:
      - type: container
        paths:
          - /var/log/containers/*.log
        processors:
        - add_cloud_metadata:
        - add_host_metadata:
        - add_docker_metadata:
        - add_kubernetes_metadata:
            in_cluster: true
            host: ${NODE_NAME}
            matchers:
            - logs_path:
                logs_path: "/var/log/containers/"
        - add_fields:
            fields:
              index_name: "my_logs-%{[kubernetes.pod.name]}"

      setup.template.settings:
      index.number_of_shards: 1
      setup.template.enabled: true
      setup.template.name: "my_template"
      setup.template.pattern: "my_logs-*"
      setup.template.overwrite: true
      setup.ilm.enabled: false
      #output.console:
      #pretty: true
      output.elasticsearch:
        hosts: '${ELASTICSEARCH_HOSTS:elasticsearch-master:9200}'
        index: "%{[kubernetes.container.name]}-%{+yyyy.MM.dd}"

[root@localhost ~]# helm upgrade filebeat -f filebeat/filebeat-values.yaml ./filebeat -n logging
Release "filebeat" has been upgraded. Happy Helming!
NAME: filebeat
LAST DEPLOYED: Tue Dec  2 21:28:12 2025
NAMESPACE: logging
STATUS: deployed
REVISION: 2
TEST SUITE: None
NOTES:
1. Watch all containers come up.
  $ kubectl get pods --namespace=logging -l app=filebeat-filebeat -w