Detect Trends with Compact In-Cell Visuals
Gain clear insight into your spreadsheet data with compact sparklines that reveal trends, highlight key points and simplify meaningful comparisons.
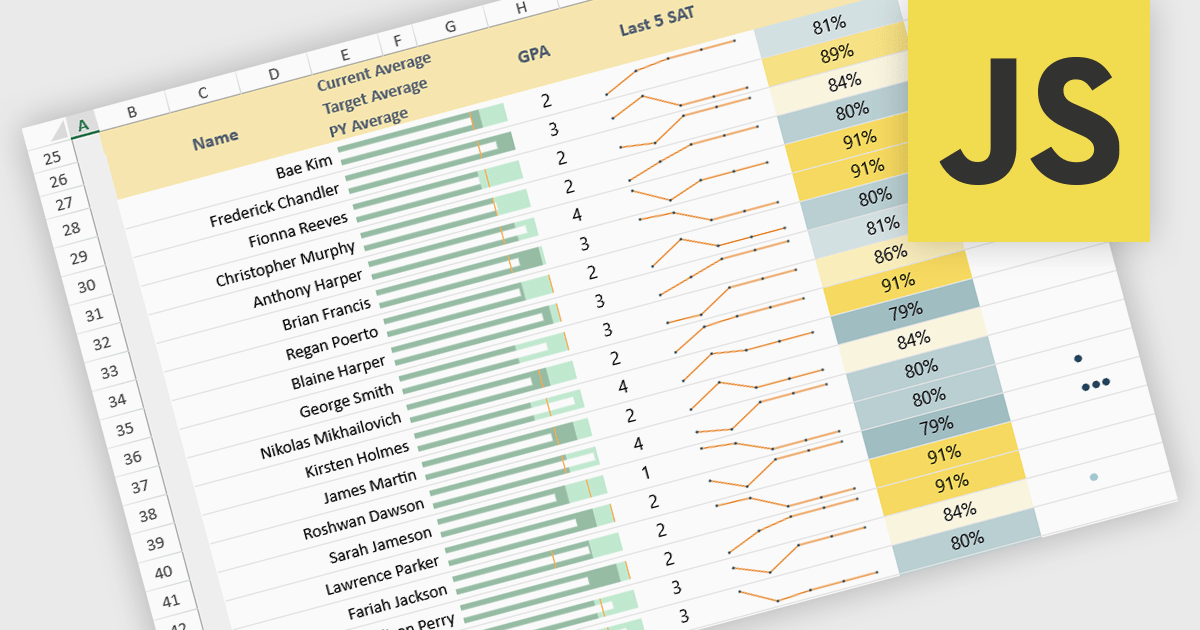
Sparklines in spreadsheets are small, in-cell charts that provide a concise visual summary of data trends without the need for full-sized graphs. They help users quickly identify patterns such as growth, decline, and volatility, making complex information easier to understand at a glance. Because sparklines update automatically with underlying data, they improve real-time analysis and are ideal for dashboards, performance tracking, and financial reporting. Common use cases include monitoring monthly sales performance, comparing product trends side by side, spotting anomalies in operational metrics, and enhancing executive summaries with clear, space-efficient visual context.