分布式消息队列kafka【五】------ kafka海量日志收集实战
文章目录
- [分布式消息队列kafka【五】------ kafka海量日志收集实战](#分布式消息队列kafka【五】—— kafka海量日志收集实战)
kafka海量日志收集实战
架构设计(一)_ELK技术栈架构图
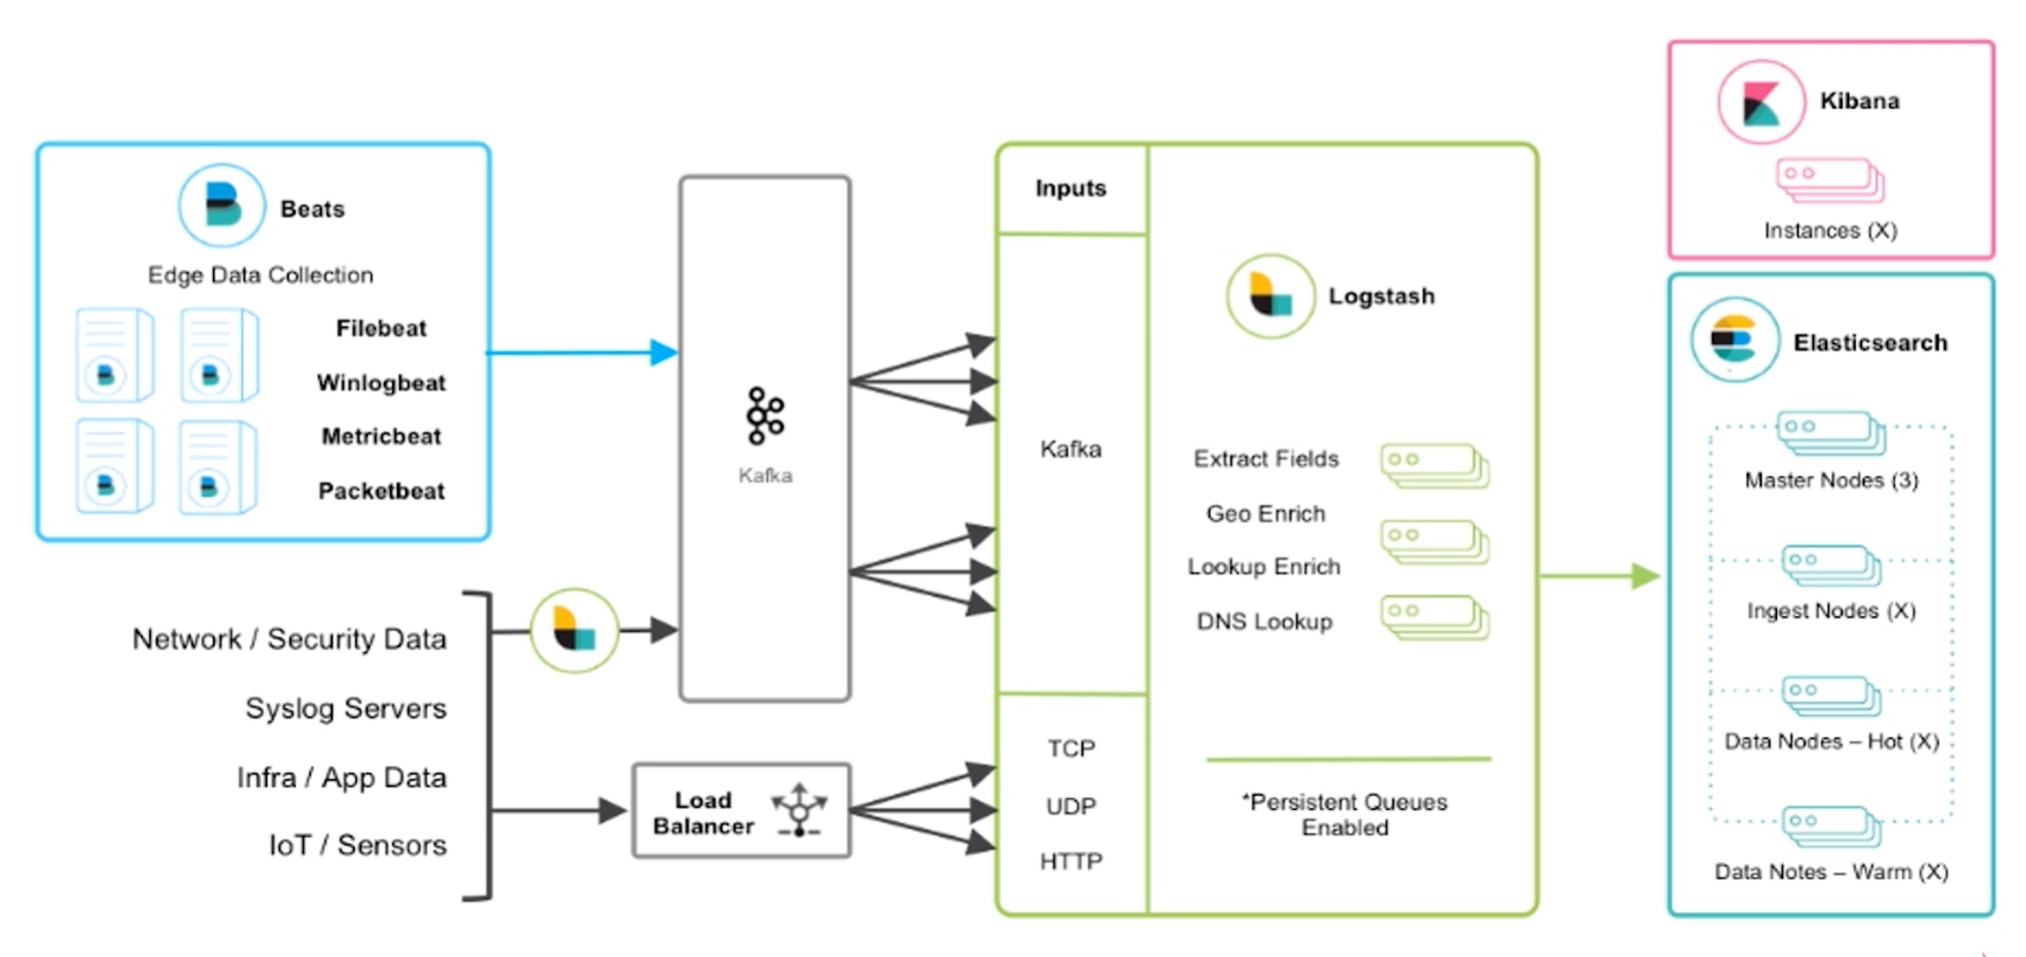
Beats主要用于收集日志 ,比如Fliebeat底层时使用golang语言实现,我们服务中打印的日志都可以通过Fliebeat抓取 出来,直接转储到kafka ,然后通过logstash对日志进行过滤 。最后logstash将过滤后的数据存储到elasticsearch ,通过kibana展示。
Beats也可以通过log4j的一些插件与logstash集成直接实现日志的采集和过滤,也可以通过log4j提供的kafka的appender直接把日志数据采集到kafka中,也可以使用apache开源的一些组件也可以实现日志收集,等等,这些方式都是可以实现的。但是上述海量日志收集架构才是真正能够承载海量数据收集的架构,也是官方推荐和业界最通用的。
为啥要使用kafka中间件,为什么不直接将Fliebeat采集到的日志输入到logstash上?
因为我们的架构是海量日志收集,可能有些业务高峰期,kafka起到中间的缓冲作用 ,用来缓解elasticsearch的压力 。当然可以对elasticsearch进行横向扩容,但是这肯定会增加成本。主要kafka有着很高的消息堆积能力。
架构设计(二)_ELK实战流程图
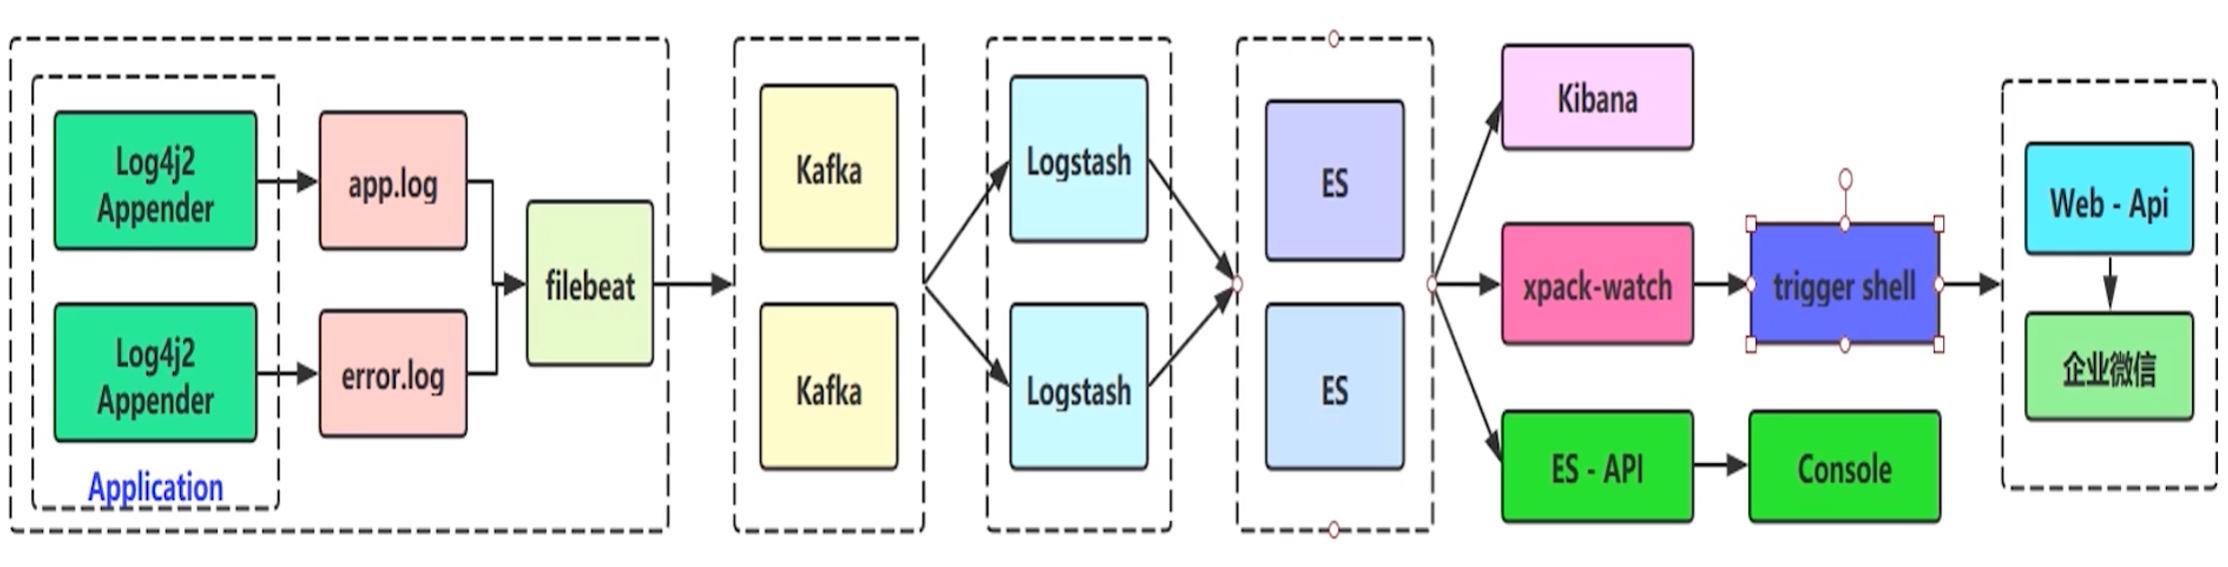
为啥选用log4j2,不选用springboot默认的官方logback?
因为log4j2性能会更好 ,底层是基于LMAX Disruptor library的异步logger,在多线程场景下,拥有18倍于log4j和logback的性能。
为啥分成两个日志文件,分别为app.log(全量日志文件,日志级别在info及优先级以上的日志)和error.log(错误日志文件,日志级别warn及优先级以上的日志)?
为了后续做日志的告警和分析,直接选择error.log的日志,因为app.log的日志量级太大,对error.log的日志做一些定时任务的日志分析和告警性能会更高,告警实时性就更强。
在es之后,可以通过xpack-watch的trigger shell插件作错误日志上报和告警的功能 ,可以把告警的信息通过http等方式上报到我们自己的应用程序web api,还可以通过自己的应用程序通知企业微信。
log4j2介绍
log4j2:是apache在log4j的基础上,参考logback架构实现的一套新的日志系统。
log4j2的官方文档上写着一些它的优点:
- 在拥有全部logback特性的情况下,还修复了一些隐藏问题
- API 分离:现在log4j2也是门面模式使用日志,默认的日志实现是log4j2,当然你也可以用logback(应该没有人会这么做)
- 性能提升:log4j2包含下一代基于LMAX Disruptor library的异步logger,在多线程场景下,拥有18倍于log4j和logback的性能
- 多API支持:log4j2提供Log4j 1.2, SLF4J, Commons Logging and java.util.logging (JUL) 的API支持
- 避免锁定:使用Log4j2 API的应用程序始终可以选择使用任何符合SLF4J的库作为log4j-to-slf4j适配器的记录器实现
- 自动重新加载配置:与Logback一样,Log4j 2可以在修改时自动重新加载其配置。与Logback不同,它会在重新配置发生时不会丢失日志事件。
- 高级过滤: 与Logback一样,Log4j 2支持基于Log事件中的上下文数据,标记,正则表达式和其他组件进行过滤。
- 插件架构: Log4j使用插件模式配置组件。因此,您无需编写代码来创建和配置Appender,Layout,Pattern Converter等。Log4j自动识别插件并在配置引用它们时使用它们。
- 属性支持:您可以在配置中引用属性,Log4j将直接替换它们,或者Log4j将它们传递给将动态解析它们的底层组件。
- Java 8 Lambda支持
- 自定义日志级别
- 产生垃圾少:在稳态日志记录期间,Log4j 2 在独立应用程序中是无垃圾的,在Web应用程序中是低垃圾。这减少了垃圾收集器的压力,并且可以提供更好的响应时间性能。
- 和应用server集成:版本2.10.0引入了一个模块log4j-appserver,以改进与Apache Tomcat和Eclipse Jetty的集成。
存在的问题:在本身服务器配置不太好,使用log4j2作日志收集会占用很多的日志资源,原因就是因为底层的Disruptor框架,是非常消耗性能的。
log4j2日志输出
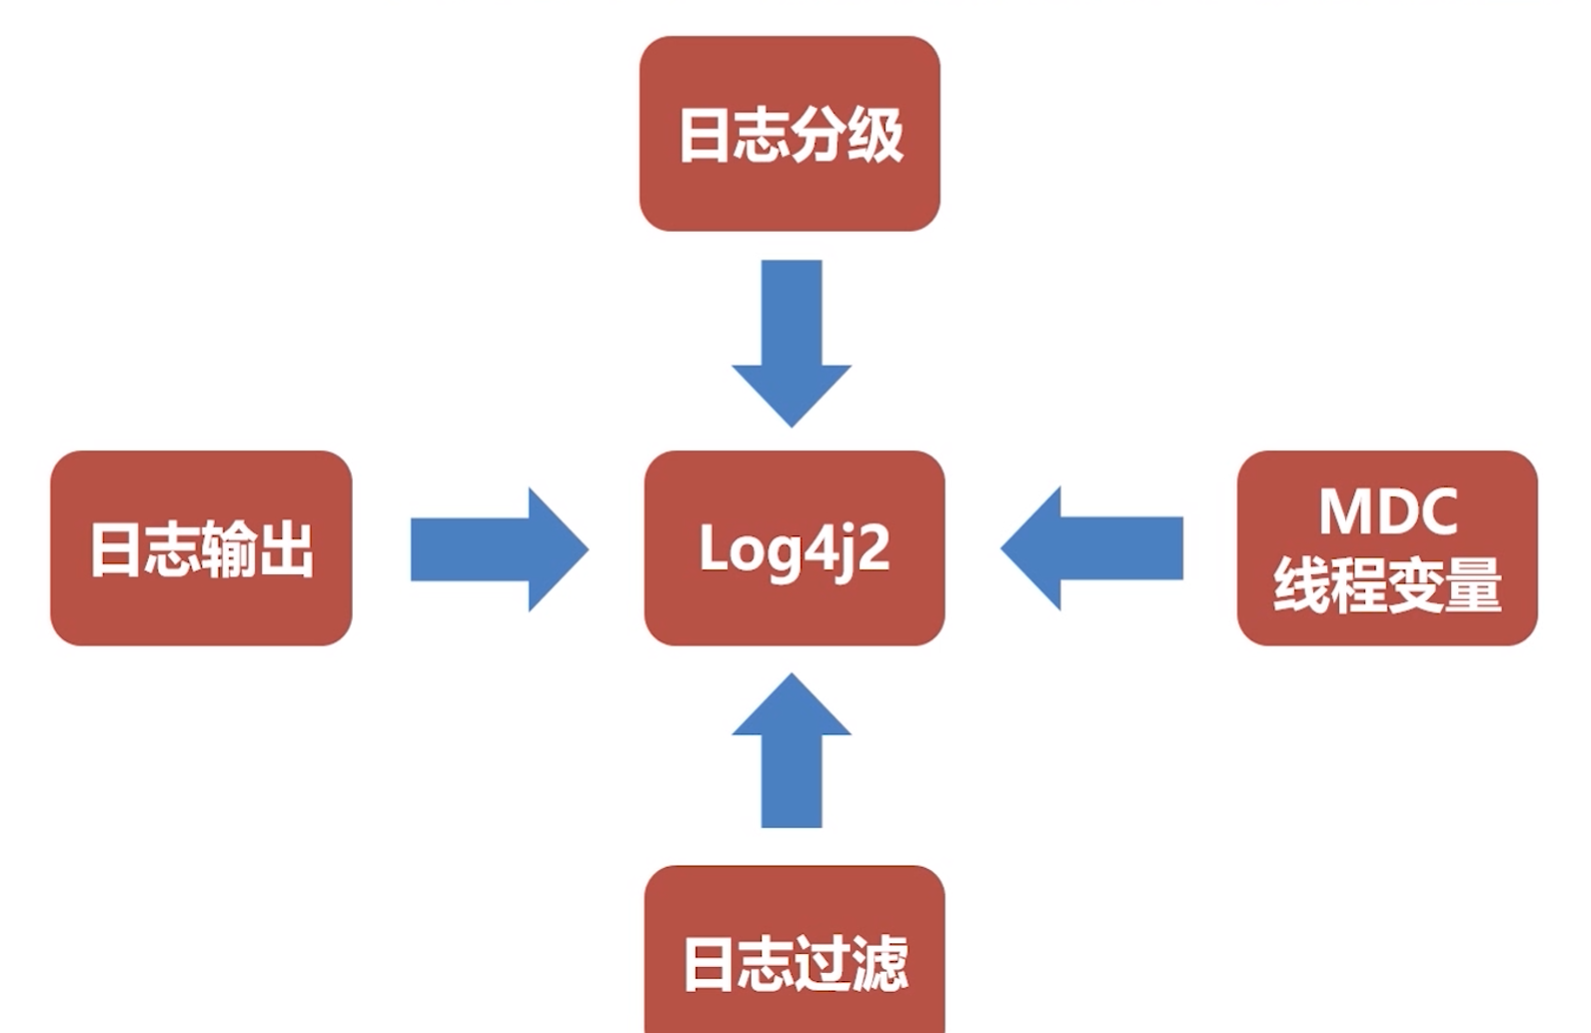
日志输出:可以通过log4j2.xml实现自定义的日志输出格式
日志分级:比如info、warn、error级别的日志分别输出到哪里,但是需要注意,实际工作中,特别细的日志分级也是没有意义的
日志过滤:只收集需要的日志
MDC线程变量:这个其实是slf4j框架的核心功能,MDC是指在日志里的一个ThreadLocal变量,如果我们有一些特殊的变量想要输出到日志里,可以直接put到MDC中,可能看成一个一旦执行收集动作就不可变的map对象。当然,在执行收集动作之前可以put放很多内容
filebeat日志收集
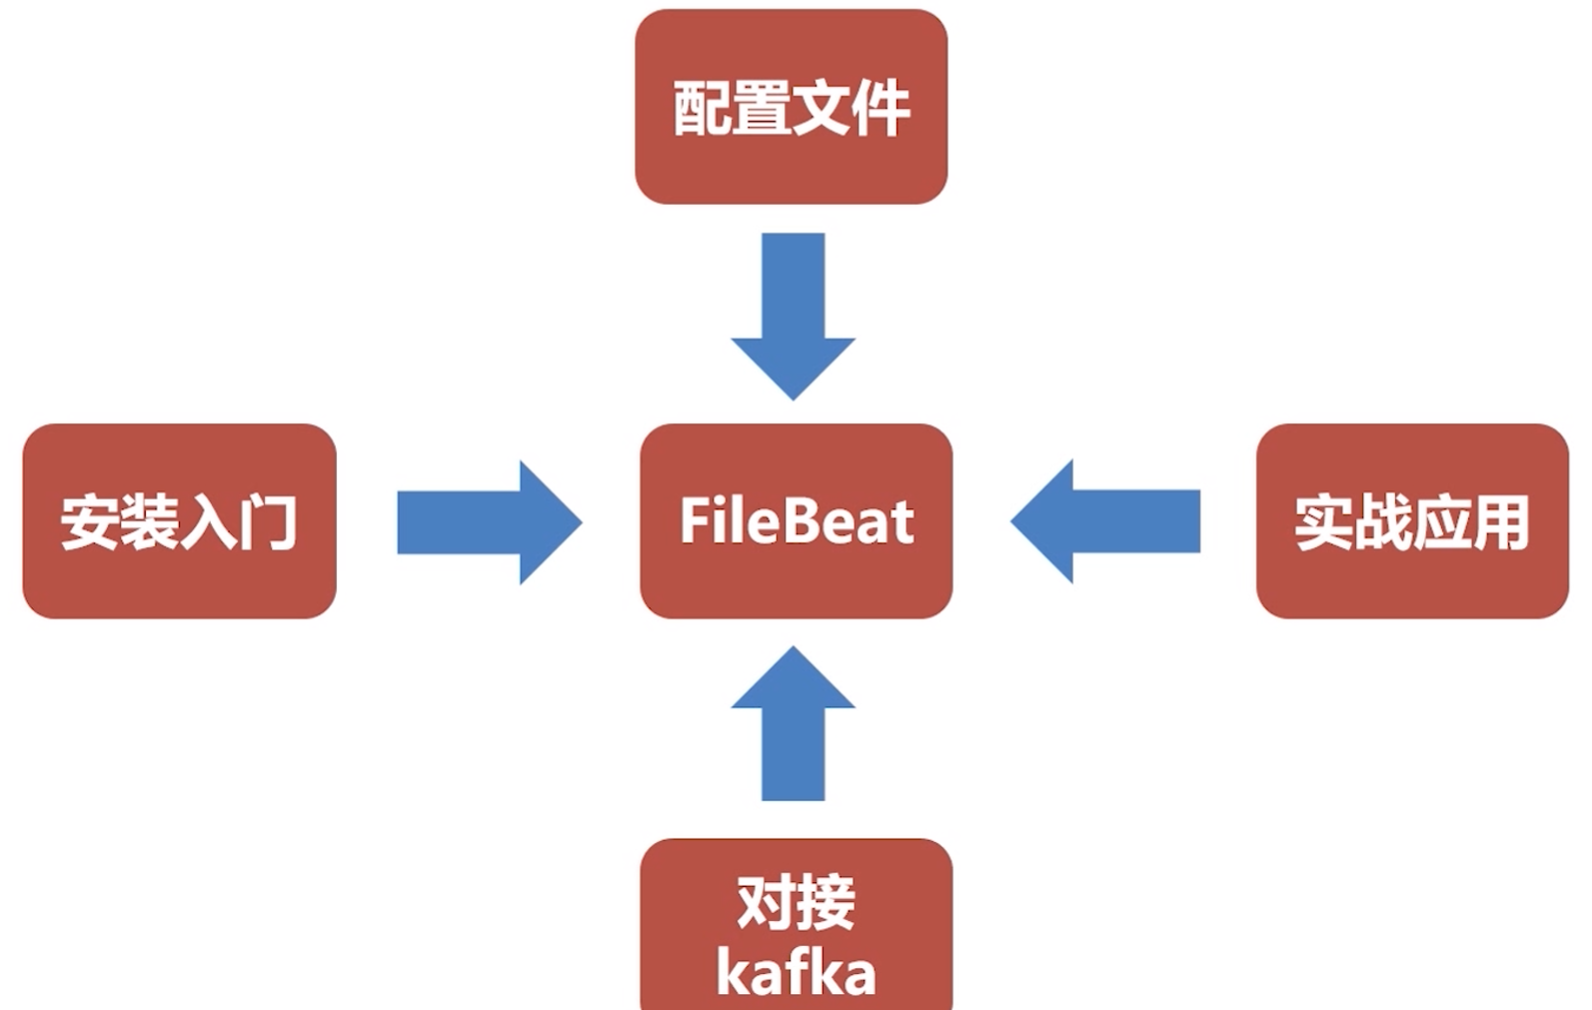
一、filebeat是什么
1.1、filebeat和beats的关系
首先filebeat是Beats中的一员。
Beats在是一个轻量级日志采集器,其实Beats家族有6个成员,早期的ELK架构中使用Logstash收集、解析日志,但是Logstash对内存、cpu、io等资源消耗比较高。相比Logstash,Beats所占系统的CPU和内存几乎可以忽略不计。
目前Beats包含六种工具:
Packetbeat:网络数据(收集网络流量数据)
Metricbeat:指标(收集系统、进程和文件系统级别的CPU和内存使用情况等数据)
Filebeat:日志文件(收集文件数据)
Winlogbeat:windows事件日志(收集Windows事件日志数据)
Auditbeat:审计数据(收集审计日志)
Heartbeat:运行时间监控(收集系统运行时的数据)
1.2、filebeat是什么
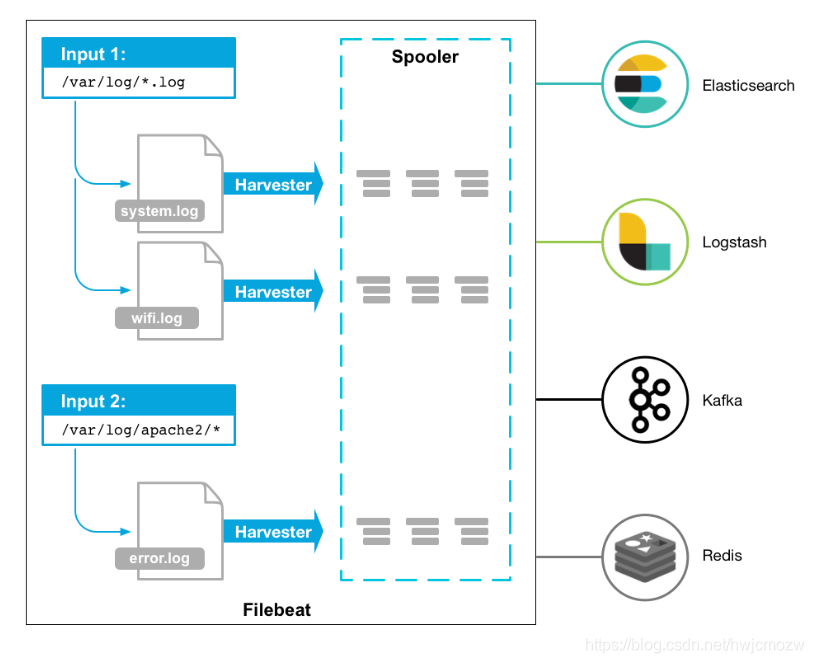
Filebeat是用于转发和集中日志数据的轻量级传送工具。Filebeat监视您指定的日志文件或位置,收集日志事件,并将它们转发到Elasticsearch或 Logstash进行索引。
Filebeat的工作方式如下:启动Filebeat时,它将启动一个或多个输入,这些输入将在为日志数据指定的位置中查找。对于Filebeat所找到的每个日志,Filebeat都会启动收集器。每个收集器都读取单个日志以获取新内容,并将新日志数据发送到libbeat,libbeat将聚集事件,并将聚集的数据发送到为Filebeat配置的输出。
工作的流程图如下:
1.3、filebeat和logstash的关系
因为logstash是jvm跑的,资源消耗比较大,所以后来作者又用golang写了一个功能较少但是资源消耗也小的轻量级的logstash-forwarder。不过作者只是一个人,加入http://elastic.co公司以后,因为es公司本身还收购了另一个开源项目packetbeat,而这个项目专门就是用golang的,有整个团队,所以es公司干脆把logstash-forwarder的开发工作也合并到同一个golang团队来搞,于是新的项目就叫filebeat了。
二、filebeat原理是什么
2.1、filebeat的构成
filebeat结构:由两个组件构成,分别是inputs(输入)和harvesters(收集器),这些组件一起工作来跟踪文件并将事件数据发送到您指定的输出,harvester负责读取单个文件的内容。harvester逐行读取每个文件,并将内容发送到输出。为每个文件启动一个harvester。harvester负责打开和关闭文件,这意味着文件描述符在harvester运行时保持打开状态。如果在收集文件时删除或重命名文件,Filebeat将继续读取该文件。这样做的副作用是,磁盘上的空间一直保留到harvester关闭。默认情况下,Filebeat保持文件打开,直到达到close_inactive
关闭harvester可以会产生的结果:
- 文件处理程序关闭,如果harvester仍在读取文件时被删除,则释放底层资源。
- 只有在scan_frequency结束之后,才会再次启动文件的收集。
- 如果该文件在harvester关闭时被移动或删除,该文件的收集将不会继续
一个input负责管理harvesters和寻找所有来源读取。如果input类型是log,则input将查找驱动器上与定义的路径匹配的所有文件,并为每个文件启动一个harvester。每个input在它自己的Go进程中运行,Filebeat当前支持多种输入类型。每个输入类型可以定义多次。日志输入检查每个文件,以查看是否需要启动harvester、是否已经在运行harvester或是否可以忽略该文件
2.2、filebeat如何保存文件的状态
Filebeat保留每个文件的状态,并经常将状态刷新到磁盘中的注册表文件中。该状态用于记住harvester读取的最后一个偏移量,并确保发送所有日志行。如果无法访问输出(如Elasticsearch或Logstash),Filebeat将跟踪最后发送的行,并在输出再次可用时继续读取文件。当Filebeat运行时,每个输入的状态信息也保存在内存中。当Filebeat重新启动时,来自注册表文件的数据用于重建状态,Filebeat在最后一个已知位置继续每个harvester。对于每个输入,Filebeat都会保留它找到的每个文件的状态。由于文件可以重命名或移动,文件名和路径不足以标识文件。对于每个文件,Filebeat存储唯一的标识符,以检测文件是否以前被捕获。
2.3、filebeat何如保证至少一次数据消费
Filebeat保证事件将至少传递到配置的输出一次,并且不会丢失数据。是因为它将每个事件的传递状态存储在注册表文件中。在已定义的输出被阻止且未确认所有事件的情况下,Filebeat将继续尝试发送事件,直到输出确认已接收到事件为止。如果Filebeat在发送事件的过程中关闭,它不会等待输出确认所有事件后再关闭。当Filebeat重新启动时,将再次将Filebeat关闭前未确认的所有事件发送到输出。这样可以确保每个事件至少发送一次,但最终可能会有重复的事件发送到输出。通过设置shutdown_timeout选项,可以将Filebeat配置为在关机前等待特定时间
三、filebeat怎么安装
shell
## 下载对应版本
curl -L -O https://artifacts.elastic.co/downloads/beats/filebeat/filebeat-6.6.0-linux-x86_64.tar.gz

## 解压到/usr/local/目录下
tar -zxvf filebeat-6.6.0-linux-x86_64.tar.gz -C /usr/local/

## 重命名
mv filebeat-6.6.0-linux-x86_64 filebeat-6.6.0

## 修改filebeat.yml文件如下
###################### Filebeat Configuration Example #########################
filebeat.prospectors:

## 输入项配置,标识作用,建议见名知义
- input_type: log
  ## 抓取的日志文件路径
  paths:
    ## app-服务名称.log, 为什么写死,防止发生轮转抓取历史数据
    - /usr/local/logs/app-collector.log  		# 抓取全量日志文件
  ## 定义写入 ES 时的 _type 值
  document_type: "app-log"
  ## 如何抓取日志文件里的数据,根据日志输出的格式
  multiline:
    #pattern: '^\s*(\d{4}|\d{2})\-(\d{2}|[a-zA-Z]{3})\-(\d{2}|\d{4})'   # 指定匹配的表达式(匹配以 2017-11-15 08:04:23:889 时间格式开头的字符串)
    pattern: '^\['                              # 指定匹配的表达式(匹配以 "[ 开头的字符串,以"[ 开头认为是一条日志)
    negate: true                                # 是否匹配到
    match: after                                # 合并到上一行的末尾,不以"[ 开头新行数据合并到上一行的末尾,认为是一条日志
    max_lines: 2000                             # 最大合并的行数
    timeout: 2s                                 # 如果在规定时间没有新的日志事件就不等待后面的日志
  ## 自定义的key
  fields:
    logbiz: collector
    logtopic: app-log-collector   ## 按服务划分用作kafka topic
    evn: dev

- input_type: log

  paths:
    - /usr/local/logs/error-collector.log  		# 抓取错误日志文件
  document_type: "error-log"
  multiline:
    #pattern: '^\s*(\d{4}|\d{2})\-(\d{2}|[a-zA-Z]{3})\-(\d{2}|\d{4})'   # 指定匹配的表达式(匹配以 2017-11-15 08:04:23:889 时间格式开头的字符串)
    pattern: '^\['                              # 指定匹配的表达式(匹配以 "{ 开头的字符串)
    negate: true                                # 是否匹配到
    match: after                                # 合并到上一行的末尾
    max_lines: 2000                             # 最大的行数
    timeout: 2s                                 # 如果在规定时间没有新的日志事件就不等待后面的日志
  fields:
    logbiz: collector
    logtopic: error-log-collector   ## 按服务划分用作kafka topic
    evn: dev

## 抓取的数据输出到kafka中,可以直接保存到es中
output.kafka:
  enabled: true
  ## kafka服务地址
  hosts: ["192.168.218.21:9092"]
  ## topic
  topic: '%{[fields.logtopic]}'
  ## 分区规则
  partition.hash:
    reachable_only: true
  ## gzip方式消息压缩
  compression: gzip
  ## 单条消息最大字节数
  max_message_bytes: 1000000
  ## acks=1:生产者发送消息之后只需要leader副本成功写入消息之后就能够收到来自服务端的成功响应
  required_acks: 1
logging.to_files: true

## 检查配置是否正确
./filebeat -c filebeat.yml -configtest ## Config OK代表配置正确

## 启动kafka创建对应的topic
nohup /usr/local/kafka_2.12/bin/kafka-server-start.sh /usr/local/kafka_2.12/config/server.properties &

## 查看topic列表命令
./kafka-topics.sh --zookeeper 192.168.218.21:2181 --list

## 创建topic
./kafka-topics.sh --zookeeper 192.168.218.21:2181 --create --topic app-log-collector --partitions 1 --replication-factor 1
./kafka-topics.sh --zookeeper 192.168.218.21:2181 --create --topic error-log-collector --partitions 1 --replication-factor 1

## 启动filebeat
nohup /usr/local/filebeat-6.6.0/filebeat &

## 查看filebeat进程
ps -ef|grep filebeat
logstash日志过滤
logstash安装
shell
## 解压
tar -zxvf logstash-6.6.0.tar.gz -C /usr/local/

## 创建script目录并将logstash-script.conf文件复制到该目录下
mkdir /usr/local/logstash-6.6.0/script/
mv logstash-script.conf /usr/local/logstash-6.6.0/script/

## conf下配置文件说明
# logstash配置文件:/config/logstash.yml
# JVM参数文件:/config/jvm.options
# 日志格式配置文件:/config/log4j2.properties
# 制作Linux服务参数:/config/startup.options

vim /usr/local/logstash-6.6.0/config/logstash.yml
## 增加workers工作线程数,可以有效提升logstash性能
pipeline.workers: 16

## 启动logstash
nohup /usr/local/logstash-6.6.0/bin/logstash -f /usr/local/logstash-6.6.0/script/logstash-script.conf &

--path.config 或 --f :logstash启动时使用的配置文件
--configtest 或 --t:测试 Logstash 读取到的配置文件语法是否能正常解析
--log或-l:日志输出存储位置
--pipeline.workers 或 --w:运行 filter 和 output 的 pipeline 线程数量。默认是 CPU 核数。
--pipeline.batch.size 或 --b:每个 Logstash pipeline 线程,在执行具体的 filter 和 output 函数之前,最多能累积的日志条数。
--pipeline.batch.delay 或 --u:每个 Logstash pipeline 线程,在打包批量日志的时候,最多等待几毫秒。
--verbose:输出调试日志
--debug:输出更多的调试日志

## 虚拟机配置
vim /usr/local/logstash-6.6.0/config/jvm.options

## 启动配置 比如启动时的java位置、LS的home等
vim /usr/local/logstash-6.6.0/config/startup.options

## 数据收集目录:/usr/local/logstash-6.6.0/data
## 插件目录:/usr/local/logstash-6.6.0/vendor/bundle/jruby/1.9/gems
## 查看插件命令:
/usr/local/logstash-6.6.0/bin/logstash-plugin list
## 更新插件命令:
/usr/local/logstash-6.6.0/bin/logstash-plugin update logstash-xxxx-xxxxx
## 安装插件命令:
/usr/local/logstash-6.6.0/bin/logstash-plugin install logstash-xxxx-xxxxx
## 插件地址: https://github.com/logstash-plugins
logstash-script.conf配置
conf
## multiline 插件也可以用于其他类似的堆栈式信息,比如 linux 的内核日志。
input {
  kafka {
    ## 应该接收哪些topic下的消息,app-log-服务名称
    topics_pattern => "app-log-.*"
    bootstrap_servers => "192.168.218.21:9092"
	codec => json
	consumer_threads => 1	## 增加consumer的并行消费线程数
	decorate_events => true
    #auto_offset_rest => "latest"
	group_id => "app-log-group"
   }

   kafka {
    ## 应该接收哪些topic下的消息,error-log-服务名称
    topics_pattern => "error-log-.*"
    bootstrap_servers => "192.168.218.21:9092"
	codec => json
	consumer_threads => 1
	decorate_events => true
    #auto_offset_rest => "latest"
	group_id => "error-log-group"
   }

}

filter {

  ## 时区转换
  ruby {
	code => "event.set('index_time',event.timestamp.time.localtime.strftime('%Y.%m.%d'))"
  }

  ## [fields][logtopic]从filebeat配置文件自定义边属性来的
  if "app-log" in [fields][logtopic]{
    grok {
        ## 表达式,对应服务日志输出的格式,匹配了则不过滤,未匹配则过滤
        match => ["message", "\[%{NOTSPACE:currentDateTime}\] \[%{NOTSPACE:level}\] \[%{NOTSPACE:thread-id}\] \[%{NOTSPACE:class}\] \[%{DATA:hostName}\] \[%{DATA:ip}\] \[%{DATA:applicationName}\] \[%{DATA:location}\] \[%{DATA:messageInfo}\] ## (\'\'|%{QUOTEDSTRING:throwable})"]
    }
  }

  if "error-log" in [fields][logtopic]{
    grok {
        ## 表达式
        match => ["message", "\[%{NOTSPACE:currentDateTime}\] \[%{NOTSPACE:level}\] \[%{NOTSPACE:thread-id}\] \[%{NOTSPACE:class}\] \[%{DATA:hostName}\] \[%{DATA:ip}\] \[%{DATA:applicationName}\] \[%{DATA:location}\] \[%{DATA:messageInfo}\] ## (\'\'|%{QUOTEDSTRING:throwable})"]
    }
  }

}

## 测试输出到控制台:
output {
  stdout { codec => rubydebug }
}


## elasticsearch:
output {

  if "app-log" in [fields][logtopic]{
	## es插件
	elasticsearch {
  	    # es服务地址
        hosts => ["192.168.11.35:9200"]
        # 用户名密码
        user => "elastic"
        password => "123456"
        ## 索引名,+ 号开头的,就会自动认为后面是时间格式:
        ## javalog-app-service-2019.01.23
        index => "app-log-%{[fields][logbiz]}-%{index_time}"
        # 是否嗅探集群ip:一般设置true;http://192.168.11.35:9200/_nodes/http?pretty
        # 通过嗅探机制进行es集群负载均衡发日志消息
        sniffing => true
        # logstash默认自带一个mapping模板,进行模板覆盖
        template_overwrite => true
    }
  }

  if "error-log" in [fields][logtopic]{
	elasticsearch {
        hosts => ["192.168.11.35:9200"]
        user => "elastic"
        password => "123456"
        index => "error-log-%{[fields][logbiz]}-%{index_time}"
        sniffing => true
        template_overwrite => true
    }
  }

}
logstash基础语法与使用
-
Logstash设计了自己的DSL包括有区域,注释,数据类型(布尔值,字符串,数值,数组,哈希),条件判断字段引用等。
-
Logstash用{}来定义区域。区域内可以包括插件区域定义,你可以在一个区域内定义多个插件。插件区域内则可以定义键值对设置。
-
格式、语法、使用方式:
shell# 注释. input { ... } filter { ... } output { ... }shell## 两个input设置: input { file { path => "/var/log/messages" type => "syslog" } file { path => "/var/log/apache/access.log" type => "apache" } }shell## 数据类型: ## bool类型 debug => true ## string类型 host => "hostname" ## number类型 port => 6789 ## array or list类型 path => ["/var/log/message","/var/log/*.log"] ## hash类型 match => { "field1" => "value1" "field2" => "value2" } ## codec类型 codec => "json" ##字段引用方式: { "agent": "Mozilla/5.0 (compatible; MSIE 9.0)", "ip": "192.168.24.44", "request": "/index.html" "response": { "status": 200, "bytes": 52353 }, "ua": { "os": "Windows 7" } } ##获取字段值: [response][status] [ua][os]shell## 条件判断condition: if EXPRESSION { ... } else if EXPRESSION { ... } else { ... } ==(等于), !=(不等于), <(小于), >(大于), <=(小于等于), >=(大于等于), =~(匹配正则), !~(不匹配正则) in(包含), not in(不包含), and(与), or(或), nand(非与), xor(非或) ()(复合表达式), !()(对复合表达式结果取反)shell## 使用环境变量(缺失报错): input { tcp { port => "${TCP_PORT}" } } ## 使用环境变量(缺失使用默认值): input { tcp { port => "${TCP_PORT:54321}" } } -
logstash例子:
shell## input 从标准输入流: input { stdin { } } ## 输入数据之后 如何进行处理: filter { ## grok:解析元数据插件,这里从input输入进来的所有数据默认都会存放到 "message" 字段中 ## grok提供很多正则表达式,地址为:http://grokdebug.herokuapp.com/patterns ## 比如:%{COMBINEDAPACHELOG} 表示其中一种正则表达式 Apache的表达式 grok { match => { "message" => "%{COMBINEDAPACHELOG}" } } ## date:日期格式化 date { match => [ "timestamp" , "dd/MMM/yyyy:HH:mm:ss Z" ] } } ## output 从标准输出流: output { elasticsearch { hosts => ["192.168.11.35:9200"] } stdout { codec => rubydebug } } -
file插件使用:
shell## file插件 input { file { path => ["/var/log/*.log", "/var/log/message"] type => "system" start_position => "beginning" } } ## 其他参数: discover_interval ## 表示每隔多久检测一下文件,默认15秒 exclude ## 表示排除那些文件 close_older ## 文件超过多长时间没有更新,就关闭监听 默认3600s ignore_older ## 每次检查文件列表 如果有一个文件 最后修改时间超过这个值 那么就忽略文件 86400s sincedb_path ## sincedb保存文件的位置,默认存在home下(/dev/null) sincedb_write_interval ## 每隔多久去记录一次 默认15秒 stat_interval ## 每隔多久查询一次文件状态 默认1秒 start_position ## 从头开始读取或者从结尾开始读取
elasticsearch&kibana存储可视化
watcher监控告警

json
PUT _xpack/watcher/watch/error_log_collector_watcher
{
	"trigger": {
		"schedule": {
			"interval": "5s"
		}
	},
	"input": {
		"search": {
			"request": {
				"indices": ["<error-log-collector-{now+8h/d}>"],
				"body": {
					"size": 0,
					"query": {
						"bool": {
							"must": [{
								"term": {
									"level": "ERROR"
								}
							}],
							"filter": {
								"range": {
									"currentDateTime": {
										"gt": "now-30s",
										"lt": "now"
									}
								}
							}
						}
					}
				}
			}
		}
	},
	"condition": {
		"compare": {
			"ctx.payload.hits.total": {
				"gt": 0
			}
		}
	},
	"transform": {
		"search": {
			"request": {
				"indices": ["<error-log-collector-{now+8h/d}>"],
				"bool": {
					"must": [{
						"term": {
							"level": "ERROR"
						}
					}],
					"filter": {
						"range": {
							"currentDateTime": {
								"gt": "now-30s",
								"lt": "now"
							}
						}
					}
				},
				"sort": [{
					"currentDateTime": {
						"order": "desc"
					}
				}]
			}
		}
	},
	"actions": {
		"test_error": {
			"throttle_period": "1m",
			"webhook": {
				"method": "POST",
				"url": "http://192.168.218.21:8001/watch",
				"body": "{
        \"title\": \"异常错误告警\",
        \"traceId\": \"{{#ctx.payload.hits.hits}} {{_source.traceId}} {{/ctx.payload.hits.hits}}\",
        \"spanId\" : \"{{#ctx.payload.hits.hits}} {{_source.spanId}} {{/ctx.payload.hits.hits}}\",
        \"level\":\"告警级别P1\",
        \"body\": \"{{#ctx.payload.hits.hits}} {{_source.messageInfo}} {{/ctx.payload.hits.hits}}\"
			}
		}
	}
}
watcher基础语法介绍
-
Xpack-Watchs基本使用:
首先看一个watcher的例子:
shell## 创建一个watcher,比如定义一个trigger 每个10s钟看一下input里的数据 PUT _xpack/watcher/watch/school_watcher { "trigger": { "schedule": { "interval": "10s" } }, ## 查看任务信息 "input": { "search": { "request": { ## 监控具体索引 "indices": ["school*"], ## body里面具体些搜索语句 "body": { "size": 0, "query": { "match": { ## 比如索引里面name 有 hello 则进行报警 "name": "hello" } } } } } }, ## 对于上面的查询结果进行比较: "condition": { ## compare进行比较 "compare": { ## 上面的query查询的结果会放入到ctx.payload中: ## 比如获取 ctx.payload.hits.total ctx.payload._shards.total 等等 "ctx.payload.hits.total": { "gt": 0 } } }, ## transform作用:重新查询出文档内容赋值给ctx.payload "transform": { "search": { "request": { "indices": ["school*"], "body": { "size": 10, "query": { "match": { "name": "hello" } } } } } }, ## 根据上面的查询、比较结果,执行actions里面定义的动作(定义多种报警类型) "actions": { ## 报警名字 "log_hello": { ## 防止报警风暴: 设置阈值 15m内曾经报警过, 则不报警 "throttle_period": "15m", ## 报警方式:logging、mail、http等 "logging": { ## 报警具体内容:使用 {{ 查询参数 }} 进行赋值: "text": "Found {{ctx.payload.hits.total}} hello in the school" } } } } -
ctx.payload取值规范:
比如我们进行search搜索school里面name=zhangsan的数据:
shell## payload取值规范:比如我们进行search搜索school: GET school/_search { "query": { "match": { "name": "zhangsan" } } }查询结果如下:
shell{ "took": 14, "timed_out": false, "_shards": { "total": 2, "successful": 2, "skipped": 0, "failed": 0 }, "hits": { "total": 1, "max_score": 1.5404451, "hits": [ { "_index": "school", "_type": "student", "_id": "1", "_score": 1.5404451, "_source": { "name": "zhangsan", "age": 25, "course": "elasticsearch", "study_date": "2018-06-15T20:30:50", "mark": "today is a good day" } } ] } }表示查询:ctx.payload结果集:
shell## 表示查询:ctx.payload结果集: {{#ctx.payload.hits.hits}} {{_source.name}} {{_source.course}} {{/ctx.payload.hits.hits}}比如我们进行search搜索school并采用聚合的方式来查询terms course数据:
shellGET school/_search { "size": 0, "aggs": { "myterms": { "terms": { "field": "course", "size": 10 } } } }查询结果:
shell{ "took": 11, "timed_out": false, "_shards": { "total": 2, "successful": 2, "skipped": 0, "failed": 0 }, "hits": { "total": 10, "max_score": 0, "hits": [] }, "aggregations": { "myterms": { "doc_count_error_upper_bound": 0, "sum_other_doc_count": 0, "buckets": [ { "key": "elasticsearch", "doc_count": 7 }, { "key": "good", "doc_count": 1 }, { "key": "spring", "doc_count": 1 }, { "key": "spring elasticsearch", "doc_count": 1 } ] } } }payload取值使用:现在想取得上面的hits.hits里面的数据内容,就可以使用如下方式:
shell## 表示查询:ctx.payload结果集: {{#ctx.payload.aggregations.aggsname.buckets}} {{key}} {{doc_count}} {{/ctx.payload.aggregations.aggsname.buckets}} ## 针对这里内容就是: {{#ctx.payload.aggregations.myterms.buckets}} {{key}} {{doc_count}} {{/ctx.payload.aggregations.myterms.buckets}} -
watcher API使用:
shell#查看一个watcher # GET _xpack/watcher/watch/school_watcher #删除一个watcher # DELETE _xpack/watcher/watch/school_watcher #执行watcher # POST _xpack/watcher/watch/school_watcher/_execute #查看执行结果 GET /.watcher-history*/_search?pretty { "sort" : [ { "result.execution_time" : "desc" } ], "query": { "match": { "watch_id": "school_watcher" } } } -
triggers的几种类型
shell#--------------------triggers的几种类型-------------------- #hourly、daily、weekly、monthly、yearly、cron、interval #hourly:每小时执行 #例如:12:00, 12:15, 12:30, 12:45, 1:00, 1:15 { "trigger" : { "schedule" : { "hourly" : { "minute" : [ 0, 15, 30, 45 ] } } } } #daily:每天执行 #每天00:00, 12:00, and 17:00 { "trigger" : { "schedule" : { "daily" : { "at" : [ "midnight", "noon", "17:00" ] } } } } #每天00:00, 00:30, 12:00, 12:30, 17:00 and 17:30 { "trigger" : { "schedule" : { "daily" : { "at" { "hour" : [ 0, 12, 17 ], "minute" : [0, 30] } } } } } #weekly:指定星期几 #周二12:00,周五17:00 { "trigger" : { "schedule" : { "weekly" : [ { "on" : "tuesday", "at" : "noon" }, { "on" : "friday", "at" : "17:00" } ] } } } #周二、周五的17:00 { "trigger" : { "schedule" : { "weekly" : { "on" : [ "tuesday", "friday" ], "at" : [ "noon", "17:00" ] } } } } #monthly:指定每月哪天执行 #每月10号中午、每月20号17:00 { "trigger" : { "schedule" : { "monthly" : [ { "on" : 10, "at" : "noon" }, { "on" : 20, "at" : "17:00" } ] } } } #每月10号、20号的00:00,12:00 { "trigger" : { "schedule" : { "monthly" : { "on" : [ 10, 20 ], "at" : [ "midnight", "noon" ] } } } } #yearly-指定月、日、时 #每年的1月10日12:00,每年的7月20日17:00 { "trigger" : { "schedule" : { "yearly" : [ { "in" : "january", "on" : 10, "at" : "noon" }, { "in" : "july", "on" : 20, "at" : "17:00" } ] } } } #每年1月10日,1月20日,12月10日,12月20日的12:00,00:00 { "trigger" : { "schedule" : { "yearly" : { "in" : [ "jan", "dec" ], "on" : [ 10, 20 ], "at" : [ "midnight", "noon" ] } } } } #cron-表达式 <seconds> <minutes> <hours> <day_of_month> <month> <day_of_week> [year] 0 5 9 * * ? 0 0-5 9 * * ? 0 0/15 9 * * ? #interval-周期的 #间隔单位:s:秒、m:分钟、h:小时、d:天、w:星期 -
input的几种类型:
shell#--------------------Inputs的几种类型-------------------- #Simple、Search、HTTP、Chain #Simple Input-静态数据 #每天12点触发 { "trigger" : { "schedule" : { "daily" : { "at" : "noon" } } }, "input" : { "simple" : { "name" : "John" } }, "actions" : { "reminder_email" : { "email" : { "to" : "to@host.domain", "subject" : "Reminder", "body" : "Dear {{ctx.payload.name}}, by the time you read these lines, I'll be gone" } } } } #Search-搜索 { "input" : { "search" : { "request" : { "indices" : [ "logs" ], "body" : { "query" : { "match_all" : {} } } } } }, "condition" : { "compare" : { "ctx.payload.hits.total" : { "gt" : 5 }} } ... } #Http-请求 #request.host #request.port #request.path #request.headers #request.params #request.url:request.scheme, request.host, request.port and request.params #request.method:head、get、post、put、delete #request.auth #request.body #request.proxy.host #request.proxy.port #request.connection_timeout #request.read_timeout #response_content_type:json, yaml and text #extract #get请求 { "input" : { "http" : { "request" : { "host" : "example.com", "port" : 9200, "path" : "/idx/_search" } } } } #含有body体内容 { "input" : { "http" : { "request" : { "host" : "host.domain", "port" : 9200, "path" : "/idx/_search", "body" : "{\"query\" : { \"match\" : { \"category\" : \"event\"}}}" } } } } #含有参数的 { "input" : { "http" : { "request" : { "host" : "host.domain", "port" : "9200", "path" : "/_cluster/stats", "params" : { "human" : "true" } } } } } #含有用户密码 { "input" : { "http" : { "request" : { "host" : "host.domain", "port" : "9200", "path" : "/myservice", "auth" : { "basic" : { "username" : "user", "password" : "pass" } } } } } } #直接请求url的 { "input" : { "http" : { "request" : { "url" : "http://api.openweathermap.org/data/2.5/weather", "params" : { "lat" : "52.374031", "lon" : "4.88969", "appid" : "<your openweathermap appid>" } } } } } #Chain-input-同时设置多个input,串行 { "input" : { "chain" : { "inputs" : [ ## 第一步input { "first" : { "simple" : { "path" : "/_search" } } }, ## 第二步input (可以去使用第一步input返回的结果) { "second" : { "http" : { "request" : { "host" : "localhost", "port" : 9200, "path" : "{{ctx.payload.first.path}}" } } } } ] } } } -
condition条件设置:如果condition条件返回true 则会触发action 如果返回 false 则就停止,不执行action
shell#--------------------条件设置-------------------- #Always Condition "condition" : { "always" : {} } #Never Condition "condition" : { "never" : {} } #Compare Condition (进行和查询的结果进行比较语法如下:) # eq:、not_eq、gt、gte、lt、lte # 比如错误条数超过了5条进行报警、响应长时间超过多少毫秒进行报警等 { "condition" : { "compare" : { "ctx.payload.hits.total" : { "gte" : 5 } } } #<{expression}> 正则表达式 使用 <> 中写正则表达式: 比如 当前时间 - 5分钟 进行比较,如下: { "condition" : { "compare" : { "ctx.execution_time" : { "gte" : "<{now-5m}>" } } } #{{path}} 比较,这个就是最开始的示例里面的获取参数方式,如下: { "condition" : { "compare" : { "ctx.payload.aggregations.status.buckets.error.doc_count" : { "not_eq" : "{{ctx.payload.aggregations.handled.buckets.true.doc_count}}" } } } #Array Compare Condition 数组比较: 比如当前的doc_count大于25 就进行报警 { "condition": { "array_compare": { "ctx.payload.aggregations.top_tweeters.buckets" : { "path": "doc_count" , "gte": { "value": 25, } } } } } #Script Condition 脚本方式 { "input" : { "search" : { "indices" : "log-events", "body" : { "size" : 0, "query" : { "match" : { "status" : "error" } } } } }, "condition" : { "script" : { ## 当前返回的条数是否大于阈值,进行报警 "inline" : "return ctx.payload.hits.total > threshold", "params" : { "threshold" : 5 } } } } -
Action 触发器
shell#--------------------Actions-------------------- #Email Action--发送邮件 #如果使用发送邮件的报警,则需要在elasticsearch.yml中配置发送邮件服务的信息 xpack.notification.email: default_account: gmail_account account: gmail_account: profile: gmail smtp: auth: true starttls.enable: true host: smtp.gmail.com port: 587 user: <username> password: <password> outlook_account: profile: outlook smtp: auth: true starttls.enable: true host: smtp-mail.outlook.com port: 587 user: <username> password: <password>: exchange_account: profile: outlook email_defaults: from: <email address of service account> smtp: auth: true starttls.enable: true host: <your exchange server> port: 587 user: <email address of service account> password: <password> #发送邮件 "actions" : { ## actions名字 "send_email" : { "email" : { "to" : "'Recipient Name <recipient@example.com>'", #"to" : ['Personal Name <user1@host.domain>', 'user2@host.domain'], "subject" : "Watcher Notification", "body" : "{{ctx.payload.hits.total}} error logs found" } } } #发送含有附件信息的邮件 "actions" : { "email_admin" : { "email": { "to": "'John Doe <john.doe@example.com>'", "attachments" : { ## 附件方式 "my_image.png" : { "http" : { "content_type" : "image.png", "request" : { "url": "http://example.org/foo/my-image.png" } } }, ## xpack reporting插件生成方式: "dashboard.pdf" : { "reporting" : { "url": "http://example.org:5601/api/reporting/generate/dashboard/Error-Monitoring" } }, ## 自定义附件 "data.yml" : { "data" : { "format" : "yaml" } } } } } } #Webhook Action,发送一个http请求 #发送github的issue "actions" : { "create_github_issue" : { ## 因为发邮件到达率不是特别高,所以可以使用外部的接口调用方式 ## 比如这里调用url为外部的手机短信接口进行发送 "webhook" : { ## 请求方式 "method" : "POST", ## 外部请求地址 "url" : "https://api.github.com/repos/<owner>/<repo>/issues", ## 请求报文 "body" : "{ \"title\": \"Found errors in 'contact.html'\", \"body\": \"Found {{ctx.payload.hits.total}} errors in the last 5 minutes\", \"assignee\": \"web-admin\", \"labels\": [ \"bug\", \"sev2\" ] }", ## 用户名密码 "auth" : { "basic" : { "username" : "<username>", "password" : "<password>" } } } } } #带有url参数的请求 "actions" : { "my_webhook" : { "webhook" : { "method" : "POST", "host" : "mylisteningserver", "port" : 9200, "path": ":/alert", "params" : { "watch_id" : "{{ctx.watch_id}}" } } } } #自定义header "actions" : { "my_webhook" : { "webhook" : { "method" : "POST", "host" : "mylisteningserver", "port" : 9200, "path": ":/alert/{{ctx.watch_id}}", "headers" : { "Content-Type" : "application/yaml" }, "body" : "count: {{ctx.payload.hits.total}}" } } } #Index Action--创建索引文档 "actions" : { "index_payload" : { "index" : { "index" : "my-index", "doc_type" : "my-type", "doc_id": "my-id" } } } #Logging Action--记录日志 #level:error, warn, info, debug and trace ## 日志种类: #category:xpack.watcher.actions.logging "actions" : { "log" : { "transform" : { ... }, ## 日志报警 "logging" : { "text" : "executed at {{ctx.execution_time}}", ## 日志级别 "level": "info" } } } #Jira Action 与jira集成 #HipChat Action #Slack Action #PagerDuty Action -
使用接口的形式创建一个watcher, 进行模拟:
-
执watcher脚本:
shell## 查询school GET school/student/_search { "query": { "match_all":{} } } ## 创建school_watcher PUT _xpack/watcher/watch/school_watcher { "trigger": { "schedule": { "interval": "10s" } }, "input": { "search": { "request": { "indices": ["school*"], "body": { "size": 0, "query": { "match": { "name": "hello" } } } } } }, "condition": { "compare": { "ctx.payload.hits.total": { "gt": 0 } } }, "transform": { "search": { "request": { "indices": ["school*"], "body": { "size": 10, "query": { "match": { "name": "hello" } } } } } }, "actions": { "log_hello": { "throttle_period": "15m", "logging": { "text": "Found {{ctx.payload.hits.total}} hello in the school" } } } } ## 查看watcher执行结果 GET /.watcher-history*/_search?pretty { "sort" : [ { "result.execution_time" : "desc" } ], "query": { "match": { "watch_id": "school_watcher" } } } ## 进行数据测试: POST /school/student { "name": "hello", "age": 18, "course": "elasticsearch", "study_date": "2018-08-20T20:30:50", "mark": "take care day day" } -
可视化操作watcher,可以启用、禁用、添加修改、删除watcher
略
-
watcher实战使用
shell
## 创建一个watcher,比如定义一个trigger 每个10s钟看一下input里的数据
PUT _xpack/watcher/watch/applog_error_watcher
{
  "trigger": {
    "schedule": {
      "interval": "10s"
    }
  },
  "input": {
    "search": {
      "request": {
        "indices": ["javalog-app-*"],
        "body": {
          "size": 0,
          "query": {
            "match": {
              "level": "ERROR"
            }
          }
        }
      }
    }
  },
  "condition": {
    "compare": {
      "ctx.payload.hits.total": {
        "gt": 0
      }
    }
  },
  "transform": {
    "search": {
      "request": {
        "indices": ["javalog-app-*"],
        "body": {
          "size": 10,
          "query": {
            "match": {
              "name": "hello"
            }
          }
        }
      }
    }
  },
  "actions": {
    "test_error": {
    "throttle_period": "1m",
    "webhook" : {
      "method" : "POST",
      "url" : "http://192.168.11.32:8001/watch",
      "body" : "{
        \"title\": \"异常错误告警\",
        \"traceId\": \"{{#ctx.payload.hits.hits}} {{_source.traceId}} {{/ctx.payload.hits.hits}}\",
        \"spanId\" : \"{{#ctx.payload.hits.hits}} {{_source.spanId}} {{/ctx.payload.hits.hits}}\",
        \"level\":\"告警级别P1\",
        \"body\": \"{{#ctx.payload.hits.hits}} {{_source.messageInfo}} {{/ctx.payload.hits.hits}}\"
       }
      }
    }
 }
}


## {{#ctx.payload.hits.hits}} {{_source.traceId}} {{/ctx.payload.hits.hits}}
## {{#ctx.payload.hits.hits}} {{_source.spanId}} {{/ctx.payload.hits.hits}}
## {{#ctx.payload.hits.hits}} {{_source.messageInfo}} {{/ctx.payload.hits.hits}}


## 查询error
GET javalog-app-2019.01.24/_search
{
  "query": {
    "match": {
      "level.keyword": "ERROR"
    }
  }
}


# 查看一个watcher
# GET _xpack/watcher/watch/applog_error_watcher

#删除一个watcher
# DELETE _xpack/watcher/watch/applog_error_watcher

#执行watcher
# POST _xpack/watcher/watch/applog_error_watcher/_execute

#查看执行结果
GET /.watcher-history*/_search?pretty
{
  "sort" : [
    { "result.execution_time" : "desc" }
  ],
  "query": {
    "match": {
      "watch_id": "applog_error_watcher"
    }
  }
}