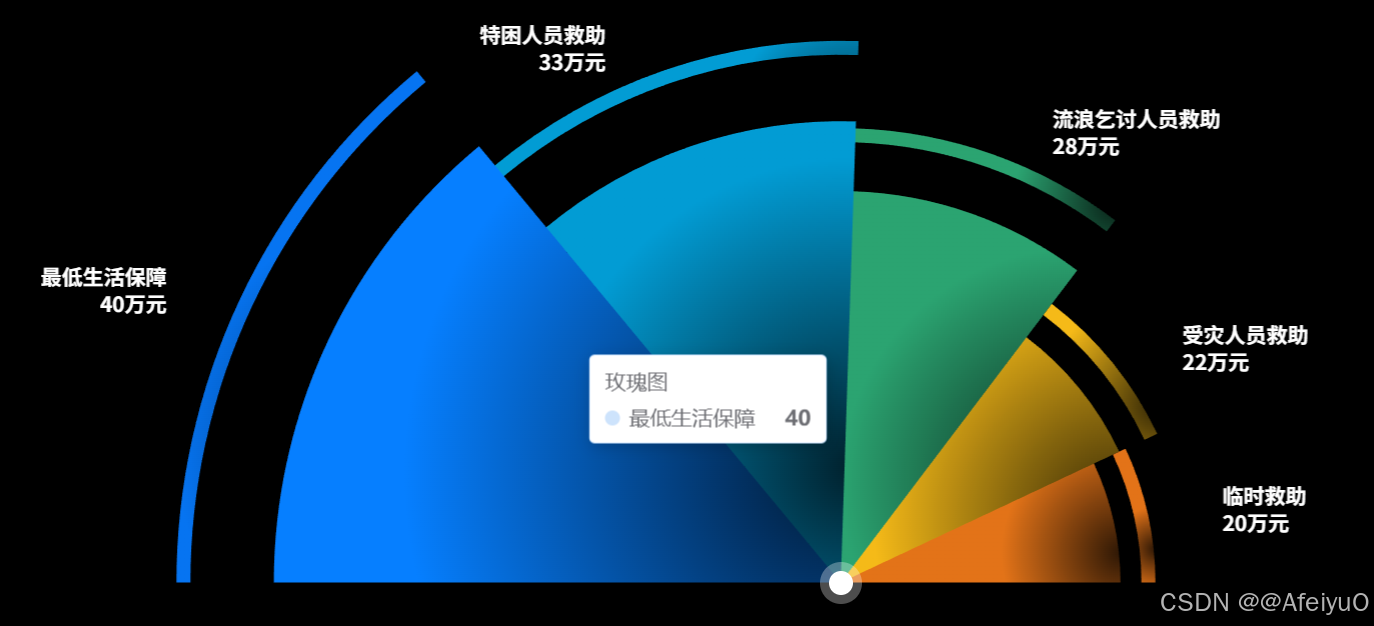
效果图:
html
<template>
  <div class="MultiPie">
    <div class="charts-box" ref="ChartsBox">
      <v-chart ref="vChartRef" :option="option"> </v-chart>

      <!-- 大圆圈 -->
      <div
        class="big-circle"
        :style="{
          width: option.bigCircleWidth,
          height: option.bigCircleWidth,
          top: option.bigCircleTop,
          left: option.bigCircleleft,
        }"
      ></div>

      <!-- 小圆圈 -->
      <div
        class="small-circle"
        :style="{
          width: option.smallCircleWidth,
          height: option.smallCircleWidth,
          top: option.smallCircleTop,
          left: option.smallCircleleft,
        }"
      ></div>
    </div>
  </div>
</template>
<script setup lang="ts">
import HcpPng from "/uicom-assets/images/common/hcp-bg.png";
import { ref, onMounted, reactive, getCurrentInstance } from "vue";
import VChart from "vue-echarts";
import { use } from "echarts/core";
import { CanvasRenderer } from "echarts/renderers";
import { PieChart } from "echarts/charts";
import {
  DatasetComponent,
  GridComponent,
  TooltipComponent,
  LegendComponent,
} from "echarts/components";
import { BarChart } from "echarts/charts";

const { proxy }: any = getCurrentInstance();

use([
  DatasetComponent,
  CanvasRenderer,
  BarChart,
  GridComponent,
  TooltipComponent,
  LegendComponent,
  PieChart,
]);

// 获取图表实例
const vChartRef = ref();
const ChartsBox = ref(null);

const chartData = ref([
  { value: 40, name: "最低生活保障" },
  { value: 33, name: "特困人员救助" },
  { value: 28, name: "流浪乞讨人员救助" },
  { value: 22, name: "受灾人员救助" },
  { value: 20, name: "临时救助" },
]);

const halfCircleItemArr = chartData.value.map((i) => {
  return {
    value: i.value,
    itemStyle: {
      color: "none",
      decal: {
        symbol: "none",
      },
    },
    label: {
      show: false,
    },
  };
});

const option = reactive({
  // 标签显示信息
  labelFormatInfo: "{b}\\n{c}万元",
  // 组件属性
  chartName: "玫瑰图",
  unit: "条",

  bigCircleTop: "75%",
  bigCircleleft: "50%",
  bigCircleWidth: "28px",

  smallCircleTop: "75%",
  smallCircleleft: "50%",
  smallCircleWidth: "16px",

  // 调整标签位置
  // XY
  lablePosition: [
    {
      x: 145,
      y: 230,
    },
    {
      x: 320,
      y: 130,
    },
    {
      x: 450,
      y: 150,
    },
    {
      x: 520,
      y: 200,
    },
    {
      x: 560,
      y: 280,
    },
    {
      x: 0,
      y: 0,
    },
    {
      x: 0,
      y: 0,
    },
    {
      x: 0,
      y: 0,
    },
    {
      x: 0,
      y: 0,
    },
    {
      x: 0,
      y: 0,
    },
    {
      x: 0,
      y: 0,
    },
    {
      x: 0,
      y: 0,
    },
    {
      x: 0,
      y: 0,
    },
  ],

  // 图表属性
  tooltip: {
    trigger: "item",
  },
  legend: {
    show: false,
  },

  color: [
    {
      type: "radial",
      x: 1,
      y: 0.75,
      r: 1,
      colorStops: [
        {
          offset: 0,
          color: "#0674F133", // 100% 处的颜色
        },
        {
          offset: 1,
          color: "#0674F1FF", // 0% 处的颜色
        },
      ],
      global: false, // 缺省为 false
    },
    {
      type: "radial",
      x: 1,
      y: 0.75,
      r: 1,
      colorStops: [
        {
          offset: 0,
          color: "#029CD433", // 100% 处的颜色
        },
        {
          offset: 1,
          color: "#029CD4FF", // 0% 处的颜色
        },
      ],
      global: false, // 缺省为 false
    },
    {
      type: "radial",
      x: 1,
      y: 0.75,
      r: 1,
      colorStops: [
        {
          offset: 0,
          color: "#2BA47133", // 0% 处的颜色
        },
        {
          offset: 1,
          color: "#2BA471FF", // 100% 处的颜色
        },
      ],
      global: false, // 缺省为 false
    },
    {
      type: "radial",
      x: 1,
      y: 0.75,
      r: 1,
      colorStops: [
        {
          offset: 0,
          color: "#F5BA1833", // 0% 处的颜色
        },
        {
          offset: 1,
          color: "#F5BA18FF", // 100% 处的颜色
        },
      ],
      global: false, // 缺省为 false
    },
    {
      type: "radial",
      x: 1,
      y: 0.75,
      r: 1,
      colorStops: [
        {
          offset: 0,
          color: "#E3731833", // 0% 处的颜色
        },
        {
          offset: 1,
          color: "#E37318FF", // 100% 处的颜色
        },
      ],
      global: false, // 缺省为 false
    },
  ],

  series: [
    {
      name: "玫瑰图",
      type: "pie",
      startAngle: 180,
      minAngle: 0,
      radius: [0, "80%"],
      center: ["50%", "75%"],
      roseType: "radius",
      itemStyle: {
        borderRadius: 0,
      },
      label: {
        show: false,
      },
      labelLine: {
        show: false,
      },
      emphasis: {
        label: {
          show: false,
        },
        labelLine: {
          show: false,
        },
      },
      data: <any>[],
    },
  ],
});

onMounted(() => {
  const numarr = chartData.value.map((i) => i.value);
  const maxValue = Math.max(...numarr);
  const radiusArr = numarr.map((i) => i / maxValue);
  const circleArrData = [...chartData.value, ...halfCircleItemArr];

  const circleArrSeries = circleArrData.map((item, i) => {
    return {
      name: option.chartName,
      type: "pie",
      minAngle: 25, // 最小角度
      startAngle: 180,
      radius: [
        radiusArr[i] ? (radiusArr[i] - 0.07) * 100 + "%" : "92%",
        radiusArr[i] ? (radiusArr[i] - 0.05) * 100 + "%" : "95%",
      ],
      center: ["50%", "75%"],
      itemStyle: {
        borderRadius: 0,
      },
      label: {
        show: true,
        width: 127,
        fontWeight: 700,
        overflow: "break",
        fontFamily: "AlibabaPuHuiTi_2_85_Bold",
        fontSize: 14,
        lineHeight: 18,
        color: "#FFFFFF",
        formatter: option.labelFormatInfo.replace(/\\n/g, "\n"),
      },

      labelLine: {
        show: false,
      },
      labelLayout: {
        align: "left",
        verticalAlign: "middle",
        x: option.lablePosition[i] ? option.lablePosition[i]["x"] : -10,
        y: option.lablePosition[i] ? option.lablePosition[i]["y"] : -15,
      },
      emphasis: {
        disabled: true,
        label: {
          show: true,
        },
      },
      data: circleArrData.map((e: any, j) => {
        let obj = {};
        if (j === i && j + 1 <= circleArrData.length / 2) {
          obj = {
            value: option.series[0].roseType === "radius" ? e.value : 30,
            name: e.name,
          };
        } else {
          obj = {
            value: option.series[0].roseType === "radius" ? e.value : 30,
            name: e.name,
            itemStyle: {
              color: "none",
              decal: {
                symbol: "none",
              },
            },
            label: {
              show: false,
            },
          };
        }
        return obj;
      }),
    };
  });

  circleArrSeries.map((i: any) => {
    option.series.push(i);
  });
  option.series[0].data = [...chartData.value, ...halfCircleItemArr];
});
</script>

<style lang="scss" scoped>
.MultiPie {
  background-color: #000;
  width: 100%;
  height: 100%;
  display: flex;
  flex-direction: row;
  justify-content: center;
  align-items: flex-end;
  .charts-box {
    width: 100%;
    height: 100%;
    position: relative;
    .big-circle {
      position: absolute;
      z-index: 99;
      width: 28px;
      height: 28px;
      background: #ffffff4d;
      border-radius: 50%;
      left: 50%;
      top: 75%;
      transform: translate(-50%, -50%);
    }
    .small-circle {
      position: absolute;
      z-index: 100;
      width: 16px;
      height: 16px;
      background: #ffffff;
      border-radius: 50%;
      left: 50%;
      top: 75%;
      transform: translate(-50%, -50%);
    }
  }
}
</style>