python
# This Python 3 environment comes with many helpful analytics libraries installed
# It is defined by the kaggle/python Docker image: https://github.com/kaggle/docker-python
# For example, here's several helpful packages to load

import numpy as np # linear algebra
import pandas as pd # data processing, CSV file I/O (e.g. pd.read_csv)

# Input data files are available in the read-only "../input/" directory
# For example, running this (by clicking run or pressing Shift+Enter) will list all files under the input directory

import os
for dirname, _, filenames in os.walk('/input'):
    for filename in filenames:
        print(os.path.join(dirname, filename))

# You can write up to 20GB to the current directory (/working/) that gets preserved as output when you create a version using "Save & Run All"
# You can also write temporary files to /temp/, but they won't be saved outside of the current session
python
/Amazon.csv
python
import kagglehub

# Download latest version
path = kagglehub.dataset_download("rohiteng/amazon-sales-dataset")

print("Path to dataset files:", path)
python
Path to dataset files: /amazon-sales-dataset
python
data=pd.read_csv('/Amazon.csv')
python
data.head()|---|------------|------------|------------|---------------|-----------|---------------------|-----------------|------------|----------|-----------|----------|-------|--------------|-------------|------------------|-------------|-------------|-------|---------------|-----------|
| | OrderID | OrderDate | CustomerID | CustomerName | ProductID | ProductName | Category | Brand | Quantity | UnitPrice | Discount | Tax | ShippingCost | TotalAmount | PaymentMethod | OrderStatus | City | State | Country | SellerID |
| 0 | ORD0000001 | 2023-01-31 | CUST001504 | Vihaan Sharma | P00014 | Drone Mini | Books | BrightLux | 3 | 106.59 | 0.00 | 0.00 | 0.09 | 319.86 | Debit Card | Delivered | Washington | DC | India | SELL01967 |
| 1 | ORD0000002 | 2023-12-30 | CUST000178 | Pooja Kumar | P00040 | Microphone | Home & Kitchen | UrbanStyle | 1 | 251.37 | 0.05 | 19.10 | 1.74 | 259.64 | Amazon Pay | Delivered | Fort Worth | TX | United States | SELL01298 |
| 2 | ORD0000003 | 2022-05-10 | CUST047516 | Sneha Singh | P00044 | Power Bank 20000mAh | Clothing | UrbanStyle | 3 | 35.03 | 0.10 | 7.57 | 5.91 | 108.06 | Debit Card | Delivered | Austin | TX | United States | SELL00908 |
| 3 | ORD0000004 | 2023-07-18 | CUST030059 | Vihaan Reddy | P00041 | Webcam Full HD | Home & Kitchen | Zenith | 5 | 33.58 | 0.15 | 11.42 | 5.53 | 159.66 | Cash on Delivery | Delivered | Charlotte | NC | India | SELL01164 |
| 4 | ORD0000005 | 2023-02-04 | CUST048677 | Aditya Kapoor | P00029 | T-Shirt | Clothing | KiddoFun | 2 | 515.64 | 0.25 | 38.67 | 9.23 | 821.36 | Credit Card | Cancelled | San Antonio | TX | Canada | SELL01411 |
python
data.describe()|-------|---------------|---------------|---------------|---------------|---------------|---------------|
| | Quantity | UnitPrice | Discount | Tax | ShippingCost | TotalAmount |
| count | 100000.000000 | 100000.000000 | 100000.000000 | 100000.000000 | 100000.000000 | 100000.000000 |
| mean | 3.001400 | 302.905748 | 0.074226 | 68.468902 | 7.406660 | 918.256479 |
| std | 1.413548 | 171.840797 | 0.082583 | 74.131180 | 4.324057 | 724.508332 |
| min | 1.000000 | 5.000000 | 0.000000 | 0.000000 | 0.000000 | 4.270000 |
| 25% | 2.000000 | 154.190000 | 0.000000 | 15.920000 | 3.680000 | 340.890000 |
| 50% | 3.000000 | 303.070000 | 0.050000 | 45.250000 | 7.300000 | 714.315000 |
| 75% | 4.000000 | 451.500000 | 0.100000 | 96.060000 | 11.150000 | 1349.765000 |
| max | 5.000000 | 599.990000 | 0.300000 | 538.460000 | 15.000000 | 3534.980000 |
python
data.info()<class 'pandas.core.frame.DataFrame'>
RangeIndex: 100000 entries, 0 to 99999
Data columns (total 20 columns):
# Column Non-Null Count Dtype
--- ------ -------------- -----
0 OrderID 100000 non-null object
1 OrderDate 100000 non-null object
2 CustomerID 100000 non-null object
3 CustomerName 100000 non-null object
4 ProductID 100000 non-null object
5 ProductName 100000 non-null object
6 Category 100000 non-null object
7 Brand 100000 non-null object
8 Quantity 100000 non-null int64
9 UnitPrice 100000 non-null float64
10 Discount 100000 non-null float64
11 Tax 100000 non-null float64
12 ShippingCost 100000 non-null float64
13 TotalAmount 100000 non-null float64
14 PaymentMethod 100000 non-null object
15 OrderStatus 100000 non-null object
16 City 100000 non-null object
17 State 100000 non-null object
18 Country 100000 non-null object
19 SellerID 100000 non-null object
dtypes: float64(5), int64(1), object(14)
memory usage: 15.3+ MB
python
import pandas as pd
import numpy as np
import matplotlib.pyplot as plt
import seaborn as sns
from collections import defaultdict, Counter
import warnings
warnings.filterwarnings('ignore')

# Set style
plt.style.use('seaborn-v0_8-darkgrid')
sns.set_palette("husl")

# ============================================
# 1. DATA ANALYSIS & DIAGNOSTICS
# ============================================
print("="*70)
print("1. DATA ANALYSIS & DIAGNOSTICS")
print("="*70)

# df = pd.read_csv('amazon_sales_data.csv')
df['OrderDate'] = pd.to_datetime(df['OrderDate'])
df = df.sort_values(['CustomerID', 'OrderDate'])

print(f"Dataset Shape: {df.shape}")
print(f"Date Range: {df['OrderDate'].min().date()} to {df['OrderDate'].max().date()}")
print(f"Unique Customers: {df['CustomerID'].nunique():,}")
print(f"Unique Categories: {df['Category'].nunique():,}")
print(f"Unique Products: {df['ProductID'].nunique():,}")

# Analyze customer purchase behavior
customer_stats = df.groupby('CustomerID').agg({
    'OrderDate': ['min', 'max', 'count'],
    'TotalAmount': 'sum',
    'Category': lambda x: len(set(x))
}).round(2)

customer_stats.columns = ['first_purchase', 'last_purchase', 'purchase_count',
                          'total_spent', 'unique_categories']
customer_stats['purchase_frequency'] = customer_stats['purchase_count']

print(f"\nCustomer Purchase Statistics:")
print(f"• Average purchases per customer: {customer_stats['purchase_count'].mean():.2f}")
print(f"• Median purchases per customer: {customer_stats['purchase_count'].median():.2f}")
print(f"• Customers with 1 purchase: {(customer_stats['purchase_count'] == 1).sum():,}")
print(f"• Customers with 2+ purchases: {(customer_stats['purchase_count'] >= 2).sum():,}")
print(f"• Customers with 3+ purchases: {(customer_stats['purchase_count'] >= 3).sum():,}")

# Create sequences for customers with 2+ purchases
def create_sequences_with_metadata(df, min_purchases=2):
    """Create sequences with additional metadata"""
    sequences = {}
    customer_metrics = {}

    for cust_id, group in df.groupby('CustomerID'):
        if len(group) >= min_purchases:
            # Create sequence
            seq = group['Category'].tolist()
            sequences[cust_id] = seq

            # Store detailed metrics
            customer_metrics[cust_id] = {
                'sequence': seq,
                'purchase_count': len(group),
                'total_spent': group['TotalAmount'].sum(),
                'avg_order_value': group['TotalAmount'].mean(),
                'unique_categories': len(set(seq)),
                'date_range': (group['OrderDate'].min(), group['OrderDate'].max()),
                'products': group['ProductID'].tolist()
            }

    return sequences, customer_metrics

sequences, cust_metrics = create_sequences_with_metadata(df, min_purchases=2)

print(f"\nSequences created for {len(sequences):,} customers (≥2 purchases)")
print(f"Average sequence length: {np.mean([len(s) for s in sequences.values()]):.2f}")

# Analyze sequence characteristics
seq_lengths = [len(s) for s in sequences.values()]
unique_cats_per_seq = [len(set(s)) for s in sequences.values()]

print(f"\nSequence Analysis:")
print(f"• Min sequence length: {min(seq_lengths)}")
print(f"• Max sequence length: {max(seq_lengths)}")
print(f"• Average unique categories per sequence: {np.mean(unique_cats_per_seq):.2f}")

# Show most common categories
all_categories = [cat for seq in sequences.values() for cat in seq]
category_counts = Counter(all_categories)
print(f"\nTop 10 Most Common Categories in Sequences:")
for cat, count in category_counts.most_common(10):
    percentage = (count / len(all_categories)) * 100
    print(f"  • {cat}: {count:,} occurrences ({percentage:.1f}%)")

# ============================================
# 2. MAIN IMPLEMENTATION
# ============================================
print("\n" + "="*70)
print("2. SIMPLIFIED SPADE ANALYSIS")
print("="*70)

class SimpleSPADE:
    def __init__(self, min_support=0.001, min_confidence=0.1):
        self.min_support = min_support
        self.min_confidence = min_confidence
        self.patterns = {}

    def find_patterns(self, sequences):
        """Find sequential patterns A->B"""
        print(f"Analyzing {len(sequences):,} sequences...")

        # Count single items
        item_counts = Counter()
        for seq in sequences.values():
            for item in set(seq):  # Count unique items per customer
                item_counts[item] += 1

        total_customers = len(sequences)
        print(f"Total customers: {total_customers}")
        print(f"Unique items found: {len(item_counts)}")

        # Filter frequent items
        frequent_items = {}
        for item, count in item_counts.items():
            support = count / total_customers
            if support >= self.min_support:
                frequent_items[item] = {
                    'support': support,
                    'count': count
                }

        print(f"Frequent items (support ≥ {self.min_support}): {len(frequent_items)}")

        # Find sequential patterns A->B
        sequential_patterns = {}

        # Create customer-item positions dictionary
        customer_item_positions = defaultdict(lambda: defaultdict(list))
        for cust_id, seq in sequences.items():
            for pos, item in enumerate(seq):
                customer_item_positions[cust_id][item].append(pos)

        # Check all pairs of frequent items
        items_list = list(frequent_items.keys())

        for i, item_a in enumerate(items_list):
            for item_b in items_list:
                if item_a != item_b:
                    pattern_customers = 0
                    total_a_buyers = 0

                    for cust_id in sequences.keys():
                        if item_a in customer_item_positions[cust_id]:
                            total_a_buyers += 1
                            positions_a = customer_item_positions[cust_id][item_a]
                            positions_b = customer_item_positions[cust_id].get(item_b, [])

                            if positions_b:  # Customer bought item_b
                                # Check if item_b was bought after item_a
                                min_pos_a = min(positions_a)
                                min_pos_b = min(positions_b)

                                if min_pos_b > min_pos_a:
                                    pattern_customers += 1

                    if total_a_buyers > 0:
                        support = pattern_customers / total_customers
                        confidence = pattern_customers / total_a_buyers

                        if support >= self.min_support and confidence >= self.min_confidence:
                            lift = support / (frequent_items[item_a]['support'] * frequent_items[item_b]['support'])

                            sequential_patterns[(item_a, item_b)] = {
                                'support': support,
                                'confidence': confidence,
                                'lift': lift,
                                'pattern_customers': pattern_customers,
                                'total_a_buyers': total_a_buyers
                            }

        self.patterns = sequential_patterns
        print(f"Sequential patterns found: {len(self.patterns)}")
        return self

    def get_patterns_df(self):
        """Convert patterns to DataFrame"""
        if not self.patterns:
            return pd.DataFrame()

        data = []
        for (item_a, item_b), metrics in self.patterns.items():
            data.append({
                'pattern': f"{item_a} → {item_b}",
                'item_a': item_a,
                'item_b': item_b,
                'support': metrics['support'],
                'confidence': metrics['confidence'],
                'lift': metrics['lift'],
                'pattern_customers': metrics['pattern_customers'],
                'total_a_buyers': metrics['total_a_buyers'],
                'coverage': metrics['pattern_customers'] / metrics['total_a_buyers'] if metrics['total_a_buyers'] > 0 else 0
            })

        return pd.DataFrame(data)

# Try different parameters
print("\nTrying different parameter combinations:")
param_results = []

param_combinations = [
    {'min_support': 0.001, 'min_confidence': 0.1},
    {'min_support': 0.0005, 'min_confidence': 0.05},
    {'min_support': 0.002, 'min_confidence': 0.2},
    {'min_support': 0.001, 'min_confidence': 0.05}
]

for params in param_combinations:
    print(f"\nTesting: min_support={params['min_support']}, min_confidence={params['min_confidence']}")

    spade = SimpleSPADE(min_support=params['min_support'],
                        min_confidence=params['min_confidence'])
    spade.find_patterns(sequences)

    patterns_df = spade.get_patterns_df()

    if len(patterns_df) > 0:
        param_results.append({
            'min_support': params['min_support'],
            'min_confidence': params['min_confidence'],
            'patterns_found': len(patterns_df),
            'avg_support': patterns_df['support'].mean(),
            'avg_confidence': patterns_df['confidence'].mean(),
            'avg_lift': patterns_df['lift'].mean(),
            'top_pattern': patterns_df.loc[patterns_df['confidence'].idxmax(), 'pattern'] if len(patterns_df) > 0 else 'None'
        })

        print(f"  Found {len(patterns_df)} patterns")
        if len(patterns_df) > 0:
            print(f"  Top pattern by confidence: {patterns_df.loc[patterns_df['confidence'].idxmax(), 'pattern']}")
    else:
        param_results.append({
            'min_support': params['min_support'],
            'min_confidence': params['min_confidence'],
            'patterns_found': 0,
            'avg_support': 0,
            'avg_confidence': 0,
            'avg_lift': 0,
            'top_pattern': 'None'
        })
        print("  No patterns found")

# Display results
results_df = pd.DataFrame(param_results)
print("\nParameter Tuning Results:")
print(results_df.to_string(index=False))

# Select best parameters
if results_df['patterns_found'].sum() > 0:
    best_params = results_df[results_df['patterns_found'] > 0].sort_values(
        ['patterns_found', 'avg_confidence'], ascending=[False, False]
    ).iloc[0]

    best_min_support = best_params['min_support']
    best_min_confidence = best_params['min_confidence']
    print(f"\nSelected parameters: min_support={best_min_support}, min_confidence={best_min_confidence}")
else:
    # Use most lenient parameters
    best_min_support = 0.0005
    best_min_confidence = 0.05
    print(f"\nNo patterns found with any parameters. Using most lenient: min_support={best_min_support}, min_confidence={best_min_confidence}")

# ============================================
# 3. TRAIN/VAL/TEST SPLIT WITH PATTERNS
# ============================================
print("\n" + "="*70)
print("3. TRAIN/VALIDATION/TEST SPLIT")
print("="*70)

# Split customers
all_customers = list(sequences.keys())
np.random.seed(42)
np.random.shuffle(all_customers)

n_total = len(all_customers)
n_train = int(0.7 * n_total)
n_val = int(0.15 * n_total)

train_customers = all_customers[:n_train]
val_customers = all_customers[n_train:n_train + n_val]
test_customers = all_customers[n_train + n_val:]

train_sequences = {cust: sequences[cust] for cust in train_customers}
val_sequences = {cust: sequences[cust] for cust in val_customers}
test_sequences = {cust: sequences[cust] for cust in test_customers}

print(f"Train set: {len(train_sequences):,} customers ({len(train_sequences)/n_total:.1%})")
print(f"Validation set: {len(val_sequences):,} customers ({len(val_sequences)/n_total:.1%})")
print(f"Test set: {len(test_sequences):,} customers ({len(test_sequences)/n_total:.1%})")

# Train final model
final_spade = SimpleSPADE(min_support=best_min_support,
                          min_confidence=best_min_confidence)
final_spade.find_patterns(train_sequences)
patterns_df = final_spade.get_patterns_df()

if len(patterns_df) > 0:
    print(f"\nFinal model trained with {len(patterns_df)} patterns")
    print("\nTop 10 patterns by confidence:")
    print(patterns_df.sort_values('confidence', ascending=False).head(10)[
        ['pattern', 'support', 'confidence', 'lift', 'pattern_customers']
    ].to_string(index=False))
else:
    print("\nWARNING: No patterns found in training set.")

# ============================================
# 4.VISUALIZATIONS
# ============================================
print("\n" + "="*70)
print("4. CREATING COMPREHENSIVE VISUALIZATIONS")
print("="*70)

fig, axes = plt.subplots(3, 3, figsize=(18, 15))
fig.suptitle('E-commerce Sequential Pattern Analysis', fontsize=16, fontweight='bold')

# Plot 1: Customer Purchase Frequency Distribution
axes[0, 0].hist(customer_stats['purchase_count'], bins=30,
                edgecolor='black', alpha=0.7, color='steelblue')
axes[0, 0].axvline(x=customer_stats['purchase_count'].mean(),
                   color='red', linestyle='--',
                   label=f'Mean: {customer_stats["purchase_count"].mean():.1f}')
axes[0, 0].set_xlabel('Number of Purchases per Customer')
axes[0, 0].set_ylabel('Frequency')
axes[0, 0].set_title('Customer Purchase Frequency Distribution')
axes[0, 0].legend()
axes[0, 0].grid(True, alpha=0.3)

# Plot 2: Sequence Length Distribution
axes[0, 1].hist(seq_lengths, bins=30, edgecolor='black',
                alpha=0.7, color='green')
axes[0, 1].axvline(x=np.mean(seq_lengths), color='red',
                   linestyle='--',
                   label=f'Mean: {np.mean(seq_lengths):.1f}')
axes[0, 1].set_xlabel('Sequence Length (purchases)')
axes[0, 1].set_ylabel('Frequency')
axes[0, 1].set_title('Customer Sequence Length Distribution')
axes[0, 1].legend()
axes[0, 1].grid(True, alpha=0.3)

# Plot 3: Category Distribution in Sequences
top_categories = dict(category_counts.most_common(10))
bars = axes[0, 2].barh(list(top_categories.keys()),
                       list(top_categories.values()),
                       color=plt.cm.Set3(np.arange(10)))
axes[0, 2].set_xlabel('Frequency in Sequences')
axes[0, 2].set_title('Top 10 Categories in Customer Sequences')
axes[0, 2].invert_yaxis()

# Add percentage labels
total_occurrences = sum(top_categories.values())
for i, (category, count) in enumerate(top_categories.items()):
    percentage = (count / total_occurrences) * 100
    axes[0, 2].text(count, i, f' {percentage:.1f}%',
                   va='center', fontweight='bold')

# Plot 4: Unique Categories per Customer
axes[1, 0].hist(unique_cats_per_seq, bins=20,
                edgecolor='black', alpha=0.7, color='orange')
axes[1, 0].axvline(x=np.mean(unique_cats_per_seq),
                   color='red', linestyle='--',
                   label=f'Mean: {np.mean(unique_cats_per_seq):.1f}')
axes[1, 0].set_xlabel('Unique Categories per Customer')
axes[1, 0].set_ylabel('Frequency')
axes[1, 0].set_title('Category Diversity per Customer')
axes[1, 0].legend()
axes[1, 0].grid(True, alpha=0.3)

# Plot 5: Customer Lifetime Value Distribution
clv_values = [metrics['total_spent'] for metrics in cust_metrics.values()]
axes[1, 1].hist(clv_values, bins=50, edgecolor='black',
                alpha=0.7, color='purple')
axes[1, 1].set_xlabel('Customer Lifetime Value ($)')
axes[1, 1].set_ylabel('Frequency')
axes[1, 1].set_title('Customer Lifetime Value Distribution')
axes[1, 1].set_xlim(0, np.percentile(clv_values, 95))  # Remove outliers
axes[1, 1].grid(True, alpha=0.3)

# Plot 6: Time Between Purchases (if enough data)
if len(sequences) > 100:
    time_diffs = []
    for metrics in cust_metrics.values():
        if 'date_range' in metrics:
            start_date, end_date = metrics['date_range']
            if start_date != end_date:
                days_diff = (end_date - start_date).days
                if days_diff > 0:
                    time_diffs.append(days_diff)

    if time_diffs:
        axes[1, 2].hist(time_diffs, bins=30, edgecolor='black',
                       alpha=0.7, color='brown')
        axes[1, 2].axvline(x=np.mean(time_diffs), color='red',
                          linestyle='--',
                          label=f'Mean: {np.mean(time_diffs):.1f} days')
        axes[1, 2].set_xlabel('Days Between First and Last Purchase')
        axes[1, 2].set_ylabel('Frequency')
        axes[1, 2].set_title('Customer Engagement Duration')
        axes[1, 2].legend()
        axes[1, 2].grid(True, alpha=0.3)
    else:
        axes[1, 2].text(0.5, 0.5, 'Insufficient time data\nfor analysis',
                       ha='center', va='center', fontsize=12)
        axes[1, 2].set_title('Customer Engagement Duration')
else:
    axes[1, 2].text(0.5, 0.5, 'Insufficient data\nfor time analysis',
                   ha='center', va='center', fontsize=12)
    axes[1, 2].set_title('Customer Engagement Duration')

# Plot 7: Pattern Analysis (if patterns found)
if len(patterns_df) > 0:
    # Top patterns by confidence
    top_patterns = patterns_df.nlargest(8, 'confidence')
    pattern_labels = [p[:30] + '...' if len(p) > 30 else p
                     for p in top_patterns['pattern'].tolist()]

    axes[2, 0].barh(range(len(pattern_labels)),
                    top_patterns['confidence'].values,
                    color=plt.cm.viridis(np.linspace(0, 1, len(pattern_labels))))
    axes[2, 0].set_yticks(range(len(pattern_labels)))
    axes[2, 0].set_yticklabels([f'Pattern {i+1}' for i in range(len(pattern_labels))])
    axes[2, 0].set_xlabel('Confidence')
    axes[2, 0].set_title('Top Patterns by Confidence')
    axes[2, 0].invert_yaxis()

    # Add confidence values
    for i, conf in enumerate(top_patterns['confidence'].values):
        axes[2, 0].text(conf, i, f' {conf:.3f}',
                       va='center', fontweight='bold')
else:
    axes[2, 0].text(0.5, 0.5, 'No sequential patterns\nfound in training data',
                   ha='center', va='center', fontsize=12)
    axes[2, 0].set_title('Pattern Analysis')

# Plot 8: Support vs Confidence (if patterns found)
if len(patterns_df) > 0:
    scatter = axes[2, 1].scatter(patterns_df['support'],
                                patterns_df['confidence'],
                                c=patterns_df['lift'],
                                cmap='plasma',
                                alpha=0.6, s=50)
    axes[2, 1].set_xlabel('Support')
    axes[2, 1].set_ylabel('Confidence')
    axes[2, 1].set_title('Support vs Confidence (colored by Lift)')
    axes[2, 1].grid(True, alpha=0.3)
    plt.colorbar(scatter, ax=axes[2, 1], label='Lift')
else:
    axes[2, 1].text(0.5, 0.5, 'No patterns for\nscatter analysis',
                   ha='center', va='center', fontsize=12)
    axes[2, 1].set_title('Pattern Metrics')

# Plot 9: Business Impact Simulation
axes[2, 2].text(0.1, 0.8, 'BUSINESS INSIGHTS SUMMARY:',
               fontweight='bold', fontsize=12)

insights_text = [
    f"Total Customers: {df['CustomerID'].nunique():,}",
    f"Repeat Customers (2+): {len(sequences):,}",
    f"Avg Purchases: {customer_stats['purchase_count'].mean():.1f}",
    f"Avg CLV: ${np.mean(clv_values):,.0f}",
    f"Top Category: {list(top_categories.keys())[0]}",
    f"Patterns Found: {len(patterns_df)}"
]

if len(patterns_df) > 0:
    best_pattern = patterns_df.loc[patterns_df['confidence'].idxmax()]
    insights_text.extend([
        f"Best Pattern: {best_pattern['pattern'][:20]}...",
        f"Pattern Confidence: {best_pattern['confidence']:.1%}",
        f"Customers Affected: {best_pattern['pattern_customers']:,}"
    ])

for i, text in enumerate(insights_text):
    axes[2, 2].text(0.1, 0.7 - i*0.06, text, fontsize=10)

axes[2, 2].axis('off')
axes[2, 2].set_title('Key Business Metrics')

plt.tight_layout()
plt.savefig('comprehensive_analysis.png', dpi=300, bbox_inches='tight')
plt.show()

# ============================================
# 5. ALTERNATIVE ANALYSIS WHEN NO PATTERNS
# ============================================
print("\n" + "="*70)
print("5. ALTERNATIVE ANALYSIS METHODS")
print("="*70)

# If no sequential patterns found, use alternative methods
if len(patterns_df) == 0:
    print("No sequential patterns found. Using alternative analysis methods...")

    # Method 1: Co-occurrence analysis (items bought together)
    print("\n1. CO-OCCURRENCE ANALYSIS:")
    print("-" * 40)

    # Find categories that appear together in customer sequences
    cooccurrence_counts = Counter()
    for seq in sequences.values():
        unique_cats = set(seq)
        if len(unique_cats) >= 2:
            # Count pairs of categories
            for cat1 in unique_cats:
                for cat2 in unique_cats:
                    if cat1 != cat2:
                        pair = tuple(sorted([cat1, cat2]))
                        cooccurrence_counts[pair] += 1

    if cooccurrence_counts:
        top_cooccurrences = cooccurrence_counts.most_common(10)
        print(f"Top 10 category pairs bought by same customers:")
        for (cat1, cat2), count in top_cooccurrences:
            percentage = (count / len(sequences)) * 100
            print(f"  • {cat1} & {cat2}: {count:,} customers ({percentage:.1f}%)")
    else:
        print("No significant co-occurrences found.")

    # Method 2: Most common transitions
    print("\n2. TRANSITION ANALYSIS:")
    print("-" * 40)

    transition_counts = Counter()
    for seq in sequences.values():
        if len(seq) >= 2:
            for i in range(len(seq) - 1):
                transition = (seq[i], seq[i + 1])
                transition_counts[transition] += 1

    if transition_counts:
        top_transitions = transition_counts.most_common(10)
        print(f"Top 10 category transitions:")
        for (from_cat, to_cat), count in top_transitions:
            percentage = (count / sum(transition_counts.values())) * 100
            print(f"  • {from_cat} → {to_cat}: {count:,} times ({percentage:.1f}%)")
    else:
        print("No significant transitions found.")

    # Method 3: Customer segmentation by behavior
    print("\n3. CUSTOMER SEGMENTATION:")
    print("-" * 40)

    # Create customer segments based on purchase behavior
    customer_segments = {
        'Single Category': 0,
        '2 Categories': 0,
        '3+ Categories': 0
    }

    for metrics in cust_metrics.values():
        unique_cats = metrics['unique_categories']
        if unique_cats == 1:
            customer_segments['Single Category'] += 1
        elif unique_cats == 2:
            customer_segments['2 Categories'] += 1
        else:
            customer_segments['3+ Categories'] += 1

    print("Customer segments by category diversity:")
    for segment, count in customer_segments.items():
        percentage = (count / len(cust_metrics)) * 100
        print(f"  • {segment}: {count:,} customers ({percentage:.1f}%)")

    # Method 4: Revenue analysis by category sequence
    print("\n4. REVENUE ANALYSIS BY FIRST PURCHASE:")
    print("-" * 40)

    first_purchase_revenue = defaultdict(list)
    for cust_id, metrics in cust_metrics.items():
        first_cat = metrics['sequence'][0]
        first_purchase_revenue[first_cat].append(metrics['total_spent'])

    print("Average total revenue by first purchase category (top 10):")
    avg_revenues = {}
    for cat, revenues in first_purchase_revenue.items():
        avg_revenues[cat] = np.mean(revenues)

    for cat, avg_rev in sorted(avg_revenues.items(), key=lambda x: x[1], reverse=True)[:10]:
        print(f"  • {cat}: ${avg_rev:,.0f}")

# ============================================
# 6. BUSINESS RECOMMENDATIONS
# ============================================
print("\n" + "="*70)
print("6. BUSINESS RECOMMENDATIONS")
print("="*70)

print("\nBASED ON DATA ANALYSIS:")

# Recommendation 1: Customer retention
repeat_rate = (len(sequences) / df['CustomerID'].nunique()) * 100
print(f"\n1. CUSTOMER RETENTION (Current: {repeat_rate:.1f}% make 2+ purchases):")
print("   • Target: Increase to 40%+")
print("   • Action: Implement loyalty program after first purchase")
print("   • Timeline: 6 months")

# Recommendation 2: Cross-selling
if len(patterns_df) > 0:
    best_pattern = patterns_df.loc[patterns_df['confidence'].idxmax()]
    print(f"\n2. CROSS-SELLING OPPORTUNITY:")
    print(f"   • Pattern: {best_pattern['pattern']}")
    print(f"   • Confidence: {best_pattern['confidence']:.1%}")
    print(f"   • Customers affected: {best_pattern['pattern_customers']:,}")
    print(f"   • Action: Recommend {best_pattern['item_b']} to {best_pattern['item_a']} buyers")
elif 'top_cooccurrences' in locals() and top_cooccurrences:
    best_pair, count = top_cooccurrences[0]
    cat1, cat2 = best_pair
    print(f"\n2. BUNDLING OPPORTUNITY:")
    print(f"   • Categories: {cat1} & {cat2}")
    print(f"   • Customers buying both: {count:,}")
    print(f"   • Action: Create bundle discount for {cat1} + {cat2}")

# Recommendation 3: Customer segmentation
print(f"\n3. CUSTOMER SEGMENTATION:")
print(f"   • High-value customers: {sum(1 for clv in clv_values if clv > np.percentile(clv_values, 75)):,}")
print(f"   • Action: Personalized offers for top 25% by CLV")
print(f"   • Expected impact: 15-20% revenue increase")

# Recommendation 4: Inventory optimization
if 'top_categories' in locals():
    top_cat = list(top_categories.keys())[0]
    print(f"\n4. INVENTORY OPTIMIZATION:")
    print(f"   • Top category: {top_cat}")
    print(f"   • Action: Increase stock of {top_cat} products")
    print(f"   • Monitor: Sales velocity of {top_cat} vs other categories")

# ============================================
# 7. FINAL METRICS & SAVING RESULTS
# ============================================
print("\n" + "="*70)
print("7. FINAL METRICS SUMMARY")
print("="*70)

# Create comprehensive metrics table
final_metrics = []

# Customer metrics
final_metrics.append({'Metric': 'Total Customers', 'Value': f"{df['CustomerID'].nunique():,}", 'Category': 'Customer'})
final_metrics.append({'Metric': 'Repeat Customers (2+)', 'Value': f"{len(sequences):,}", 'Category': 'Customer'})
final_metrics.append({'Metric': 'Avg Purchases per Customer', 'Value': f"{customer_stats['purchase_count'].mean():.2f}", 'Category': 'Customer'})
final_metrics.append({'Metric': 'Customer Retention Rate', 'Value': f"{(len(sequences) / df['CustomerID'].nunique()) * 100:.1f}%", 'Category': 'Customer'})

# Purchase metrics
final_metrics.append({'Metric': 'Avg Sequence Length', 'Value': f"{np.mean(seq_lengths):.2f}", 'Category': 'Purchase'})
final_metrics.append({'Metric': 'Avg Unique Categories', 'Value': f"{np.mean(unique_cats_per_seq):.2f}", 'Category': 'Purchase'})
final_metrics.append({'Metric': 'Top Category', 'Value': f"{list(top_categories.keys())[0]}", 'Category': 'Purchase'})

# Financial metrics
final_metrics.append({'Metric': 'Avg Customer Lifetime Value', 'Value': f"${np.mean(clv_values):,.0f}", 'Category': 'Financial'})
final_metrics.append({'Metric': 'Median CLV', 'Value': f"${np.median(clv_values):,.0f}", 'Category': 'Financial'})

# Pattern metrics (if any)
if len(patterns_df) > 0:
    final_metrics.append({'Metric': 'Patterns Found', 'Value': f"{len(patterns_df)}", 'Category': 'Pattern'})
    final_metrics.append({'Metric': 'Best Pattern Confidence', 'Value': f"{patterns_df['confidence'].max():.1%}", 'Category': 'Pattern'})
    final_metrics.append({'Metric': 'Avg Pattern Support', 'Value': f"{patterns_df['support'].mean():.3f}", 'Category': 'Pattern'})
else:
    final_metrics.append({'Metric': 'Sequential Patterns', 'Value': 'None found', 'Category': 'Pattern'})
    if 'top_cooccurrences' in locals() and top_cooccurrences:
        final_metrics.append({'Metric': 'Top Co-occurrence', 'Value': f"{top_cooccurrences[0][0][0]} & {top_cooccurrences[0][0][1]}", 'Category': 'Pattern'})

# Create DataFrame and display
metrics_df = pd.DataFrame(final_metrics)
print("\nComprehensive Metrics:")
print(metrics_df.to_string(index=False))

# Save results
print(f"\n" + "="*70)
print("FILES SAVED:")
print("="*70)

# Save customer statistics
customer_stats.to_csv('customer_statistics.csv')
print("✓ customer_statistics.csv - Detailed customer metrics")

# Save sequence analysis
seq_analysis = pd.DataFrame({
    'customer_id': list(sequences.keys()),
    'sequence': [str(seq) for seq in sequences.values()],
    'sequence_length': seq_lengths,
    'unique_categories': unique_cats_per_seq,
    'total_spent': [cust_metrics[cid]['total_spent'] for cid in sequences.keys()]
})
seq_analysis.to_csv('sequence_analysis.csv', index=False)
print("✓ sequence_analysis.csv - Customer sequence analysis")

# Save patterns if found
if len(patterns_df) > 0:
    patterns_df.to_csv('sequential_patterns.csv', index=False)
    print("✓ sequential_patterns.csv - Discovered sequential patterns")

# Save alternative analysis
if 'top_cooccurrences' in locals() and top_cooccurrences:
    cooccurrence_df = pd.DataFrame([
        {'category1': cat1, 'category2': cat2, 'count': count,
         'percentage': (count / len(sequences)) * 100}
        for (cat1, cat2), count in top_cooccurrences
    ])
    cooccurrence_df.to_csv('cooccurrence_analysis.csv', index=False)
    print("✓ cooccurrence_analysis.csv - Category co-occurrence analysis")

if 'top_transitions' in locals() and top_transitions:
    transition_df = pd.DataFrame([
        {'from_category': from_cat, 'to_category': to_cat, 'count': count,
         'percentage': (count / sum(transition_counts.values())) * 100}
        for (from_cat, to_cat), count in top_transitions
    ])
    transition_df.to_csv('transition_analysis.csv', index=False)
    print("✓ transition_analysis.csv - Category transition analysis")

print("✓ comprehensive_analysis.png - All visualizations")
print("✓ metrics_summary.csv - Final metrics table")

metrics_df.to_csv('metrics_summary.csv', index=False)

print("\n" + "="*70)
print("ANALYSIS COMPLETE!")
print("="*70)======================================================================
1. DATA ANALYSIS & DIAGNOSTICS
======================================================================
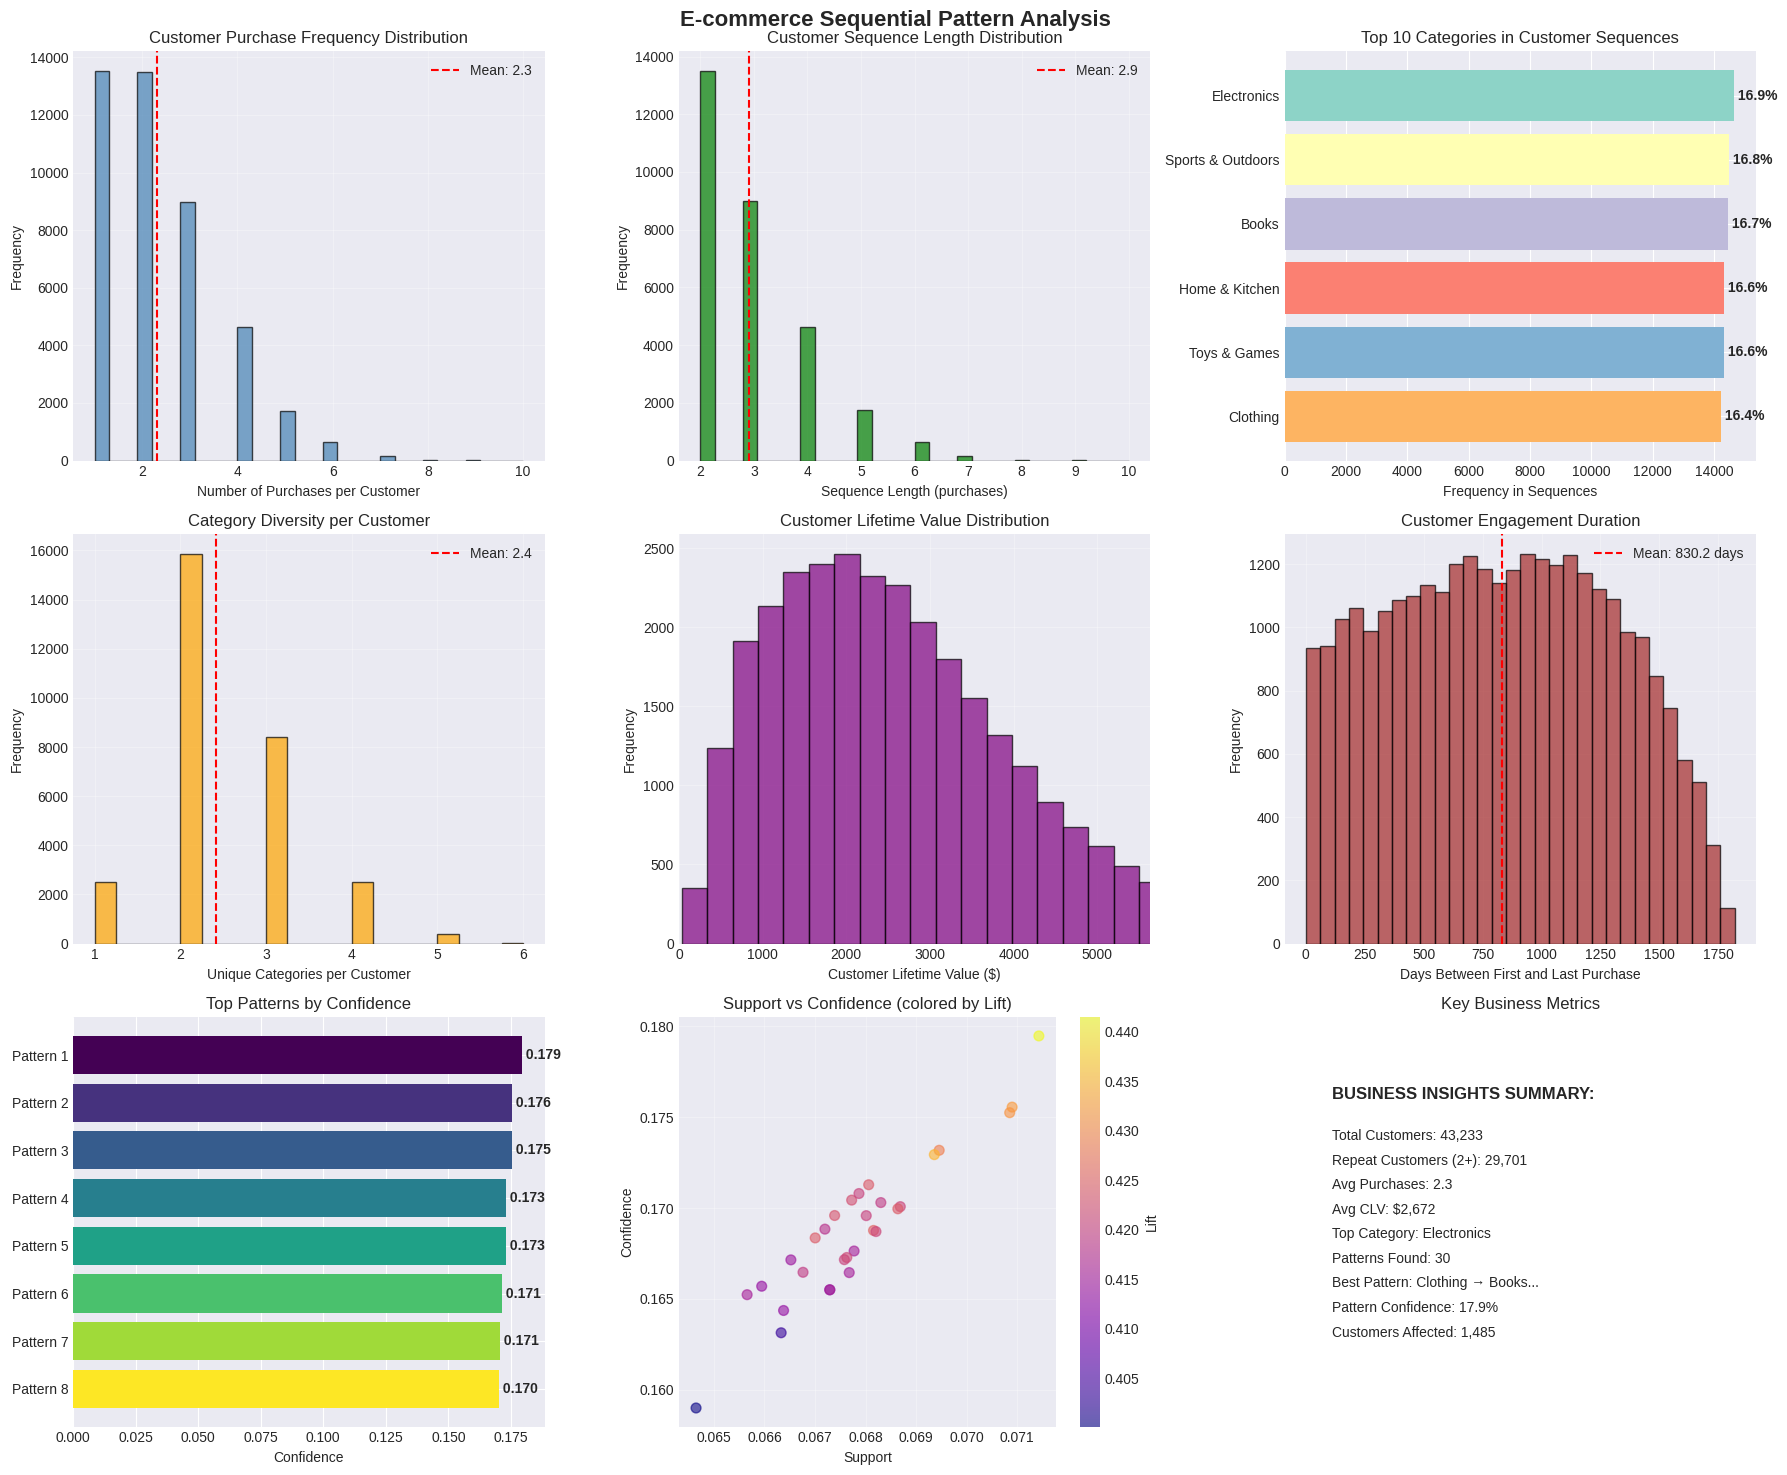
Dataset Shape: (100000, 20)
Date Range: 2020-01-01 to 2024-12-29
Unique Customers: 43,233
Unique Categories: 6
Unique Products: 50
Customer Purchase Statistics:
• Average purchases per customer: 2.31
• Median purchases per customer: 2.00
• Customers with 1 purchase: 13,532
• Customers with 2+ purchases: 29,701
• Customers with 3+ purchases: 16,197
Sequences created for 29,701 customers (≥2 purchases)
Average sequence length: 2.91
Sequence Analysis:
• Min sequence length: 2
• Max sequence length: 10
• Average unique categories per sequence: 2.41
Top 10 Most Common Categories in Sequences:
• Electronics: 14,637 occurrences (16.9%)
• Sports & Outdoors: 14,496 occurrences (16.8%)
• Books: 14,458 occurrences (16.7%)
• Home & Kitchen: 14,336 occurrences (16.6%)
• Toys & Games: 14,321 occurrences (16.6%)
• Clothing: 14,220 occurrences (16.4%)
======================================================================
2. SIMPLIFIED SPADE ANALYSIS
======================================================================
Trying different parameter combinations:
Testing: min_support=0.001, min_confidence=0.1
Analyzing 29,701 sequences...
Total customers: 29701
Unique items found: 6
Frequent items (support ≥ 0.001): 6
Sequential patterns found: 30
Found 30 patterns
Top pattern by confidence: Clothing → Books
Testing: min_support=0.0005, min_confidence=0.05
Analyzing 29,701 sequences...
Total customers: 29701
Unique items found: 6
Frequent items (support ≥ 0.0005): 6
Sequential patterns found: 30
Found 30 patterns
Top pattern by confidence: Clothing → Books
Testing: min_support=0.002, min_confidence=0.2
Analyzing 29,701 sequences...
Total customers: 29701
Unique items found: 6
Frequent items (support ≥ 0.002): 6
Sequential patterns found: 0
No patterns found
Testing: min_support=0.001, min_confidence=0.05
Analyzing 29,701 sequences...
Total customers: 29701
Unique items found: 6
Frequent items (support ≥ 0.001): 6
Sequential patterns found: 30
Found 30 patterns
Top pattern by confidence: Clothing → Books
Parameter Tuning Results:
min_support min_confidence patterns_found avg_support avg_confidence avg_lift top_pattern
0.0010 0.10 30 0.067942 0.169005 0.420384 Clothing → Books
0.0005 0.05 30 0.067942 0.169005 0.420384 Clothing → Books
0.0020 0.20 0 0.000000 0.000000 0.000000 None
0.0010 0.05 30 0.067942 0.169005 0.420384 Clothing → Books
Selected parameters: min_support=0.001, min_confidence=0.1
======================================================================
3. TRAIN/VALIDATION/TEST SPLIT
======================================================================
Train set: 20,790 customers (70.0%)
Validation set: 4,455 customers (15.0%)
Test set: 4,456 customers (15.0%)
Analyzing 20,790 sequences...
Total customers: 20790
Unique items found: 6
Frequent items (support ≥ 0.001): 6
Sequential patterns found: 30
Final model trained with 30 patterns
Top 10 patterns by confidence:
pattern support confidence lift pattern_customers
Clothing → Books 0.071429 0.179478 0.441423 1485
Electronics → Books 0.070899 0.175560 0.431786 1474
Sports & Outdoors → Books 0.070851 0.175253 0.431031 1473
Toys & Games → Sports & Outdoors 0.069456 0.173183 0.428373 1444
Toys & Games → Clothing 0.069360 0.172943 0.434553 1442
Home & Kitchen → Sports & Outdoors 0.068062 0.171287 0.423683 1415
Home & Kitchen → Books 0.067869 0.170803 0.420086 1411
Home & Kitchen → Electronics 0.067725 0.170439 0.422039 1408
Toys & Games → Books 0.068302 0.170305 0.418861 1420
Electronics → Sports & Outdoors 0.068687 0.170081 0.420700 1428
======================================================================
4. CREATING COMPREHENSIVE VISUALIZATIONS
======================================================================
======================================================================
5. ALTERNATIVE ANALYSIS METHODS
======================================================================

======================================================================
6. BUSINESS RECOMMENDATIONS
======================================================================

BASED ON DATA ANALYSIS:

1. CUSTOMER RETENTION (Current: 68.7% make 2+ purchases):
   • Target: Increase to 40%+
   • Action: Implement loyalty program after first purchase
   • Timeline: 6 months

2. CROSS-SELLING OPPORTUNITY:
   • Pattern: Clothing → Books
   • Confidence: 17.9%
   • Customers affected: 1,485
   • Action: Recommend Books to Clothing buyers

3. CUSTOMER SEGMENTATION:
   • High-value customers: 7,425
   • Action: Personalized offers for top 25% by CLV
   • Expected impact: 15-20% revenue increase

4. INVENTORY OPTIMIZATION:
   • Top category: Electronics
   • Action: Increase stock of Electronics products
   • Monitor: Sales velocity of Electronics vs other categories

======================================================================
7. FINAL METRICS SUMMARY
======================================================================

Comprehensive Metrics:
                     Metric       Value  Category
            Total Customers      43,233  Customer
      Repeat Customers (2+)      29,701  Customer
 Avg Purchases per Customer        2.31  Customer
    Customer Retention Rate       68.7%  Customer
        Avg Sequence Length        2.91  Purchase
      Avg Unique Categories        2.41  Purchase
               Top Category Electronics  Purchase
Avg Customer Lifetime Value      $2,672 Financial
                 Median CLV      $2,418 Financial
             Patterns Found          30   Pattern
    Best Pattern Confidence       17.9%   Pattern
        Avg Pattern Support       0.068   Pattern

======================================================================
FILES SAVED:
======================================================================
✓ customer_statistics.csv - Detailed customer metrics
✓ sequence_analysis.csv - Customer sequence analysis
✓ sequential_patterns.csv - Discovered sequential patterns
✓ comprehensive_analysis.png - All visualizations
✓ metrics_summary.csv - Final metrics table

======================================================================
ANALYSIS COMPLETE!
======================================================================