性能数据采集
Go语言内置了获取程序的运行数据的工具,包括以下两个标准库:
- runtime/pprof:采集工具型应用运行数据进行分析
- net/http/pprof:采集服务型应用运行时数据进行分析
pprof开启后,每隔一段时间(10ms)就会收集下当前的堆栈信息,获取各个函数占用的CPU以及内存资源;最后通过对这些采样数据进行分析,形成一个性能分析报告。
注意,我们只应该在性能测试的时候才在代码中引入pprof。
工具型应用
1. 测试代码
go
// runtime_pprof/main.go
package main

import (
	"flag"
	"fmt"
	"os"
	"runtime/pprof"
	"time"
)

// 一段有问题的代码
func logicCode() {
	var c chan int
	for {
		select {
		case v := <-c:
			fmt.Printf("recv from chan, value:%v\n", v)
		default:
			/*
				这行会影响结果观察
			*/
			// fmt.Println("nothing")
		}
	}
}

func main() {
	var isCPUPprof bool
	var isMemPprof bool

	flag.BoolVar(&isCPUPprof, "cpu", false, "turn cpu pprof on")
	flag.BoolVar(&isMemPprof, "mem", false, "turn mem pprof on")
	flag.Parse()

	if isCPUPprof {
		file, err := os.Create("./cpu2.pprof")
		if err != nil {
			fmt.Printf("create cpu pprof failed, err:%v\n", err)
			return
		}
		// 开启CPU性能分析:
		pprof.StartCPUProfile(file)
		// 停止CPU性能分析:
		defer pprof.StopCPUProfile()
	}
	for i := 0; i < 8; i++ {
		go logicCode()
	}
	time.Sleep(20 * time.Second)
	if isMemPprof {
		file, err := os.Create("./mem.pprof")
		if err != nil {
			fmt.Printf("create mem pprof failed, err:%v\n", err)
			return
		}
		// 记录程序的堆栈信息
		pprof.WriteHeapProfile(file)
		file.Close()
	}
}
shell
go build -o main.exe
#等30秒左右程序会退出,会创建go tool pprof cpu.pprof文件
./main.exe -cpu
2. 命令行交互界面
- 我们使用go工具链里的pprof来分析一下。
shell
$ go tool pprof cpu.pprof- 执行上面的代码会进入交互界面如下:
shell
$ go tool pprof cpu.pprof
File: main.exe
Build ID: D:\goBackend\src\mainTest\pprof-tool\main.exe2025-12-25 16:14:39.1358618 +0800 CST
Type: cpu
Time: 2025-12-25 16:14:54 CST
Duration: 20.11s, Total samples = 158.59s (788.52%)
Entering interactive mode (type "help" for commands, "o" for options)
(pprof)- 我们可以在交互界面输入top3来查看程序中占用CPU前3位的函数:
shell
$ go tool pprof cpu.pprof
File: main.exe
Build ID: D:\goBackend\src\mainTest\pprof-tool\main.exe2025-12-25 16:14:39.1358618 +0800 CST
Type: cpu
Time: 2025-12-25 16:14:54 CST
Duration: 20.11s, Total samples = 158.59s (788.52%)
Entering interactive mode (type "help" for commands, "o" for options)
(pprof) top3
Showing nodes accounting for 157.85s, 99.53% of 158.59s total
Dropped 71 nodes (cum <= 0.79s)
      flat  flat%   sum%        cum   cum%
    66.74s 42.08% 42.08%    129.29s 81.52%  runtime.selectnbrecv
    62.53s 39.43% 81.51%     62.54s 39.44%  runtime.chanrecv
    28.58s 18.02% 99.53%    157.93s 99.58%  main.logicCode
(pprof)
其中:
- flat:当前函数占用CPU的耗时
- flat::当前函数占用CPU的耗时百分比
- sun%:函数占用CPU的耗时累计百分比
- cum:当前函数加上调用当前函数的函数占用CPU的总耗时
- cum%:当前函数加上调用当前函数的函数占用CPU的总耗时百分比
- 最后一列:函数名称
- 我们还可以使用list 函数名命令查看具体的函数分析,例如执行list logicCode查看我们编写的函数的详细分析。
shell
(pprof) list logicCode
Total: 158.59s
ROUTINE ======================== main.logicCode in D:\goBackend\src\mainTest\pprof-tool\main.go
    28.58s    157.93s (flat, cum) 99.58% of Total
         .          .     13:func logicCode() {
         .          .     14:   var c chan int
         .          .     15:   for {
         .          .     16:           select {
    28.58s    157.93s     17:           case v := <-c:
         .          .     18:                   fmt.Printf("recv from chan, value:%v\n", v)
         .          .     19:           default:
         .          .     20:                   // fmt.Println("nothing")
         .          .     21:           }
         .          .     22:   }
(pprof) web
过分析发现大部分CPU资源被17行占用,我们分析出select语句中的default没有内容会导致上面的case v:=<-c:一直执行。我们在default分支添加一行time.Sleep(time.Second)即可。
- 如果打开第20行的打印,就观察不到top列表中有logicCode 函数
shell
$ go tool pprof cpu2.pprof
File: main2.exe
Build ID: D:\goBackend\src\mainTest\pprof-tool\main2.exe2025-12-25 16:18:54.8553047 +0800 CST
Type: cpu
Time: 2025-12-25 16:19:03 CST
Duration: 20.18s, Total samples = 20.79s (103.00%)
Entering interactive mode (type "help" for commands, "o" for options)
(pprof) top
Showing nodes accounting for 19.28s, 92.74% of 20.79s total
Dropped 126 nodes (cum <= 0.10s)
Showing top 10 nodes out of 41
      flat  flat%   sum%        cum   cum%
    17.24s 82.92% 82.92%     17.38s 83.60%  runtime.cgocall
     1.43s  6.88% 89.80%      1.43s  6.88%  runtime.stdcall1
     0.18s  0.87% 90.67%      0.19s  0.91%  runtime.stdcall0
     0.10s  0.48% 91.15%      0.26s  1.25%  runtime.stealWork
     0.08s  0.38% 91.53%     17.68s 85.04%  internal/poll.(*FD).writeConsole
     0.07s  0.34% 91.87%      1.69s  8.13%  runtime.systemstack
     0.05s  0.24% 92.11%      0.12s  0.58%  runtime.semacquire1
     0.05s  0.24% 92.35%      0.47s  2.26%  runtime.semrelease1
     0.04s  0.19% 92.54%     18.43s 88.65%  internal/poll.(*FD).Write
0.04s 0.19% 92.74% 0.53s 2.55% internal/poll.(*FD).writeUnlock- 有
fmt.Println("nothing")的场景
此时default分支执行fmt.Println,这是一个阻塞性系统调用(涉及 IO 输出)。
- CPU 时间主要消耗在系统调用 :
fmt.Println会触发字符串格式化、控制台锁竞争、内核态 IO 写入(如 Windows 的WriteConsole或 Linux 的write系统调用)。这些操作的大部分时间在内核态 或CGO 桥接层 (runtime.cgocall)完成,而非main.logicCode函数本身。 logicCode自身执行时间占比极低 :
循环体仅包含select和一个打印语句,而打印的系统调用耗时远大于select和循环控制的开销。因此,pprof 采样时,系统调用相关函数(如runtime.cgocall、internal/poll.(*FD).writeConsole)会占据绝大多数样本 ,main.logicCode的累计耗时占比极低(可能不足 1%),自然不会出现在 top 列表中。
- 无
fmt.Println("nothing")的场景
此时default分支为空,形成紧密循环(busy loop):
-
CPU 时间几乎全被
logicCode占用 :循环中
select对 nil 通道的处理(空default分支)无任何阻塞操作,导致循环以极致速度重复执行 (每次循环仅需纳秒级时间)。此时,main.logicCode函数独占 CPU,几乎所有采样点都会捕获到它的执行栈。 -
采样结果显示"超高 CPU 占用率" :
由于循环无阻塞,CPU 利用率接近 100%(甚至超过 100%,表示多核并行占用)。pprof 显示的
788.52%意味着采样期间 CPU 几乎全被logicCode的循环消耗,因此main.logicCode成为绝对热点(占比 99.58%)。关键结论:- 有打印时 :
fmt.Println的系统调用开销掩盖了logicCode本身的耗时,pprof 采样聚焦于系统调用函数,main.logicCode因占比过低未进入 top。 - 无打印时 :空循环导致
logicCode独占 CPU,成为采样焦点,因此 top 列表中占比极高。
这一差异本质上反映了 "系统调用密集型" 与 "CPU 密集型" 代码的性能分析特点:前者热点在系统调用,后者热点在函数自身。
- 有打印时 :
服务型应用
例如 web 应用,那么可以使用net/http/pprof库,它能够在提供 HTTP 服务进行分析。
如果使用了默认的http.DefaultServeMux(通常是代码直接使用 http.ListenAndServe("0.0.0.0:8000", nil)),只需要在你的web server端代码中按如下方式导入net/http/pprof
go
import _ "net/http/pprof"如果你使用自定义的 Mux,则需要手动注册一些路由规则:
go
r.HandleFunc("/debug/pprof/", pprof.Index)
r.HandleFunc("/debug/pprof/cmdline", pprof.Cmdline)
r.HandleFunc("/debug/pprof/profile", pprof.Profile)
r.HandleFunc("/debug/pprof/symbol", pprof.Symbol)
r.HandleFunc("/debug/pprof/trace", pprof.Trace)如果你使用的是gin框架,那么推荐使用github.com/gin-contrib/pprof,在代码中通过以下命令注册pprof相关路由。
go
pprof.Register(router)不管哪种方式,你的 HTTP 服务都会多出/debug/pprof endpoint,访问它会得到类似下面的内容:
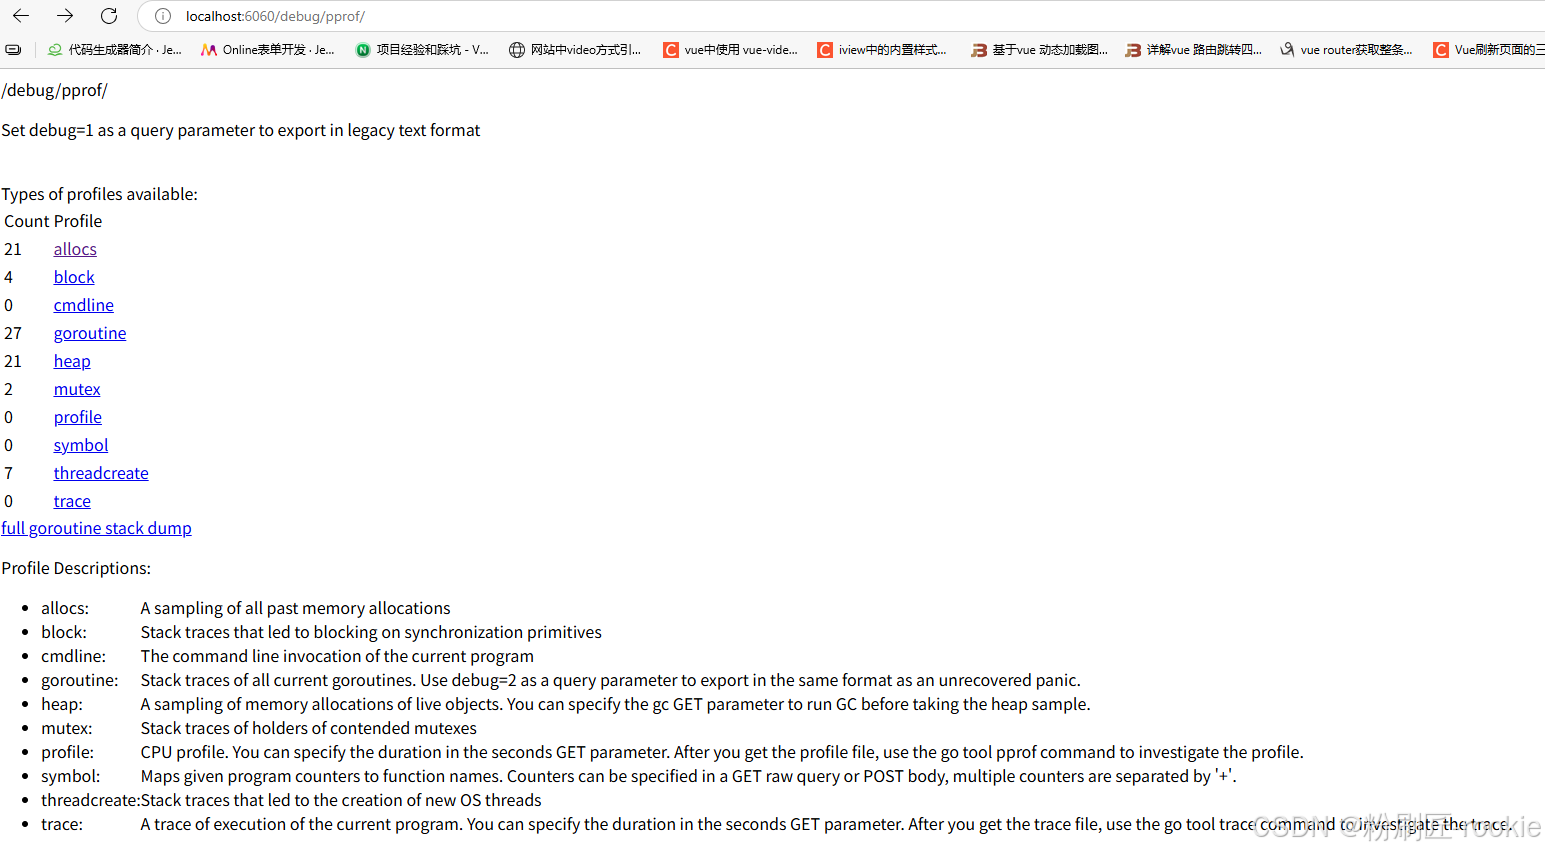
以下是 Go 性能分析(pprof)中各类采样信息的详细说明列表,按类型分类整理:
| 类型 | 描述 | 备注 |
|---|---|---|
| allocs | 内存分配情况的采样信息 | 可用浏览器打开,但可读性不高 |
| blocks | 阻塞操作情况的采样信息(如 channel/锁等待) | 可用浏览器打开,但可读性不高 |
| cmdline | 显示程序启动命令及参数 | 可用浏览器打开,会显示程序启动路径(如 ./go-pprof-practice) |
| goroutine | 当前所有协程的堆栈信息 | 可用浏览器打开,但可读性不高(适合排查协程泄漏) |
| heap | 堆上内存使用情况的采样信息 | 可用浏览器打开,但可读性不高(核心用于分析内存占用/泄漏) |
| mutex | 锁争用情况的采样信息(如 sync.Mutex 竞争) |
可用浏览器打开,但可读性不高 |
| profile | CPU 占用情况的采样信息 | 浏览器打开会下载文件(需用 pprof 工具分析,核心用于定位 CPU 热点) |
| threadcreate | 系统线程创建情况的采样信息 | 可用浏览器打开,但可读性不高 |
| trace | 程序运行跟踪信息(全链路事件记录) | 浏览器打开会下载文件,本文不涉及;可参阅《深入浅出 Go trace》分析执行流程 |
- 使用场景 :
allocs/heap:定位内存分配热点/泄漏;blocks/mutex:分析并发阻塞/锁竞争;cmdline:确认程序启动参数是否正确;threadcreate:排查线程创建过多问题。
这个路径下还有几个子页面:
- /debug/pprof/profile:访问这个链接会自动进行 CPU profiling,持续 30s,并生成一个文件供下载
- /debug/pprof/heap: Memory Profiling 的路径,访问这个链接会得到一个内存 Profiling 结果的文件
- /debug/pprof/block:block Profiling 的路径
- /debug/pprof/goroutines:运行的 goroutines 列表,以及调用关系
go tool pprof命令
不管是工具型应用还是服务型应用,我们使用相应的pprof库获取数据之后,下一步的都要对这些数据进行分析,我们可以使用go tool pprof命令行工具。
go tool pprof最简单的使用方式为:
go
go tool pprof [binary] [source]其中:
- binary 是应用的二进制文件,用来解析各种符号;
- source 表示 profile 数据的来源,可以是本地的文件,也可以是 http 地址。
注意事项: 获取的 Profiling 数据是动态的,要想获得有效的数据,请保证应用处于较大的负载(比如正在生成中运行的服务,或者通过其他工具模拟访问压力)。否则如果应用处于空闲状态,得到的结果可能没有任何意义。
图形化
通过svg图的方式查看程序中详细的CPU占用情况。 想要查看图形化的界面首先需要安装graphviz图形化工具。
- Windows: 下载graphviz 将graphviz安装目录下的bin文件夹添加到Path环境变量中。 在终端输入dot -version查看是否安装成功。
shell
(pprof) web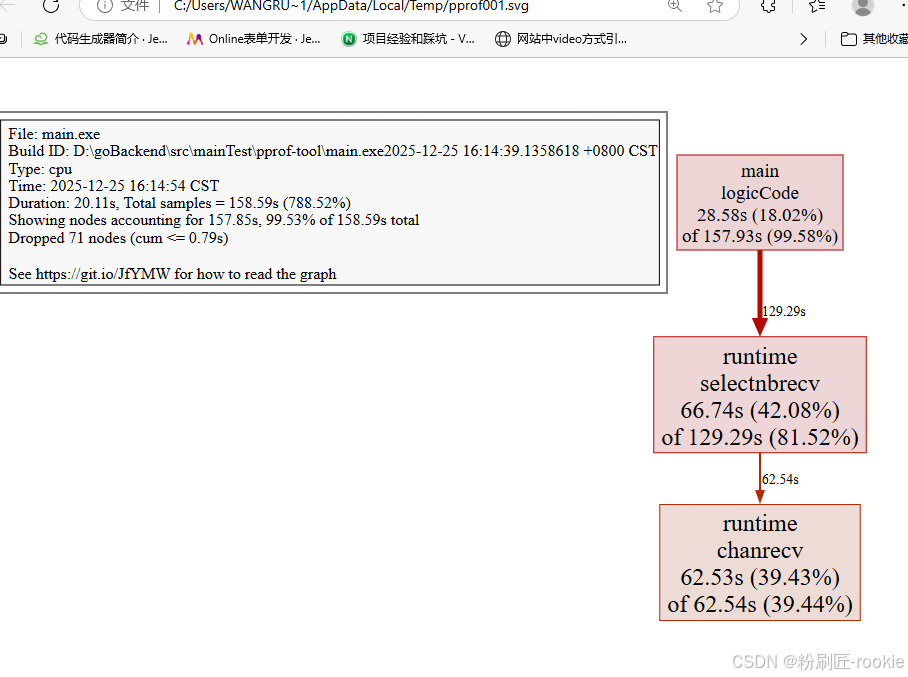
关于图形的说明: 每个框代表一个函数,理论上框的越大表示占用的CPU资源越多。 方框之间的线条代表函数之间的调用关系。 线条上的数字表示函数调用的次数。 方框中的第一行数字表示当前函数占用CPU的百分比,第二行数字表示当前函数累计占用CPU的百分比。
排查内存占用过高
go
func (m *Mouse) Steal() {
	log.Println(m.Name(), "steal")
	max := constant.Gi
	for len(m.buffer)*constant.Mi < max {
		m.buffer = append(m.buffer, [constant.Mi]byte{})
	}
}
shell
wangruolin@DESKTOP-99LNSVB MINGW64 /d/goBackend/src/mainTest/go-pprof-practice (master)
$ go tool pprof http://localhost:6060/debug/pprof/heap
Fetching profile over HTTP from http://localhost:6060/debug/pprof/heap
Saved profile in C:\Users\wangruolin\pprof\pprof.main.exe.alloc_objects.alloc_space.inuse_objects.inuse_space.003.pb.gz
File: main.exe
Build ID: D:\goBackend\src\mainTest\go-pprof-practice\main.exe2025-12-25 14:20:25.4807405 +0800 CST
Type: inuse_space
Time: 2025-12-26 10:54:17 CST
Entering interactive mode (type "help" for commands, "o" for options)
(pprof) top
Showing nodes accounting for 768MB, 99.87% of 769MB total
Dropped 19 nodes (cum <= 3.85MB)
      flat  flat%   sum%        cum   cum%
     768MB 99.87% 99.87%      768MB 99.87%  github.com/wolfogre/go-pprof-practice/animal/muridae/mouse.(*Mouse).Steal
         0     0% 99.87%      768MB 99.87%  github.com/wolfogre/go-pprof-practice/animal/muridae/mouse.(*Mouse).Live
         0     0% 99.87%      768MB 99.87%  main.main
         0     0% 99.87%      768MB 99.87%  runtime.main
(pprof) list Steal
Total: 769MB
ROUTINE ======================== github.com/wolfogre/go-pprof-practice/animal/muridae/mouse.(*Mouse).Steal in D:\goBackend\src\mainTest\go-pprof-practice\animal\muridae\mouse\mouse.go
     768MB      768MB (flat, cum) 99.87% of Total
         .          .     56:func (m *Mouse) Steal() {
         .          .     57:   log.Println(m.Name(), "steal")
         .          .     58:   max := constant.Gi
         .          .     59:   for len(m.buffer)*constant.Mi < max {
     768MB      768MB     60:           m.buffer = append(m.buffer, [constant.Mi]byte{})
         .          .     61:   }
         .          .     62:}
(pprof) web
(pprof) -
inuse_space:分析应用程序的常驻内存占用情况
-
alloc_objects:分析应用程序的内存临时分配情况
可以看到,这里有个循环会一直向 m.buffer 里追加长度为 1 MiB 的数组,直到总容量到达 1 GiB 为止,且一直不释放这些内存,这就难怪会有这么高的内存占用了。

排查频繁内存回收
频繁的 GC 对 golang 程序性能的影响也是非常严重的。虽然现在这个炸弹程序内存使用量并不高,但这会不会是频繁 GC 之后的假象呢?
为了获取程序运行过程中 GC 日志,我们需要先退出炸弹程序,再在重新启动前赋予一个环境变量,同时为了避免其他日志的干扰,使用 grep 筛选出 GC 日志查看:
go
func (m *Mouse) Pee() {
	log.Println(m.Name(), "pee")
	go func() {
		time.Sleep(time.Second * 30)
		max := constant.Gi
		for len(m.slowBuffer)*constant.Mi < max {
			m.slowBuffer = append(m.slowBuffer, [constant.Mi]byte{})
			time.Sleep(time.Millisecond * 500)
		}
	}()
}

func (m *Mouse) Hole() {
	log.Println(m.Name(), "hole")
}

func (m *Mouse) Steal() {
	log.Println(m.Name(), "steal")
	max := constant.Gi
	for len(m.buffer)*constant.Mi < max {
		m.buffer = append(m.buffer, [constant.Mi]byte{})
	}
}
shell
GODEBUG=gctrace=1 ./go-pprof-practice | grep gc
go
wangruolin@DESKTOP-99LNSVB MINGW64 /d/goBackend/src/mainTest/go-pprof-practice (master)
gc 3 @9.934s 0%: 0+2.5+0 ms clock, 0+0/0/0+0 ms cpu, 14->14->12 MB, 14 MB goal, 0 MB stacks, 0 MB globals, 1 P
gc 4 @9.938s 0%: 0+7.5+0 ms clock, 0+1.5/0/0+0 ms cpu, 28->28->24 MB, 28 MB goal, 0 MB stacks, 0 MB globals, 1 P
gc 5 @9.947s 0%: 0+16+0 ms clock, 0+0/0.99/0+0 ms cpu, 56->56->48 MB, 56 MB goal, 0 MB stacks, 0 MB globals, 1 P
gc 6 @9.965s 0%: 0+31+0 ms clock, 0+0/0/0+0 ms cpu, 112->112->96 MB, 112 MB goal, 0 MB stacks, 0 MB globals, 1 P
gc 3 @9.934s 0%: 0+2.5+0 ms clock, 0+0/0/0+0 ms cpu, 14->14->12 MB, 14 MB goal, 0 MB stacks, 0 MB globals, 1 P
obals, 1 P
obals, 1 P
gc 6 @9.965s 0%: 0+31+0 ms clock, 0+0/0/0+0 ms cpu, 112->112->96 MB, 112 MB goal, 0 MB stacks, 0 MB globals, 1 P
B globals, 1 P
gc 8 @10.074s 0%: 0+123+0 ms clock, 0+0/0.50/0+0 ms cpu, 448->448->384 MB, 448 MB goal, 0 MB stacks, 0 MB globals, 1 P
gc 9 @10.209s 0%: 0+251+0 ms clock, 0+0/0/0+0 ms cpu, 896->896->768 MB, 896 MB goal, 0 MB stacks, 0 MB globals, 1 P
gc 10 @10.493s 0%: 0+430+0 ms clock, 0+0/0/0+0 ms cpu, 1600->1600->1344 MB, 1600 MB goal, 0 MB stacks, 0 MB globals, 1 P
gc 11 @41.979s 0%: 0+2.7+0 ms clock, 0+0/0.53/0+0 ms cpu, 2687->2687->1244 MB, 2688 MB goal, 0 MB stacks, 0 MB globals, 1 P
gc 12 @93.066s 0%: 0+245+0 ms clock, 0+0/1.0/0+0 ms cpu, 3212->3212->2576 MB, 3212 MB goal, 0 MB stacks, 0 MB globals, 1 P
可以看到,GC 差不多每 3 秒就发生一次,且每次 GC 都会从 16MB 清理到几乎 0MB,说明程序在不断的申请内存再释放,这是高性能 golang 程序所不允许的。
如果你希望进一步了解 golang 的 GC 日志可以查看《如何监控 golang 程序的垃圾回收》,为保证实验节奏,这里不做展开。
所以接下来使用 pprof 排查时,我们在乎的不是什么地方在占用大量内存,而是什么地方在不停地申请内存,这两者是有区别的。
由于内存的申请与释放频度是需要一段时间来统计的,所有我们保证炸弹程序已经运行了几分钟之后,再运行命令:
shell
go tool pprof http://localhost:6060/debug/pprof/allocs
shell
wrl@DESKTOP-99LNSVB MINGW64 /d/goBackend/src/mainTest/go-pprof-practice (master)
$ go tool pprof http://localhost:6060/debug/pprof/allocs
Fetching profile over HTTP from http://localhost:6060/debug/pprof/allocs
Saved profile in C:\Users\wangruolin\pprof\pprof.main.exe.alloc_objects.alloc_space.inuse_objects.inuse_space.004.pb.gz
File: main.exe
Build ID: D:\goBackend\src\mainTest\go-pprof-practice\main.exe2025-12-25 14:20:25.4807405 +0800 CST
Type: alloc_space
Time: 2025-12-26 11:08:13 CST
Entering interactive mode (type "help" for commands, "o" for options)
(pprof) top
Showing nodes accounting for 6846.39MB, 100% of 6848.39MB total
Dropped 24 nodes (cum <= 34.24MB)
      flat  flat%   sum%        cum   cum%
 3087.20MB 45.08% 45.08%  3087.20MB 45.08%  github.com/wolfogre/go-pprof-practice/animal/muridae/mouse.(*Mouse).Pee.func1
 3087.20MB 45.08% 90.16%  3087.20MB 45.08%  github.com/wolfogre/go-pprof-practice/animal/muridae/mouse.(*Mouse).Steal
     672MB  9.81%   100%      672MB  9.81%  github.com/wolfogre/go-pprof-practice/animal/canidae/dog.(*Dog).Run
         0     0%   100%      672MB  9.81%  github.com/wolfogre/go-pprof-practice/animal/canidae/dog.(*Dog).Live
         0     0%   100%  3087.70MB 45.09%  github.com/wolfogre/go-pprof-practice/animal/muridae/mouse.(*Mouse).Live
         0     0%   100%  3760.20MB 54.91%  main.main
         0     0%   100%  3760.20MB 54.91%  runtime.main
(pprof) list Pee
Total: 6.69GB
ROUTINE ======================== github.com/wolfogre/go-pprof-practice/animal/canidae/wolf.(*Wolf).Pee in D:\goBackend\src\mainTest\go-pprof-practice\animal\canidae\wolf\wolf.go
         0   512.12kB (flat, cum) 0.0073% of Total
         .          .     43:func (w *Wolf) Pee() {
         .   512.12kB     44:   log.Println(w.Name(), "pee")
         .          .     45:}
         .          .     46:
         .          .     47:func (w *Wolf) Run() {
         .          .     48:   log.Println(w.Name(), "run")
         .          .     49:}
ROUTINE ======================== github.com/wolfogre/go-pprof-practiceractice\animal\muridae\mouse\mouse.go
ractice\animal\muridae\mouse\mouse.go
    3.01GB     3.01GB (flat, cum) 45.08% of Total
         .          .     42:   go func() {
ractice\animal\muridae\mouse\mouse.go
ractice\animal\muridae\mouse\mouse.go
    3.01GB     3.01GB (flat, cum) 45.08% of Total
         .          .     42:   go func() {
         .          .     43:           time.Sleep(time.Second * 30)
         .          .     44:           max := constant.Gi
         .          .     45:           for len(m.slowBuffer)*constant.Mi < max {
    3.01GB     3.01GB     46:                   m.slowBuffer = append(m.slowBuffer, [constant.Mi]byte{})
         .          .     47:                   time.Sleep(time.Millisecond * 500)
         .          .     48:           }
         .          .     49:   }()
         .          .     50:}
         .          .     51:
(pprof) web
(pprof)
append在反复扩容,分配内存,会被分配到堆上,如果是栈中不会触发GC
排查协程泄露
go
func (w *Wolf) Drink() {
	log.Println(w.Name(), "drink")
	for i := 0; i < 10; i++ {
		go func() {
			time.Sleep(30 * time.Second)
		}()
	}
}
shell
wrl@DESKTOP-99LNSVB MINGW64 /d/goBackend/src/mainTest/go-pprof-practice (master)
$ go tool pprof http://localhost:6060/debug/pprof/goroutine
Fetching profile over HTTP from http://localhost:6060/debug/pprof/goroutine
Saved profile in C:\Users\wangruolin\pprof\pprof.main.exe.goroutine.002.pb.gz
File: main.exe
Build ID: D:\goBackend\src\mainTest\go-pprof-practice\main.exe2025-12-26 11:15:46.4114122 +0800 CST
Type: goroutine
Time: 2025-12-26 11:20:19 CST
Entering interactive mode (type "help" for commands, "o" for options)
(pprof) top
Showing nodes accounting for 25, 96.15% of 26 total
Showing top 10 nodes out of 45
      flat  flat%   sum%        cum   cum%
        23 88.46% 88.46%         23 88.46%  runtime.gopark
         1  3.85% 92.31%          1  3.85%  runtime.asyncPreempt2
         1  3.85% 96.15%          1  3.85%  runtime.goroutineProfileWithLabels
         0     0% 96.15%          1  3.85%  bufio.(*Reader).Peek
         0     0% 96.15%          1  3.85%  bufio.(*Reader).ReadLine
         0     0% 96.15%          1  3.85%  bufio.(*Reader).ReadSlice
         0     0% 96.15%          2  7.69%  bufio.(*Reader).fill
         0     0% 96.15%         20 76.92%  github.com/wolfogre/go-pprof-practice/animal/canidae/wolf.(*Wolf).Drink.func1
         0     0% 96.15%          1  3.85%  github.com/wolfogre/go-pprof-practice/animal/felidae/tiger.(*Tiger).Eat
         0     0% 96.15%          1  3.85%  github.com/wolfogre/go-pprof-practice/animal/felidae/tiger.(*Tiger).Live
(pprof) list drink
no matches found for regexp: drink
(pprof) list Drink
Total: 26
ROUTINE ======================== github.com/wolfogre/go-pprof-practice/animal/canidae/wolf.(*Wolf).Drink.func1 in D:\goBackend\src\mainTest\go-pprof-practice\animal\canidae\wolf\wolf.go
         0         20 (flat, cum) 76.92% of Total
         .          .     33:           go func() {
         .         20     34:                   time.Sleep(30 * time.Second)
         .          .     35:           }()
         .          .     36:   }
         .          .     37:}
         .          .     38:
         .          .     39:func (w *Wolf) Shit() {
(pprof) web
(pprof) 
排查锁的争用

到目前为止,我们已经解决这个炸弹程序的所有资源占用问题,但是事情还没有完,我们需要进一步排查那些会导致程序运行慢的性能问题,这些问题可能并不会导致资源占用,但会让程序效率低下,这同样是高性能程序所忌讳的。
我们首先想到的就是程序中是否有不合理的锁的争用看看上一张图,显示有两个 mutex 存在争用问题。
go
func (w *Wolf) Howl() {
	log.Println(w.Name(), "howl")

	m := &sync.Mutex{}
	m.Lock()
	go func() {
		time.Sleep(time.Second)
		m.Unlock()
	}()
	m.Lock()
}
shell
$ go tool pprof http://localhost:6060/debug/pprof/mutex
Fetching profile over HTTP from http://localhost:6060/debug/pprof/mutex
Saved profile in C:\Users\wangruolin\pprof\pprof.main.exe.contentions.delay.001.pb.gz
File: main.exe
Build ID: D:\goBackend\src\mainTest\go-pprof-practice\main.exe2025-12-26 11:15:46.4114122 +0800 CST
Type: delay
Time: 2025-12-26 11:38:39 CST
Entering interactive mode (type "help" for commands, "o" for options)
(pprof) top
Showing nodes accounting for 115.30s, 100% of 115.30s total
Dropped 1 node (cum <= 0.58s)
      flat  flat%   sum%        cum   cum%
   115.30s   100%   100%    115.30s   100%  sync.(*Mutex).Unlock (inline)
         0     0%   100%    115.30s   100%  github.com/wolfogre/go-pprof-practice/animal/canidae/wolf.(*Wolf).Howl.func1
(pprof) list Howl
Total: 115.30s
ROUTINE ======================== github.com/wolfogre/go-pprof-practice/animal/canidae/wolf.(*Wolf).Howl.func1 in D:\goBackend\src\mainTest\go-pprof-practice\animal\canidae\wolf\wolf.go
         0    115.30s (flat, cum)   100% of Total
         .          .     56:   go func() {
         .          .     57:           time.Sleep(time.Second)
         .    115.30s     58:           m.Unlock()
         .          .     59:   }()
         .          .     60:   m.Lock()
         .          .     61:}
(pprof) web
(pprof) 
可以看到,这个锁由主协程 Lock,并启动子协程去 Unlock,主协程会阻塞在第二次 Lock 这儿等待子协程完成任务,但由于子协程足足睡眠了一秒,导致主协程等待这个锁释放足足等了一秒钟。虽然这可能是实际的业务需要,逻辑上说得通,并不一定真的是性能瓶颈,但既然它出现在我写的"炸弹"里,就肯定不是什么"业务需要"啦。
排查阻塞操作

go
func (c *Cat) Pee() {
	log.Println(c.Name(), "pee")

	<-time.After(time.Second)
}
shell
$ go tool pprof http://localhost:6060/debug/pprof/block
Fetching profile over HTTP from http://localhost:6060/debug/pprof/block
Saved profile in C:\Users\wangruolin\pprof\pprof.main.exe.contentions.delay.004.pb.gz
File: main.exe
Build ID: D:\goBackend\src\mainTest\go-pprof-practice\main.exe2025-12-26 11:49:38.7526622 +0800 CST
Type: delay
Time: 2025-12-26 11:49:46 CST
Entering interactive mode (type "help" for commands, "o" for options)
(pprof) top
Showing nodes accounting for 1s, 100% of 1s total
      flat  flat%   sum%        cum   cum%
        1s   100%   100%         1s   100%  runtime.chanrecv1
         0     0%   100%         1s   100%  github.com/wolfogre/go-pprof-practice/animal/felidae/cat.(*Cat).Live
         0     0%   100%         1s   100%  github.com/wolfogre/go-pprof-practice/animal/felidae/cat.(*Cat).Pee
         0     0%   100%         1s   100%  main.main
         0     0%   100%         1s   100%  runtime.main
(pprof) list Pee
Total: 1s
ROUTINE ======================== github.com/wolfogre/go-pprof-practice/animal/felidae/cat.(*Cat).Pee in D:\goBackend\src\mainTest\go-pprof-practice\animal\felidae\cat\cat.go
         0         1s (flat, cum)   100% of Total
         .          .     36:func (c *Cat) Pee() {
         .          .     37:   log.Println(c.Name(), "pee")
         .          .     38:
         .         1s     39:   <-time.After(time.Second)
         .          .     40:}
         .          .     41:
         .          .     42:func (c *Cat) Climb() {
         .          .     43:   log.Println(c.Name(), "climb")
         .          .     44:}
火焰图
火焰图(Flame Graph)是 Bredan Gregg 创建的一种性能分析图表,因为它的样子近似 🔥而得名。上面的 profiling 结果也转换成火焰图,如果对火焰图比较了解可以手动来操作。以前提到的go-torch已经废弃,合并到了pprof中,go tool pprof 命令会生成一个profile 文件,会打印一行,类似C:\Users\wrl\pprof\pprof.main.exe.contentions.delay.004.pb.gz
shell
go tool pprof -http=:8081 pprof.main.exe.samples.cpu.005.pb.gz
Serving web UI on http://localhost:8081
上面的命令会自动打开浏览器页面如下,但是好像和以往看见的火焰图不一样了

pprof与性能测试结合
go test命令有两个参数和 pprof 相关,它们分别指定生成的 CPU 和 Memory profiling 保存的文件:
- -cpuprofile:cpu profiling 数据要保存的文件地址
- -memprofile:memory profiling 数据要报文的文件地址
比如下面执行测试的同时,也会执行 CPU profiling,并把结果保存在 cpu.prof 文件中:
go
go test -bench . -cpuprofile=cpu.prof比如下面执行测试的同时,也会执行 Mem profiling,并把结果保存在 cpu.prof 文件中:
go
go test -bench . -memprofile=./mem.prof【参考】:
Go 大杀器之性能剖析 PProf