这个问题困扰我两周,总算找到解决的办法,我看了这个完成了项目,虽说不难吧,但也耗费了很大的精力去做这件事,我一直坚持纯python开发,至于用这个架构原因就不用我多说了,对于和我一样遇到类似的问题,看了这个文章受到启发,解决自己项目难题。
一,地图基础
这个元素是Leaflet JavaScript库的包装器。
-
center: 地图的初始中心位置(纬度/经度,默认值:(0.0, 0.0))
-
zoom: 地图的初始缩放级别(默认值:13)
-
draw_control: 是否显示绘图工具栏(默认值:False)
-
options: 传递给Leaflet地图的其他选项(默认值:{})
python
from nicegui import ui

m = ui.leaflet(center=(51.505, -0.09))
ui.label().bind_text_from(m, 'center', lambda center: f'Center: {center[0]:.3f}, {center[1]:.3f}')
ui.label().bind_text_from(m, 'zoom', lambda zoom: f'Zoom: {zoom}')

with ui.grid(columns=2):
    ui.button('London', on_click=lambda: m.set_center((51.505, -0.090)))
    ui.button('Berlin', on_click=lambda: m.set_center((52.520, 13.405)))
    ui.button(icon='zoom_in', on_click=lambda: m.set_zoom(m.zoom + 1))
    ui.button(icon='zoom_out', on_click=lambda: m.set_zoom(m.zoom - 1))

ui.run()
二、多点经纬度坐标和一点经纬度坐标
默认的地图样式是OpenStreetMap。您可以在 https://leaflet-extras.github.io/leaflet-providers/preview/ 找到更多的地图样式。每次调用tile_layer都会叠加在前面的图层上。因此,如果您想更改地图样式,必须先移除默认的样式。
一点标记
python
from nicegui import events, ui

BEIJING_CENTER = (39.904200, 116.407400)
ui.add_head_html('<style>.nicegui-content { max-width: none !important; padding: 0; }</style>')

with ui.column().classes('w-full p-4 gap-4'):
    m = ui.leaflet(center=BEIJING_CENTER, zoom=10).classes('w-full h-[600px]')
    coord_label = ui.label('点击地图查看坐标').classes('text-lg')

# 用于保存当前标记的引用
current_marker = None

def handle_click(e: events.GenericEventArguments):
    global current_marker

    lat = e.args['latlng']['lat']
    lng = e.args['latlng']['lng']
    lat_rounded = round(lat, 6)
    lng_rounded = round(lng, 6)

    # 如果已有标记,先移除它
    if current_marker is not None:
        m.remove_layer(current_marker)

    # 添加新标记并保存引用
    current_marker = m.marker(latlng=(lat_rounded, lng_rounded))

    coord_label.set_text(f"最新标记位置 → 纬度: {lat_rounded:.6f}, 经度: {lng_rounded:.6f}")

m.on('map-click', handle_click)

ui.run()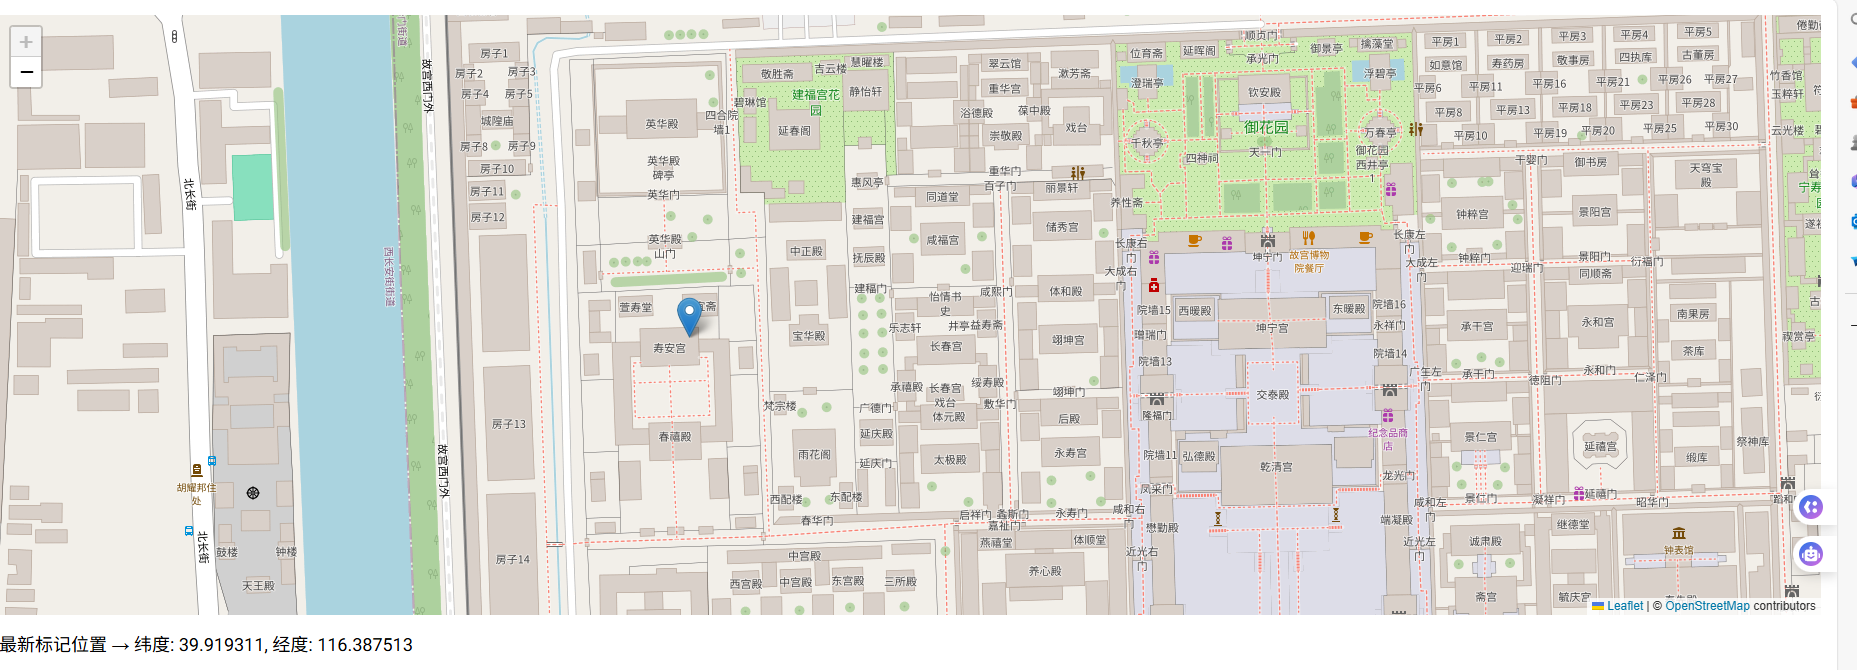
python
from nicegui import ui

ui.echart({
    'toolbox': {'feature': {'brush': {'type': ['rect']}}},
    'brush': {},
    'xAxis': {'type': 'category'},
    'yAxis': {'type': 'value'},
    'series': [{'type': 'line', 'data': [1, 2, 3]}],
}).on('chart:selectchanged', lambda e: label.set_text(
    f'Selected point {e.args["fromActionPayload"]["dataIndexInside"]}'
))
label = ui.label()

ui.run()
多点标记
python
from nicegui import events, ui

BEIJING_CENTER = (39.904200, 116.407400)
ui.add_head_html('<style>.nicegui-content { max-width: none !important; padding: 0; }</style>')

with ui.column().classes('w-full p-4 gap-4'):
    m = ui.leaflet(center=BEIJING_CENTER, zoom=10).classes('w-full h-[600px]')
    coord_label = ui.label('点击地图查看坐标').classes('text-lg whitespace-pre')

# 用于累积坐标文本
coordinates_history = []

def handle_click(e: events.GenericEventArguments):
    lat = e.args['latlng']['lat']
    lng = e.args['latlng']['lng']
    lat_rounded = round(lat, 6)
    lng_rounded = round(lng, 6)

    # 添加新标记(保留所有)
    m.marker(latlng=(lat_rounded, lng_rounded))

    # 记录坐标
    coordinates_history.append(f"({lat_rounded:.6f}, {lng_rounded:.6f})")
    if len(coordinates_history) > 100:
        coordinates_history.pop(0)  # 移除最旧的

    # 更新标签:每行一个坐标
    coord_label.set_text('\n'.join(coordinates_history))

m.on('map-click', handle_click)

ui.run()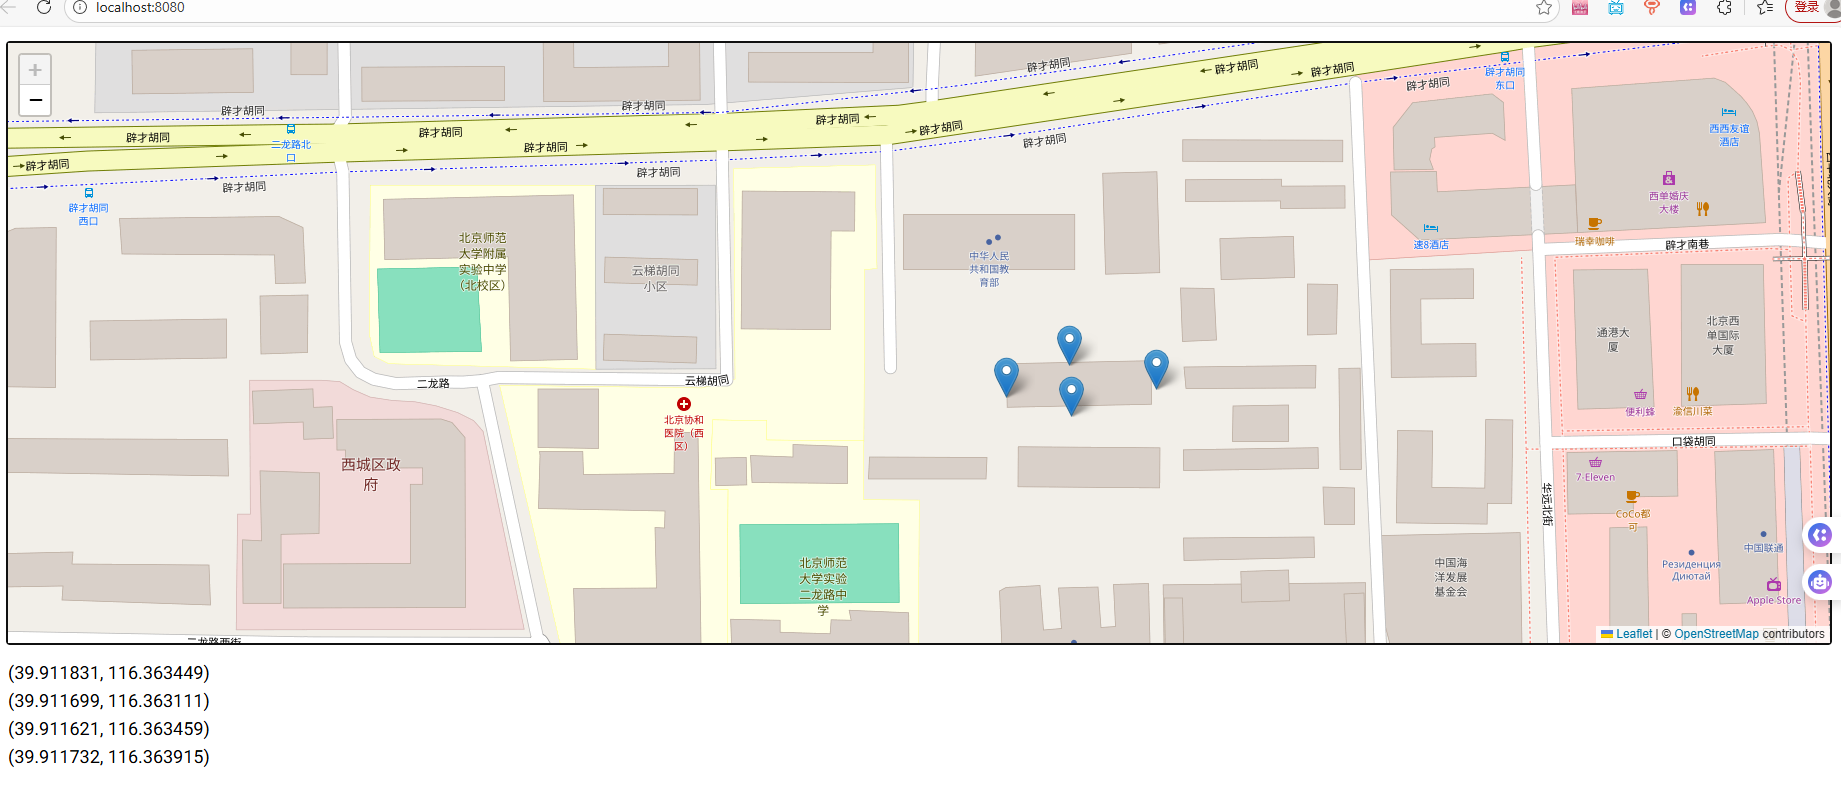
三、标记
您可以使用marker在地图上添加标记。center参数是一个包含纬度和经度的元组。这个演示通过点击地图来添加标记。请注意,"map-click"事件是指地图对象的点击事件,而"click"事件是指容器div的点击事件。
python
from nicegui import events, ui

m = ui.leaflet(center=(51.505, -0.09))

def handle_click(e: events.GenericEventArguments):
    lat = e.args['latlng']['lat']
    lng = e.args['latlng']['lng']
    m.marker(latlng=(lat, lng))
m.on('map-click', handle_click)

ui.run()
python
<nicegui.elements.leaflet.Leaflet at 0x7f87d5dbf6d0>四、标记后移动
您可以使用move方法移动标记。
python
from nicegui import ui

m = ui.leaflet(center=(51.505, -0.09))
marker = m.marker(latlng=m.center)
ui.button('Move marker', on_click=lambda: marker.move(51.51, -0.09))

ui.run()
python
<nicegui.elements.button.Button at 0x7f87d596e750>五、矢量图层
Leaflet支持一系列矢量图层,如圆形、多边形等。这些可以使用generic_layer方法添加。我们欢迎任何关于添加更多特定图层以简化使用的pull请求。
python
from nicegui import ui

m = ui.leaflet(center=(51.505, -0.09)).classes('h-32')
m.generic_layer(name='circle', args=[m.center, {'color': 'red', 'radius': 300}])

ui.run()
python
GenericLayer(leaflet=<nicegui.elements.leaflet.Leaflet object at 0x7f87d5db0f90>, id='205b53bd-e7f1-421c-ba93-7cb7471b4804', name='circle', args=[(51.505, -0.09), {'color': 'red', 'radius': 300}])六、平移和缩放
Leaflet中有多种选项可以配置地图。这个演示禁用了平移和缩放控件。
python
from nicegui import ui

options = {
    'zoomControl': False,
    'scrollWheelZoom': False,
    'doubleClickZoom': False,
    'boxZoom': False,
    'keyboard': False,
    'dragging': False,
}
ui.leaflet(center=(51.505, -0.09), options=options)

# ui.run()
python
<nicegui.elements.leaflet.Leaflet at 0x7f87d5dcff90>七、地图上绘制
您可以启用一个工具栏在地图上绘制。可以使用draw_control配置工具栏。这个演示通过点击地图添加标记和多边形。
python
from nicegui import events, ui

def handle_draw(e: events.GenericEventArguments):
    if e.args['layerType'] == 'marker':
        m.marker(latlng=(e.args['layer']['_latlng']['lat'],
                         e.args['layer']['_latlng']['lng']))
    if e.args['layerType'] == 'polygon':
        m.generic_layer(name='polygon', args=[e.args['layer']['_latlngs']])

draw_control = {
    'draw': {
        'polygon': True,
        'marker': True,
        'circle': False,
        'rectangle': False,
        'polyline': False,
        'circlemarker': False,
    },
    'edit': False,
}
m = ui.leaflet(center=(51.505, -0.09), zoom=13, draw_control=draw_control)
m.on('draw:created', handle_draw)

ui.run()
python
<nicegui.elements.leaflet.Leaflet at 0x7f87d5dd9390>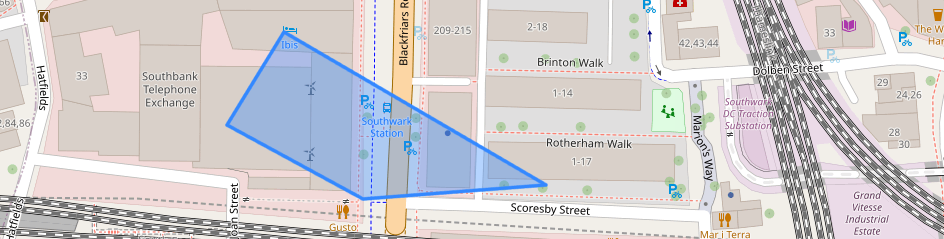
八、运行地图方法
您可以使用run_map_method方法运行Leaflet地图对象的方法。这个演示展示了如何将地图适配到整个世界。
python
from nicegui import ui

m = ui.leaflet(center=(51.505, -0.09)).classes('h-32')
ui.button('Fit world', on_click=lambda: m.run_map_method('fitWorld'))

ui.run()
python
<nicegui.elements.button.Button at 0x7f87d5dd4350>九、运行地图图层
您可以使用run_layer_method方法运行Leaflet图层对象的方法。这个演示展示了如何更改标记的透明度或更改其图标。
python
from nicegui import ui

m = ui.leaflet(center=(51.505, -0.09)).classes('h-32')
marker = m.marker(latlng=m.center)
ui.button('Hide', on_click=lambda: marker.run_method('setOpacity', 0.3))
ui.button('Show', on_click=lambda: marker.run_method('setOpacity', 1.0))

icon = 'L.icon({iconUrl: "http://leafletjs.com/examples/custom-icons/leaf-green.png"})'
ui.button('Change icon', on_click=lambda: marker.run_method(':setIcon', icon))

ui.run()
python
<nicegui.elements.button.Button at 0x7f87d5ddba90>十、等待初始化
您可以使用initialized方法等待地图初始化。当您想在创建地图后立即运行像适应边界这样的方法时,这是必要的。
python
from nicegui import ui

m = ui.leaflet(zoom=5)
central_park = m.generic_layer(name='polygon', args=[[
    (40.767809, -73.981249),
    (40.800273, -73.958291),
    (40.797011, -73.949683),
    (40.764704, -73.973741),
]])

async def fit_bounds():
    await m.initialized()
    bounds = await central_park.run_method('getBounds')
    m.run_map_method('fitBounds', [bounds['_southWest'], bounds['_northEast']])

# 使用一次性定时器(延迟 0 秒),触发异步函数
ui.timer(0, fit_bounds, once=True)

ui.run()
相信看了这个,对项目中遇到用地图,就会启发,做出产品需要的样子。