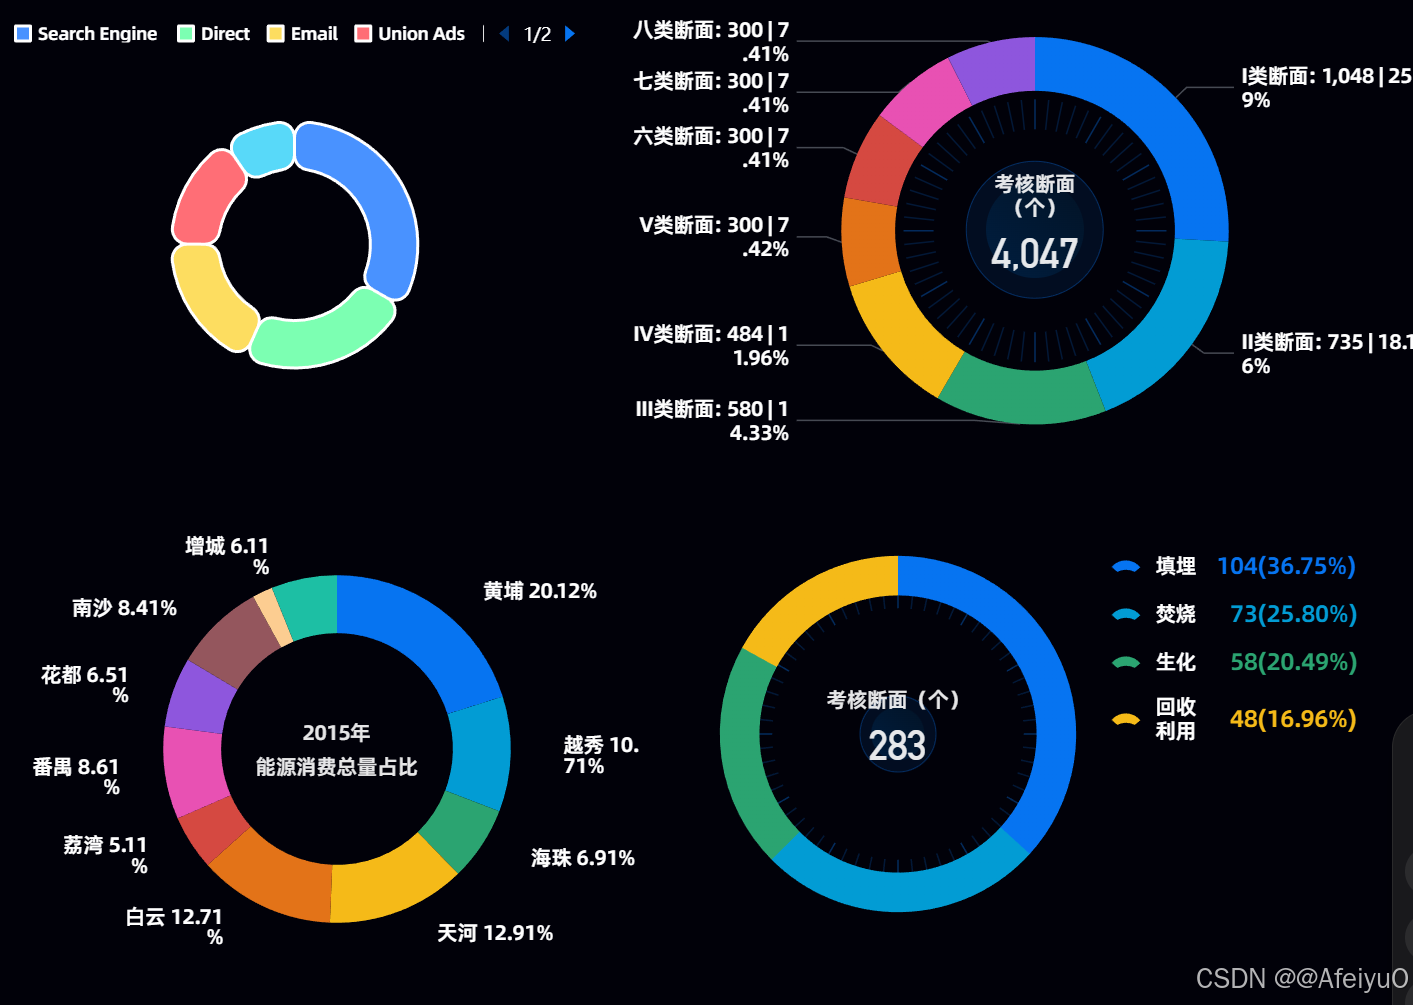
效果图:
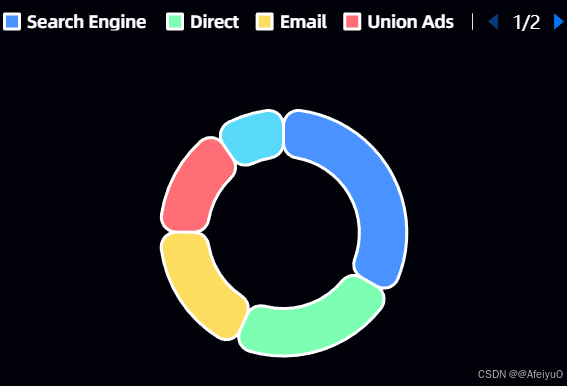
图一:
html
<template>
<v-chart ref="vChartRef" :option="option"></v-chart>
</template>
<script setup lang="ts">
import { ref, computed, reactive, onMounted } from "vue";
import VChart from "vue-echarts";
import { use } from "echarts/core";
import { CanvasRenderer } from "echarts/renderers";
import { PieChart } from "echarts/charts";
import {
DatasetComponent,
GridComponent,
TooltipComponent,
LegendComponent,
} from "echarts/components";
import cloneDeep from "lodash/cloneDeep";
use([
DatasetComponent,
CanvasRenderer,
PieChart,
GridComponent,
TooltipComponent,
LegendComponent,
]);
const vChartRef = ref();
const seriesItem = ref<any>({
type: "pie",
radius: ["40%", "65%"],
center: ["50%", "60%"],
roseType: false,
avoidLabelOverlap: false,
itemStyle: {
show: true,
borderRadius: 10,
borderColor: "#fff",
borderWidth: 2,
},
label: {
show: false,
position: "center",
formatter: "{b}",
fontSize: 12,
},
emphasis: {
label: {
show: true,
fontSize: "40",
fontWeight: "bold",
},
},
labelLine: {
show: false,
},
data: <any>[],
});
const chartData = reactive([
{
value: 1048,
name: "Search Engine",
},
{
value: 735,
name: "Direct",
},
{
value: 580,
name: "Email",
},
{
value: 484,
name: "Union Ads",
},
{
value: 300,
name: "Video Ads",
},
]);
// 饼图数据处理
const getSeries = () => {
let series: any = [];
const values = chartData;
//系列模板
let item = cloneDeep(seriesItem.value);
item.data = values;
series.push(item);
return series;
};
const option = reactive({
type: "ring",
tooltip: {
show: true,
trigger: "item",
},
legend: {
show: true,
},
series: <any>[],
});
onMounted(() => {
option.series = getSeries();
});
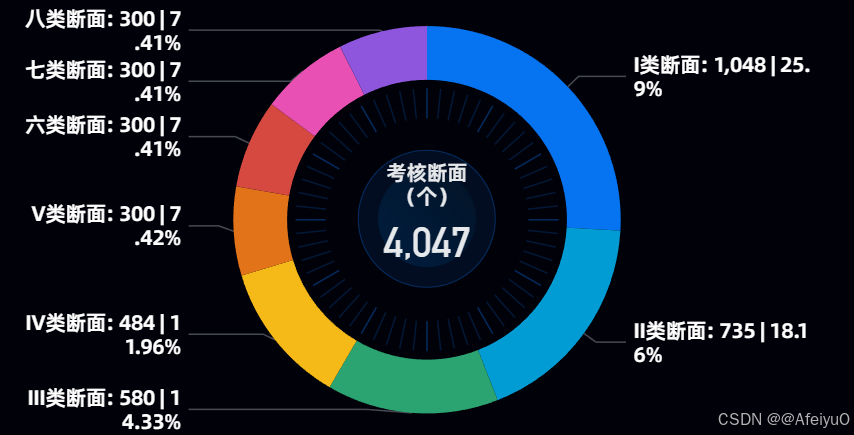
</script>图二:
html
<template>
<div class="pie02">
<div class="chart-div">
<div class="go-pie02-container">
<div class="left-box-circle">
<div
class="left-box-inner-circle">
<div class="name-box">
<div class="name">{{ option.centerText }}</div>
<span class="num"
>{{ option.total
}}<span
class="unit"
:style="{ color: option.unitFontColor, 'font-size': '14px' }"
>{{ option.totalUnit }}</span
></span
>
</div>
<div class="left-box-inner-circle02"></div>
</div>
</div>
</div>
<!-- echarts -->
<div
class="chart-box"
:class="option.legend.show ? '' : 'chart-box-in-center'"
>
<v-chart ref="vChartRef" :option="option"> </v-chart>
</div>
</div>
<Empty
v-show="!option.series[1].data || option.series[1].data.length === 0"
type="2"
></Empty>
</div>
</template>
<script setup lang="ts">
import { ref, reactive, onMounted } from "vue";
import VChart from "vue-echarts";
import { use } from "echarts/core";
import { CanvasRenderer } from "echarts/renderers";
import { PieChart } from "echarts/charts";
import { GaugeChart } from "echarts/charts";
import {
DatasetComponent,
GridComponent,
TooltipComponent,
LegendComponent,
} from "echarts/components";
use([
DatasetComponent,
CanvasRenderer,
PieChart,
GaugeChart,
GridComponent,
TooltipComponent,
LegendComponent,
]);
const vChartRef = ref(null);
const chartData = ref([
{ value: "1048", name: "I类断面" },
{ value: "735", name: "II类断面" },
{ value: "580", name: "III类断面" },
{ value: "484", name: "IV类断面" },
{ value: "300", name: "V类断面" },
{ value: "300", name: "六类断面" },
{ value: "300", name: "七类断面" },
{ value: "300", name: "八类断面" },
]);
// 基础颜色数组
const baseColors = [
"#0674f1",
"#029cd4",
"#2ba471",
"#f5ba18",
"#e37318",
"#D54941",
"#E851B3",
"#8E56DD",
"#9C27B0",
"#607D8B",
"#FF9800",
"#9E9E9E",
"#795548",
"#FFEB3B",
"#4CAF50",
"#E91E63",
"#3F51B5",
"#2196F3",
"#00BCD4",
"#4CAF50",
];
// 动态生成颜色配置
const generateColors = (count: number) => {
const colors = [];
for (let i = 0; i < count; i++) {
const color = baseColors[i % baseColors.length];
colors.push({
type: "linear",
x: 0,
y: 0,
x2: 0,
y2: 1,
colorStops: [
{
offset: 0,
color: color + "33", // 0% 处的颜色 (30% 透明度)
},
{
offset: 1,
color: color + "ff", // 100% 处的颜色 (完全不透明)
},
],
globalCoord: false,
global: false,
});
}
return colors;
};
const option = reactive({
// 标签显示信息
labelFormatInfo: "{b}: {c} | {d}%",
// 是否显示中心文字
showCenterText: true,
// 是否显示标签
showLabel: true,
// 中心文字
centerText: "考核断面(个)",
// 总数单位
totalUnit: "",
unitFontColor: "#ffffffe6",
circle01Width1: 200,
circle01Width2: 65,
// 饼图大小
pieWidth: 300,
total: 20,
color: generateColors(chartData.value.length),
tooltip: {
trigger: "item",
},
legend: {
show: false,
orient: "vertical",
top: 32,
left: 264,
icon: "path://M512 256c152.064-0.213333 297.941333 61.504 405.333333 171.477333L512 841.472 106.666667 427.477333C214.058667 317.504 359.936 255.786667 512 256z",
itemGap: 24,
itemWidth: 23,
itemHeight: 12,
textStyle: {
color: "#FFFFFF",
fontWeight: 700,
fontFamily: "AlibabaPuHuiTi_2_85_Bold",
fontSize: 12,
lineHeight: 16,
},
},
series: [
{
name: "刻度环",
type: "gauge",
radius: "55%",
left: "0%",
top: "0%",
center: ["50%", "50%"],
startAngle: 0,
endAngle: 360,
splitNumber: 12,
axisLine: {
show: false,
},
axisTick: {
show: true,
lineStyle: {
color: "#0674F1",
width: 1,
opacity: 0.2,
},
length: 20,
},
splitLine: {
show: false,
},
axisLabel: {
show: false,
},
detail: {
show: false,
},
},
{
name: "",
type: "pie",
left: "0%",
top: "0%",
center: ["50%", "50%"],
radius: ["65%", "90%"],
avoidLabelOverlap: true,
label: {
show: true,
overflow: "break",
color: "#ffffff",
fontSize: 14,
fontWeight: 700,
lineHeight: 16,
fontFamily: "AlibabaPuHuiTi_2_85_Bold",
formatter: "{b}: {c} | {d}%",
},
labelLine: {
show: true,
lineStyle: {
cap: "round",
},
},
emphasis: {
disabled: true,
scale: false,
label: {
show: false,
formatter: (params: any) => {
return [`{a|${params.name}(个)}`, `{b|${params.value}}`].join(
"\n"
);
},
rich: {
a: {
fontFamily: "AlibabaPuHuiTi_2_85_Bold",
fontWeight: 700,
fontSize: 14,
color: "rgba(255, 255, 255, 0.9)",
align: "center",
lineHeight: 20,
},
b: {
fontFamily: "DINAlternate-Bold",
fontWeight: 700,
fontSize: 28,
color: "rgba(255, 255, 255, 0.9)",
align: "center",
},
},
},
},
data: chartData.value,
},
],
});
onMounted(() => {});
</script>
<style lang="scss" scoped>
.pie02 {
background-color: #001e40;
width: 100%;
height: 100%;
position: relative;
.chart-div {
width: 100%;
height: 100%;
position: relative;
}
.chart-box {
width: 100%;
// height: 240px;
height: 100%;
position: absolute;
top: 50%;
left: 0px;
transform: translateY(-50%);
// z-index: -1;
}
.chart-box-in-center {
top: 50%;
left: 50%;
transform: translate(-50%, -50%);
}
.go-pie02-container {
width: 100%;
height: 100%;
overflow: hidden;
display: flex;
flex-direction: row;
justify-content: center;
align-items: center;
}
.right-legend {
width: calc(100% - 240px - 24px);
max-height: 100%;
margin-left: 24px;
overflow-y: auto;
}
.right-legend-item-box {
width: 100%;
margin-bottom: 24px;
display: flex;
flex-direction: row;
justify-content: flex-start;
align-items: center;
.icon {
width: 12px;
height: 12px;
margin-left: 5px;
margin-right: 10px;
// border: 1px solid rgba(6, 116, 241, 1);
border-radius: 0px 0px 0px 12px;
transform: rotate(135deg);
}
.legend-item {
font-size: 12px;
color: #ffffff;
letter-spacing: -0.5px;
line-height: 16px;
position: relative;
top: 2px;
}
}
.left-box-circle {
width: 240px;
height: 240px;
// border-radius: 50%;
// border: 1px solid rgba(6, 116, 241, 0.2);
position: relative;
}
.left-box-inner-circle {
text-align: center;
width: 250px;
height: 250px;
background: #0674f11a;
border: 1px solid #0674f14d;
position: absolute;
top: 50%;
left: 50%;
transform: translate(-50%, -50%);
border-radius: 50%;
// z-index: 1;
.name-box {
width: 110px;
// height: 91px;
position: absolute;
z-index: 100;
top: 50%;
left: 50%;
transform: translate(-50%, -50%);
}
.name {
padding: 0 13px;
color: #ffffffe6;
text-align: center;
line-height: 16px;
}
.num {
font-family: DINAlternate-Bold;
font-size: 28px;
color: #ffffffe6;
letter-spacing: -0.5px;
text-align: center;
}
.unit {
display: inline-block;
padding-left: 6px;
color: #ffffffe6;
text-align: center;
transform: translateY(-2px);
}
}
.left-box-inner-circle02 {
width: 120px;
height: 120px;
position: absolute;
top: 50%;
left: 50%;
transform: translate(-50%, -50%);
border-radius: 50%;
background-image: linear-gradient(225deg, #021326 0%, #001e40 100%);
}
}
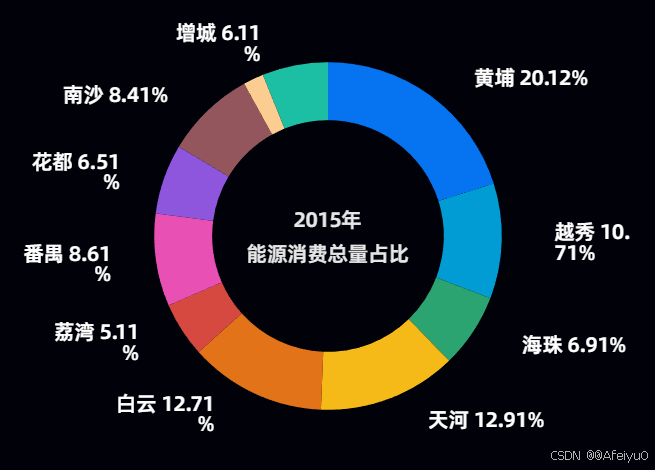
</style>图三:
html
<template>
<div class="pie03">
<div class="chart-div">
<div class="go-pie02-container">
<div class="left-box-circle">
<div class="left-box-inner-circle">
<div class="name-box">
<span class="name">{{ option.centerText }}</span>
<br />
<span class="name"
>{{ option.describeText
}}<span v-show="option.totalUnit" class="unit">{{
option.totalUnit
}}</span></span
>
</div>
</div>
</div>
</div>
<!-- echarts -->
<div
class="chart-box"
:class="option.legend.show ? '' : 'chart-box-in-center'"
>
<v-chart ref="vChartRef" :option="option"> </v-chart>
</div>
</div>
</div>
</template>
<script setup lang="ts">
import {
ref,
onMounted,
reactive,
} from "vue";
import VChart from "vue-echarts";
import { use } from "echarts/core";
import { CanvasRenderer } from "echarts/renderers";
import { PieChart } from "echarts/charts";
import {
DatasetComponent,
GridComponent,
TooltipComponent,
LegendComponent,
} from "echarts/components";
use([
DatasetComponent,
CanvasRenderer,
PieChart,
GridComponent,
TooltipComponent,
LegendComponent,
]);
const vChartRef = ref(null);
const chartData = ref([
{ value: "20.1", name: "黄埔" },
{ value: "10.7", name: "越秀" },
{ value: "6.9", name: "海珠" },
{ value: "12.9", name: "天河" },
{ value: "12.7", name: "白云" },
{ value: "5.1", name: "荔湾" },
{ value: "8.6", name: "番禺" },
{ value: "6.5", name: "花都" },
{ value: "8.4", name: "南沙" },
{ value: "1.9", name: "从化" },
{ value: "6.1", name: "增城" },
]);
// 基础颜色数组
const baseColors = [
"#0674f1",
"#029cd4",
"#2ba471",
"#f5ba18",
"#e37318",
"#D54941",
"#E851B3",
"#8E56DD",
"#9C27B0",
"#607D8B",
"#FF9800",
"#9E9E9E",
"#795548",
"#FFEB3B",
"#4CAF50",
"#E91E63",
"#3F51B5",
"#2196F3",
"#00BCD4",
"#4CAF50",
];
// 动态生成颜色配置
const generateColors = (count: number) => {
const colors = [];
for (let i = 0; i < count; i++) {
const color = baseColors[i % baseColors.length];
colors.push({
type: "linear",
x: 0,
y: 0,
x2: 0,
y2: 1,
colorStops: [
{
offset: 0,
color: color, // 0% 处的颜色 (30% 透明度) + "33"
},
{
offset: 1,
color: color, // 100% 处的颜色 (完全不透明) + "ff"
},
],
globalCoord: false,
global: false,
});
}
return colors;
};
const option = reactive({
// 中心文字
centerText: "2015年",
describeText: "能源消费总量占比",
// 总数单位
totalUnit: "",
color: generateColors(chartData.value.length),
tooltip: {
show: true,
trigger: "item",
},
legend: {
show: false,
orient: "vertical",
top: 32,
left: 264,
icon: "path://M512 256c152.064-0.213333 297.941333 61.504 405.333333 171.477333L512 841.472 106.666667 427.477333C214.058667 317.504 359.936 255.786667 512 256z",
itemGap: 24,
itemWidth: 23,
itemHeight: 12,
textStyle: {
color: "#FFFFFF",
fontWeight: 700,
fontFamily: "AlibabaPuHuiTi_2_85_Bold",
fontSize: 12,
lineHeight: 16,
},
},
series: [
{
name: "",
type: "pie",
left: "0%",
top: "0%",
center: ["50%", "50%"],
radius: ["50%", "75%"],
avoidLabelOverlap: true,
minShowLabelAngle: 0,
label: {
show: true,
overflow: "breakAll",
color: "#ffffff",
fontSize: 14,
fontFamily: "AlibabaPuHuiTi_2_85_Bold",
formatter: "{b} {d}%",
},
labelLine: {
show: false,
},
emphasis: {
label: {
show: true,
color: "#029CD4FF",
},
},
data: chartData.value,
},
],
});
onMounted(() => {});
</script>
<style lang="scss" scoped>
.pie03 {
background-color: #000;
width: 100%;
height: 100%;
position: relative;
.chart-div {
width: 100%;
height: 100%;
position: relative;
}
.chart-box {
width: 100%;
height: 100%;
// max-width: 280px;
// max-height: 280px;
position: absolute;
top: 50%;
left: 0px;
transform: translateY(-50%);
}
.chart-box-in-center {
top: 50%;
left: 50%;
transform: translate(-50%, -50%);
}
.go-pie02-container {
width: 100%;
height: 100%;
overflow: hidden;
display: flex;
flex-direction: row;
justify-content: center;
align-items: center;
}
.right-legend {
width: calc(100% - 240px - 24px);
max-height: 100%;
margin-left: 24px;
overflow-y: auto;
}
.right-legend-item-box {
width: 100%;
margin-bottom: 24px;
display: flex;
flex-direction: row;
justify-content: flex-start;
align-items: center;
.icon {
width: 12px;
height: 12px;
margin-left: 5px;
margin-right: 10px;
// border: 1px solid rgba(6, 116, 241, 1);
border-radius: 0px 0px 0px 12px;
transform: rotate(135deg);
}
.legend-item {
font-size: 12px;
color: #ffffff;
letter-spacing: -0.5px;
line-height: 16px;
position: relative;
top: 2px;
}
}
.left-box-circle {
width: 100%;
height: 100%;
// border-radius: 50%;
// border: 1px solid rgba(6, 116, 241, 0.2);
position: relative;
}
.left-box-inner-circle {
text-align: center;
width: 100%;
height: 100%;
// background: #0674f11a;
// border: 1px solid #0674f14d;
position: absolute;
top: 50%;
left: 50%;
transform: translate(-50%, -50%);
border-radius: 50%;
.name-box {
width: 100%;
// height: 91px;
position: absolute;
z-index: 100;
top: 50%;
left: 50%;
transform: translate(-50%, -50%);
}
.name {
color: #ffffffe6;
text-align: center;
line-height: 20px;
}
.num {
font-family: DINAlternate-Bold;
font-size: 28px;
color: #ffffffe6;
letter-spacing: -0.5px;
text-align: center;
}
.unit {
padding-left: 6px;
color: #ffffffe6;
text-align: center;
}
}
.left-box-inner-circle02 {
// width: 65px;
// height: 65px;
position: absolute;
top: 50%;
left: 50%;
transform: translate(-50%, -50%);
border-radius: 50%;
// background-image: linear-gradient(225deg, #021326 0%, #001E40 100%);
}
}
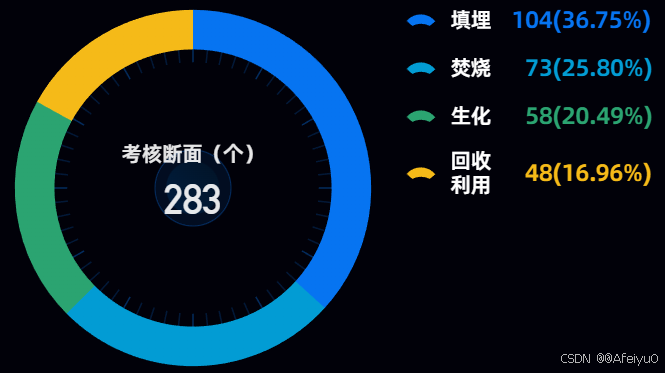
</style>图四:
html
<template>
  <div class="pie04">
    <div class="chart-div">
      <div
        class="wrap-box"
        :style="{
          height: '100%',
          width: boxHeight + 'px',
          transform: `translateX(${option.pieX}px)`,
        }"
      >
        <div class="go-pie04-container">
          <div class="left-box-circle">
            <div class="left-box-inner-circle">
              <div class="left-box-inner-circle02"></div>
            </div>
          </div>
        </div>
        <div class="name-box">
          <div
            :style="`transform:translateY(${option.centerTextTranslateY}px)`"
          >
            <div class="name">{{ option.centerText }}</div>

            <div class="num">
              {{ option.total
              }}<span
                class="unit"
                :style="{ color: option.unitFontColor, 'font-size': '14px' }"
                >{{ option.totalUnit }}</span
              >
            </div>
          </div>
        </div>

        <!-- echarts -->
        <div
          class="chart-box"
          :class="option.legend.show ? '' : 'chart-box-in-center'"
        >
          <v-chart ref="vChartRef" :option="option" style="width: 100%; height: 100%;"> </v-chart>
        </div>
      </div>

      <!-- 右侧的图例 -->
      <div
        class="right-legend"
        :style="{
          width: `calc(100% - ${boxHeight} - ${option.legendPieMar}px)`,
          'margin-left': boxHeight + option.legendPieMar + 'px',
          'padding-top': (option.paddingTop || 0) + 'px',
        }"
      >
        <div class="right-legend-inner-box">
          <div
            v-for="(item, index) in chartData"
            :key="index"
            class="legend-item"
            :style="{
              'margin-bottom': '12px',
            }"
          >
            <!-- 左边名称 -->
            <div
              class="group-box left-width"
              :style="{
                width: '100px',
              }"
            >
              <div class="icon">
                <svg
                  t="1698804237191"
                  class="icon"
                  viewBox="0 0 1024 1024"
                  version="1.1"
                  xmlns="http://www.w3.org/2000/svg"
                  p-id="7180"
                  xmlns:xlink="http://www.w3.org/1999/xlink"
                  width="200"
                  height="200"
                >
                  <path
                    d="M505.408 320a638.72 638.72 0 0 1 496.896 236.608l-192.832 156.544A637.248 637.248 0 0 0 512 640c-106.752 0-207.36 26.112-295.872 72.32L19.2 543.808A638.592 638.592 0 0 1 505.408 320z"
                    p-id="7181"
                    :fill="option.color[index].colorStops[0].color"
                  ></path>
                </svg>
              </div>
              <div
                class="name"
                :style="{
                  'margin-left': '4.64px',
                }"
              >
                {{ item.name }}
              </div>
            </div>

            <!-- 右边数据 -->
            <div class="group-box right-width">
              <div
                class="value"
                :style="{ color: option.color[index].colorStops[0].color }"
              >
                {{ item.value }}{{ option.totalUnit }}
              </div>
              <div
                class="zb"
                :style="{
                  color: '#ffffff',
                }"
              >
                ({{ item.zb }})
              </div>
            </div>
          </div>
        </div>
      </div>
    </div>
  </div>
</template>

<script setup lang="ts">
import { ref, reactive } from "vue";
import VChart from "vue-echarts";
import { use } from "echarts/core";
import { CanvasRenderer } from "echarts/renderers";
import { PieChart } from "echarts/charts";
import { GaugeChart } from "echarts/charts";
import {
  DatasetComponent,
  GridComponent,
  TooltipComponent,
  LegendComponent,
} from "echarts/components";

use([
  DatasetComponent,
  CanvasRenderer,
  PieChart,
  GaugeChart,
  GridComponent,
  TooltipComponent,
  LegendComponent,
]);

const vChartRef = ref();
let boxWidth = 0;
let boxHeight = 240;

const chartData = ref([
  { value: "104", name: "填埋", zb: "20%" },
  { value: "73", name: "焚烧", zb: "20%" },
  { value: "58", name: "生化", zb: "20%" },
  { value: "48", name: "回收利用", zb: "20%" },
]);

// 基础颜色数组
const baseColors = [
  "#0674f1",
  "#029cd4",
  "#2ba471",
  "#f5ba18",
  "#e37318",
  "#D54941",
  "#E851B3",
  "#8E56DD",
  "#9C27B0",
  "#607D8B",
  "#FF9800",
  "#9E9E9E",
  "#795548",
  "#FFEB3B",
  "#4CAF50",
  "#E91E63",
  "#3F51B5",
  "#2196F3",
  "#00BCD4",
  "#4CAF50",
];

// 动态生成颜色配置
const generateColors = (count: number) => {
  const colors = [];
  for (let i = 0; i < count; i++) {
    const color = baseColors[i % baseColors.length];
    colors.push({
      type: "linear",
      x: 0,
      y: 0,
      x2: 0,
      y2: 1,
      colorStops: [
        {
          offset: 0,
          color: color, // 0% 处的颜色 (30% 透明度)  + "33"
        },
        {
          offset: 1,
          color: color, // 100% 处的颜色 (完全不透明) + "ff"
        },
      ],
      globalCoord: false,
      global: false,
    });
  }
  return colors;
};

const option = reactive({
  // 标签显示信息
  labelFormatInfo: "{b}: {c} | {d}%",
  // 是否显示中心文字
  showCenterText: true,
  paddingTop: 0,
  // 是否显示标签
  showLabel: false,
  // 中心文字
  centerText: "考核断面(个)",
  // 总数单位
  totalUnit: "",
  unitFontSize: 28,
  unitFontColor: "#ffffffe6",
  legendPieMar: 24,
  showLegendValue: true,
  centerTextTranslateY: 0,
  pieX: 0,
  showAutoZb: true,
  total: 283,

  // 刻度表大小
  gaugeWidth: "75%",

  // 圆圈1的大小
  circle01Width1: "50px",
  // 圆圈2的大小
  circle01Width2: "35px",

  color: generateColors(chartData.value.length),
  tooltip: {  // 添加tooltip配置
    trigger: 'item',
    backgroundColor: 'rgba(0, 0, 0, 0.8)',
    borderColor: '#0674F1',
    borderWidth: 1,
    textStyle: {
      color: '#fff',
      fontSize: 14
    },
    // formatter: (params: any) => { //展示格式
    //   return `${params.name}: ${params.value}${option.totalUnit}<br/>${params.percent}%`;
    // }
  },
  legend: {
    show: false,
    orient: "vertical",
    top: 32,
    left: 264,
    icon: "path://M512 256c152.064-0.213333 297.941333 61.504 405.333333 171.477333L512 841.472 106.666667 427.477333C214.058667 317.504 359.936 255.786667 512 256z",
    itemGap: 24,
    itemWidth: 23,
    itemHeight: 12,
    textStyle: {
      color: "#FFFFFF",
      fontWeight: 700,
      fontFamily: "AlibabaPuHuiTi_2_85_Bold",
      fontSize: 12,
      lineHeight: 16,
    },
  },
  series: [
    {
      name: "刻度环",
      type: "gauge",
      radius: "95%",
      left: "0%",
      top: "0%",
      center: ["50%", "50%"],
      startAngle: 0,
      endAngle: 360,
      splitNumber: 12,
      axisLine: {
        show: false,
      },
      axisTick: {
        show: true,
        lineStyle: {
          color: "#0674F1",
          width: 1,
          opacity: 0.2,
        },
        length: 15,
      },
      splitLine: {
        show: false,
      },
      axisLabel: {
        show: false,
      },
      detail: {
        show: false,
      },
    },
    {
      name: "",
      type: "pie",
      left: "0%",
      top: "0%",
      center: ["50%", "50%"],
      radius: ["70%", "90%"],
      avoidLabelOverlap: true,
      label: {  // 修改标签配置,移除外部标签
        show: false,  // 设置为false以移除外部标签
        position: 'center',  // 可选:将标签显示在中心
        color: "#ffffff",
        fontSize: 14,
        fontWeight: 700,
        lineHeight: 16,
        fontFamily: "AlibabaPuHuiTi_2_85_Bold",
        formatter: "{d}%",  // 显示百分比
      },
      labelLine: {  // 引线
        show: false,  // 设置为false以移除引线
      },
      emphasis: {
        disabled: false,  // 启用高亮效果
        scale: true,      // 启用缩放效果
        scaleSize: 5,     // 缩放大小
        label: {
          show: false,     // 高亮时显示标签
          position: 'center',  // 标签位置在中心
          formatter: '{b}\n{d}%',  // 显示名称和百分比
          fontSize: 16,
          fontWeight: 'bold',
          color: '#fff'
        },
      },
      data: chartData.value,
    },
  ],
});
</script>
<style lang="scss" scoped>
.pie04 {
  background-color: #000;
  width: 100%;
  height: 100%;
  position: relative;
  .chart-div {
    width: 100%;
    height: 100%;
    position: relative;
  }
  .wrap-box {
    position: absolute;
    top: 0px;
    left: 0px;
  }
  .name-box {
    width: 82%;
    // height: 62px;
    position: absolute;
    // z-index: 100;
    top: 50%;
    left: 50%;
    transform: translate(-50%, -50%);
  }
  .name {
    padding: 0 13px;
    color: #ffffffe6;

    text-align: center;
    line-height: 16px;
  }
  .num {
    font-family: DINAlternate-Bold;
    font-size: 28px;
    color: #ffffffe6;
    letter-spacing: -0.5px;
    text-align: center;
  }
  .unit {
    display: inline-block;
    padding-left: 6px;
    color: #ffffffe6;
    text-align: center;
    transform: translateY(-2px);
  }
  .chart-box {
    width: calc(100% + 20px);
    height: calc(100% + 20px);
    // height: 240px;
    // height: 100%;
    position: absolute;
    top: 50%;
    left: 0px;
    transform: translateY(-50%);
    z-index: 1;
  }
  .chart-box-in-center {
    top: 50%;
    left: 50%;
    transform: translate(-50%, -50%);
  }
  .go-pie04-container {
    width: 100%;
    height: 100%;
    overflow: hidden;
    display: flex;
    flex-direction: row;
    justify-content: center;
    align-items: center;
  }
  .right-legend {
    height: 100%;
    width: 240px;
    margin-left: 40px;
    overflow-y: auto;
    .right-legend-inner-box {
      width: 100%;
      // height: 100%;
      display: flex;
      flex-direction: column;
      justify-content: center;
    }
    .legend-item:last-child {
      margin-bottom: 0px !important;
    }
    .legend-item {
      width: 100%;
      display: flex;
      flex-direction: row;
      flex-wrap: nowrap;
      justify-content: space-between;
      align-items: center;
      .left-width {
        width: 100px;
      }
      .group-box {
        display: flex;
        flex-direction: row;
        justify-content: flex-start;
        align-items: center;
      }
      .icon {
        width: 20px;
        height: 20px;
      }
      .name {
        margin-left: 4.64px;
        // width: 80px;
        text-align: left;
        font-family: AlibabaPuHuiTi_2_85_Bold;
        color: #ffffff;
        letter-spacing: -0.25px;
        line-height: 16px;
      }
      .value {
        // width: 39px;
        height: 20px;
        font-size: 16px;
        letter-spacing: -0.25px;
        line-height: 20px;
        text-align: right;
      }
      .zb {
        width: 73px;
        text-align: left;
        color: #ffffff;
        font-size: 16px;
        line-height: 20px;
        letter-spacing: -0.25px;
      }
    }
  }
  .right-legend-item-box {
    width: 100%;
    margin-bottom: 24px;
    display: flex;
    flex-direction: row;
    justify-content: flex-start;
    align-items: center;
    .icon {
      width: 12px;
      height: 12px;
      margin-left: 5px;
      margin-right: 10px;
      // border: 1px solid rgba(6, 116, 241, 1);
      border-radius: 0px 0px 0px 12px;
      transform: rotate(135deg);
    }
    .legend-item {
      font-size: 12px;
      color: #ffffff;
      letter-spacing: -0.5px;
      line-height: 16px;
      position: relative;
      top: 2px;
    }
  }
  .left-box-circle {
    width: 240px;
    height: 240px;
    // border-radius: 50%;
    // border: 1px solid rgba(6, 116, 241, 0.2);
    position: relative;
  }
  .left-box-inner-circle {
    text-align: center;
    width: 62px;
    height: 62px;
    background: #0674f11a;
    border: 1px solid #0674f14d;
    position: absolute;
    top: 50%;
    left: 50%;
    transform: translate(-50%, -50%);
    border-radius: 50%;
  }
  .left-box-inner-circle02 {
    width: 42px;
    height: 42px;
    position: absolute;
    top: 50%;
    left: 50%;
    transform: translate(-50%, -50%);
    border-radius: 50%;
    background-image: linear-gradient(225deg, #021326 0%, #001e40 100%);
  }
}
</style>