import os
import numpy as np
import matplotlib.pyplot as plt
import seaborn as sns
from PIL import Image
import cv2
from collections import Counter
from sklearn.decomposition import PCA
from sklearn.manifold import TSNE
import random

sns.set(style="whitegrid")
#DETECT CLASSES

class_paths = []
class_labels = []

for fruit in os.listdir(DATASET_PATH):
    fruit_path = os.path.join(DATASET_PATH, fruit)
    if os.path.isdir(fruit_path):
        for status in os.listdir(fruit_path):
            status_path = os.path.join(fruit_path, status)
            if os.path.isdir(status_path):
                class_paths.append(status_path)
                class_labels.append(f"{fruit}_{status}")

print("Detected Classes:")
for label in class_labels:
    print(label)
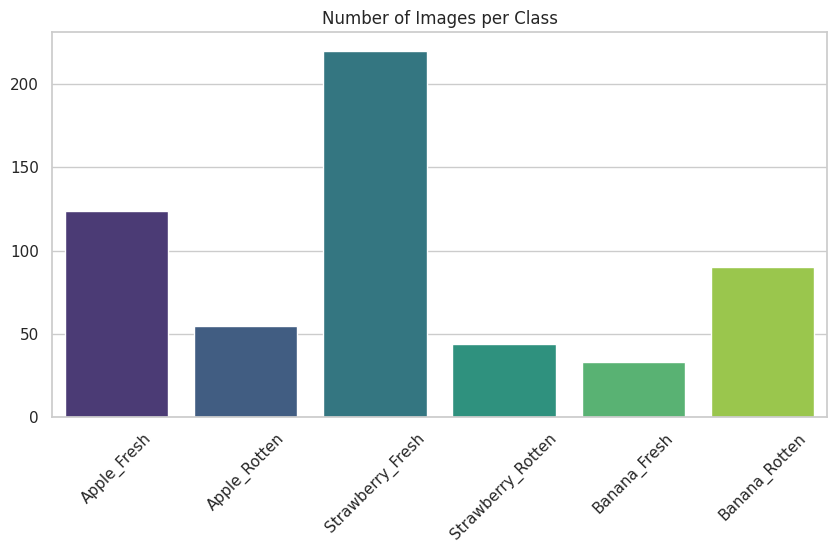
#CLASS DISTRIBUTION

class_counts = {label: len(os.listdir(path)) for label, path in zip(class_labels, class_paths)}

plt.figure(figsize=(10,5))
sns.barplot(x=list(class_counts.keys()), y=list(class_counts.values()), palette="viridis")
plt.title("Number of Images per Class")
plt.xticks(rotation=45)
plt.show()
复制代码
/usr/local/lib/python3.11/dist-packages/seaborn/_oldcore.py:1765: FutureWarning: unique with argument that is not not a Series, Index, ExtensionArray, or np.ndarray is deprecated and will raise in a future version.
  order = pd.unique(vector)
python复制代码
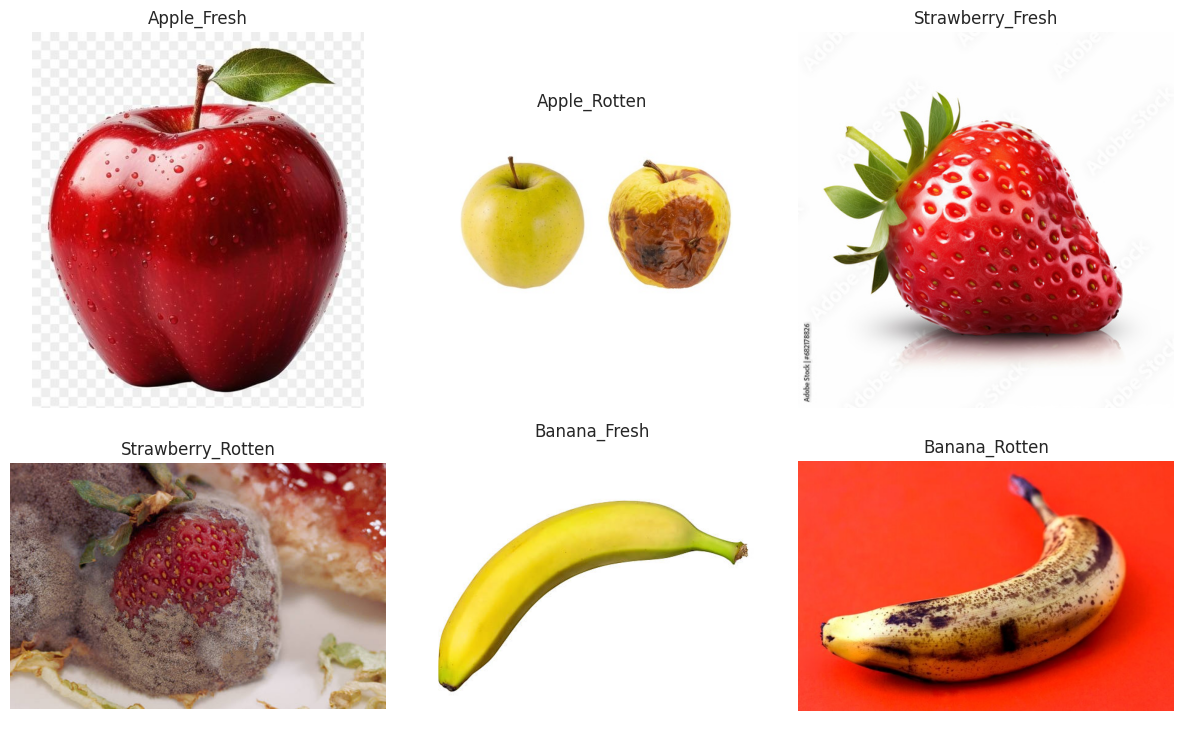
#SHOW RANDOM SAMPLE IMAGES

plt.figure(figsize=(12,8))
i = 1
for path, label in zip(class_paths, class_labels):
    img_name = random.choice(os.listdir(path))
    img = Image.open(os.path.join(path, img_name))
    plt.subplot(2, 3, i)
    plt.imshow(img)
    plt.title(label)
    plt.axis("off")
    i += 1
plt.tight_layout()
plt.show()
python复制代码
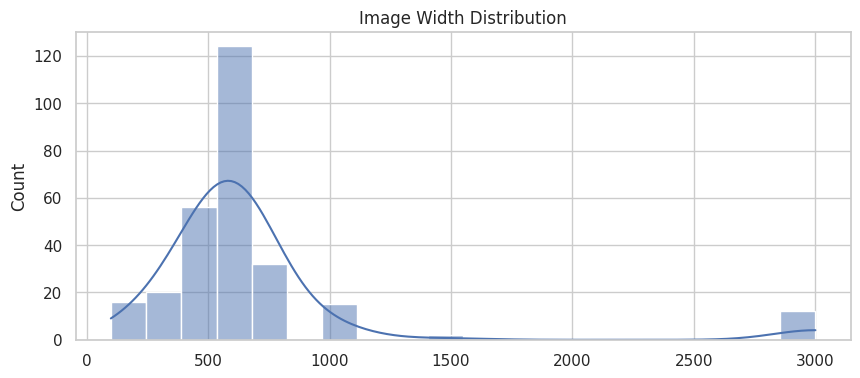
#IMAGE SIZE ANALYSIS
widths, heights = [], []
for path in class_paths:
for img_name in os.listdir(path)[:50]: # sample to speed up
img = Image.open(os.path.join(path, img_name))
w, h = img.size
widths.append(w)
heights.append(h)
plt.figure(figsize=(10,4))
sns.histplot(widths, bins=20, kde=True)
plt.title("Image Width Distribution")
plt.show()
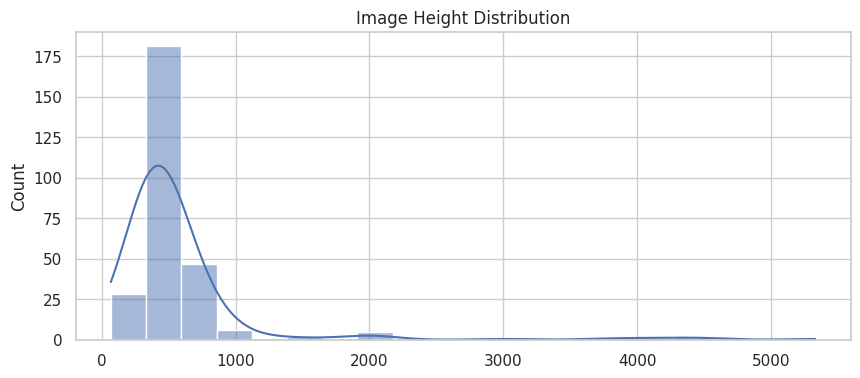
plt.figure(figsize=(10,4))
sns.histplot(heights, bins=20, kde=True)
plt.title("Image Height Distribution")
plt.show()
复制代码
/usr/local/lib/python3.11/dist-packages/seaborn/_oldcore.py:1119: FutureWarning: use_inf_as_na option is deprecated and will be removed in a future version. Convert inf values to NaN before operating instead.
  with pd.option_context('mode.use_inf_as_na', True):
复制代码
/usr/local/lib/python3.11/dist-packages/seaborn/_oldcore.py:1119: FutureWarning: use_inf_as_na option is deprecated and will be removed in a future version. Convert inf values to NaN before operating instead.
  with pd.option_context('mode.use_inf_as_na', True):
python复制代码
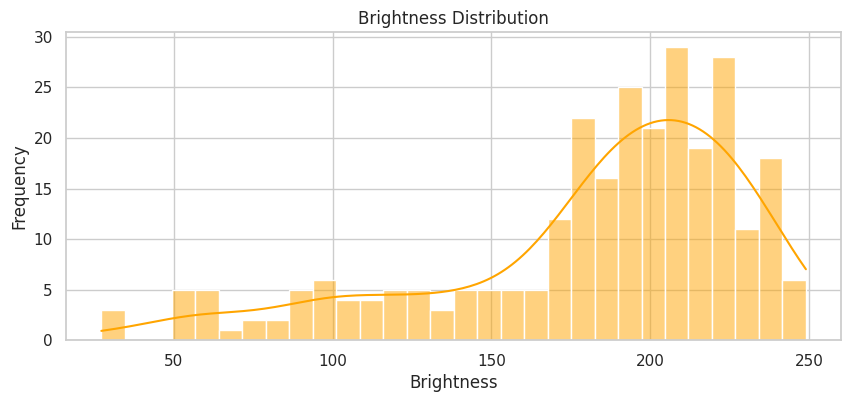
#BRIGHTNESS DISTRIBUTION

brightness_values = []

for path in class_paths:
    for img_name in os.listdir(path)[:50]:
        img = Image.open(os.path.join(path, img_name))
        gray = cv2.cvtColor(np.array(img), cv2.COLOR_RGB2GRAY)
        brightness_values.append(np.mean(gray))

plt.figure(figsize=(10,4))
sns.histplot(brightness_values, bins=30, kde=True, color="orange")
plt.title("Brightness Distribution")
plt.xlabel("Brightness")
plt.ylabel("Frequency")
plt.show()
复制代码
/usr/local/lib/python3.11/dist-packages/seaborn/_oldcore.py:1119: FutureWarning: use_inf_as_na option is deprecated and will be removed in a future version. Convert inf values to NaN before operating instead.
  with pd.option_context('mode.use_inf_as_na', True):
python复制代码
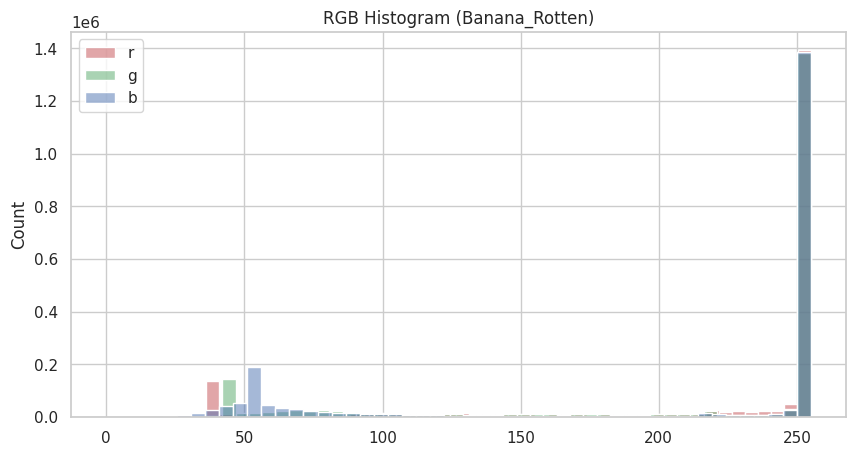
#COLOR HISTOGRAM (RGB) OF SAMPLE IMAGE

sample_path = random.choice(class_paths)
sample_img = random.choice(os.listdir(sample_path))
img = cv2.imread(os.path.join(sample_path, sample_img))
img_rgb = cv2.cvtColor(img, cv2.COLOR_BGR2RGB)

plt.figure(figsize=(10,5))
colors = ("r", "g", "b")
for i, color in enumerate(colors):
    hist = img_rgb[:,:,i].flatten()
    sns.histplot(hist, bins=50, color=color, label=color, alpha=0.5)
plt.title(f"RGB Histogram ({sample_path.split('/')[-2]}_{sample_path.split('/')[-1]})")
plt.legend()
plt.show()
复制代码
/usr/local/lib/python3.11/dist-packages/seaborn/_oldcore.py:1119: FutureWarning: use_inf_as_na option is deprecated and will be removed in a future version. Convert inf values to NaN before operating instead.
  with pd.option_context('mode.use_inf_as_na', True):
/usr/local/lib/python3.11/dist-packages/seaborn/_oldcore.py:1119: FutureWarning: use_inf_as_na option is deprecated and will be removed in a future version. Convert inf values to NaN before operating instead.
  with pd.option_context('mode.use_inf_as_na', True):
/usr/local/lib/python3.11/dist-packages/seaborn/_oldcore.py:1119: FutureWarning: use_inf_as_na option is deprecated and will be removed in a future version. Convert inf values to NaN before operating instead.
  with pd.option_context('mode.use_inf_as_na', True):
python复制代码
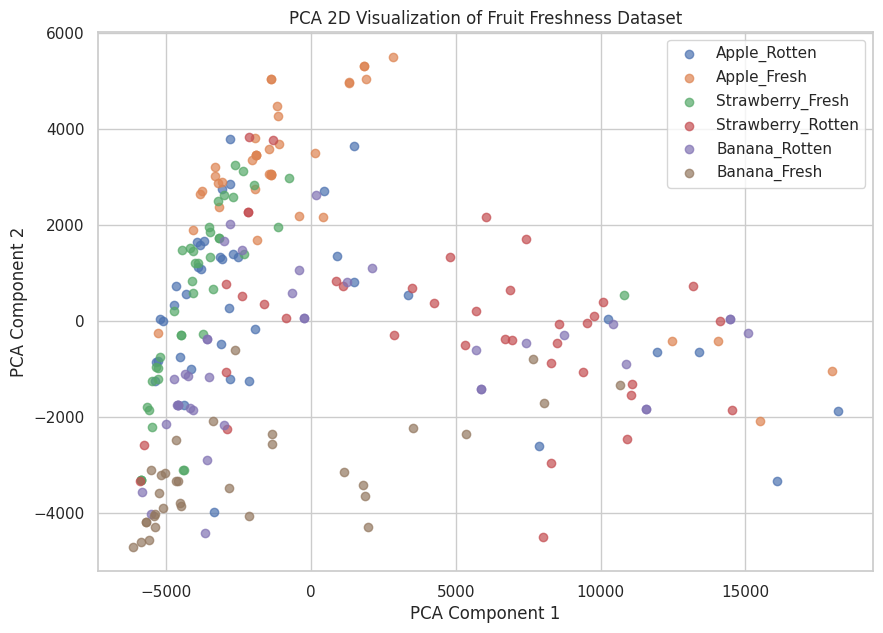
#PCA 2D VISUALIZATION

X = []
y = []

for path, label in zip(class_paths, class_labels):
    for img_name in os.listdir(path)[:40]:  # limit to speed up
        img_path = os.path.join(path, img_name)
        img = Image.open(img_path).convert('RGB')  # force RGB
        img = img.resize((64,64))
        X.append(np.array(img).flatten())
        y.append(label)

# Convert to NumPy arrays
X = np.array(X)
y = np.array(y)

print("Shape of X:", X.shape)
print("Number of labels:", len(y))

# Apply PCA
from sklearn.decomposition import PCA
pca = PCA(n_components=2)
X_pca = pca.fit_transform(X)

# Plot PCA result
plt.figure(figsize=(10,7))
for label in set(y):
    idx = np.where(y == label)
    plt.scatter(X_pca[idx,0], X_pca[idx,1], label=label, alpha=0.7)
plt.title("PCA 2D Visualization of Fruit Freshness Dataset")
plt.xlabel("PCA Component 1")
plt.ylabel("PCA Component 2")
plt.legend()
plt.show()
复制代码
Shape of X: (233, 12288)
Number of labels: 233
python复制代码
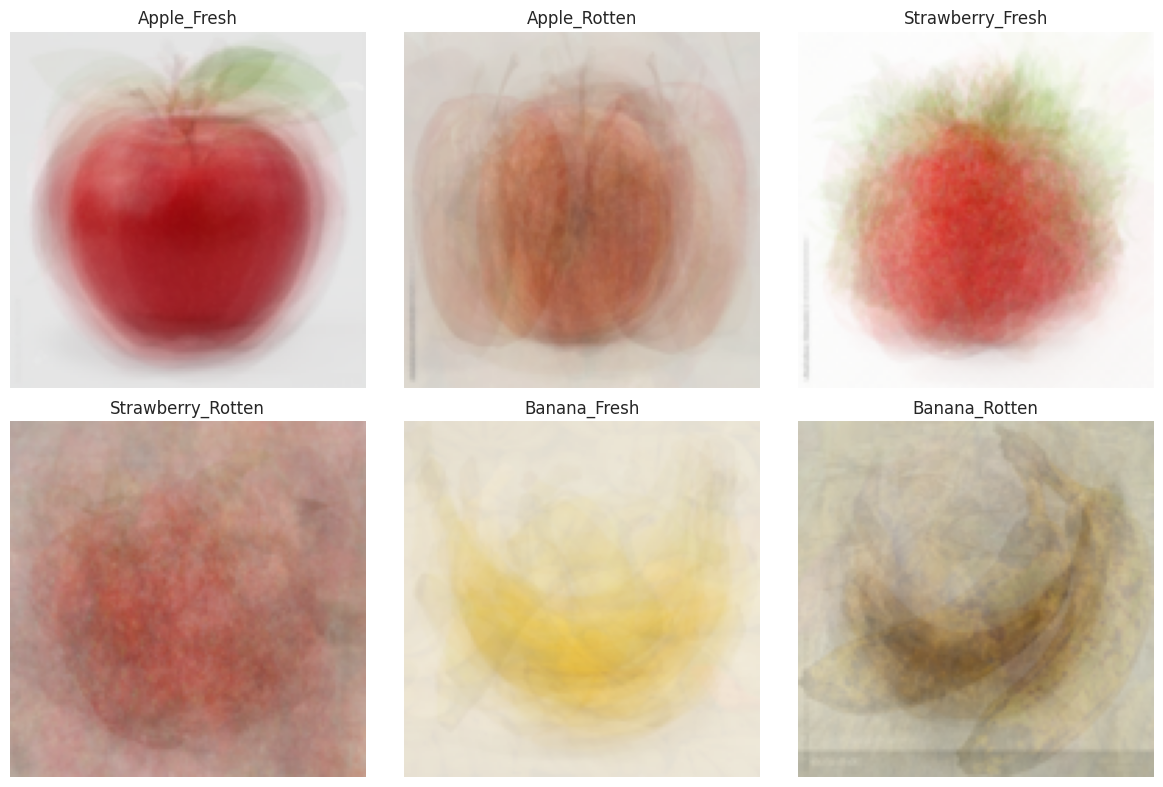
plt.figure(figsize=(12,8))

for i, (path, label) in enumerate(zip(class_paths, class_labels)):
    imgs = []

    # Limit number of images to reduce blur
    sample_imgs = random.sample(os.listdir(path), min(len(os.listdir(path)), 30))

    for img_name in sample_imgs:
        img_path = os.path.join(path, img_name)
        img = Image.open(img_path).convert('RGB')  # Force RGB
        img = img.resize((128,128))                # Uniform size
        imgs.append(np.array(img))

    # Stack and compute average
    avg_img = np.mean(np.stack(imgs, axis=0), axis=0).astype("uint8")

    # Plot
    plt.subplot(2,3,i+1)
    plt.imshow(avg_img)
    plt.title(label)
    plt.axis("off")

plt.tight_layout()
plt.show()