引言:
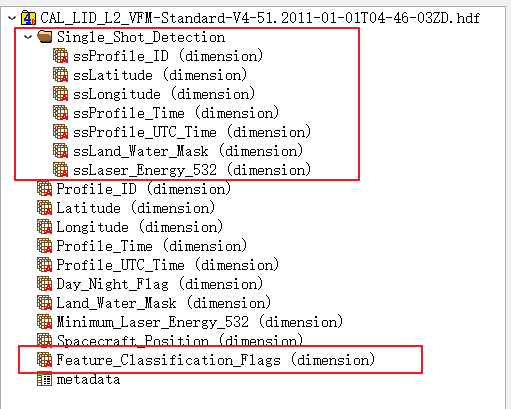
使用CALIPSO-VFM中的Single_Shot_Detection里面的ssLatitude、ssLongitude、ssProfile_Time、ssProfile_UTC_Time进行详细绘图;其中Feature_Classification_Flags内的中层和高层会被插值或者直接复制,构成(N, 15, 545)的形式
1、批量绘制主类型图
python
#!/usr/bin/env python3
# -*- coding: utf-8 -*-

"""
批量读取 CALIPSO VFM (HDF4) 文件,统一输出到两个文件夹:

OUT_ROOT/
  csv/   -> 所有 CSV
  fig/   -> 所有 PNG

每个输出文件都用"原始文件名中的年月日+时间"作为前缀,例如:
  2011-01-03T06-12-40ZD_profiles_latlon_time.csv
  2011-01-03T06-12-40ZD_profiles_time_only.csv
  2011-01-03T06-12-40ZD_track_vfm_4km.png
  2011-01-03T06-12-40ZD_curtain_vfm.png

依赖:
  - numpy
  - matplotlib
  - pyhdf  (HDF4读取)
  - (可选) cartopy:如果装了,会带海岸线/国界底图;没装也能画(无底图)
"""

import os
import csv
import glob
import time
import traceback
import numpy as np
import matplotlib.pyplot as plt
from datetime import datetime, timedelta
from matplotlib.colors import ListedColormap, BoundaryNorm
from matplotlib.collections import LineCollection


# ===================== 0) 用户配置区域(只需要改这里) =====================
IN_DIR = r"E:/haze_judge/test_calipso/test_read_calipso/a02_data"   # 输入文件夹:放很多 .hdf
OUT_ROOT = r"E:/haze_judge/test_calipso/test_read_calipso/a03_output/batch_export"  # 输出根目录

# 文件名匹配(可以改成 *.hdf)
FILE_GLOB = "CAL_LID_L2_VFM-Standard-*.hdf"

# 轨迹按多少 km 上色
TRACK_HEIGHT_KM = 4.0

# curtain 图高度上限(km)
CURTAIN_YMAX_KM = 30.0

# 过滤"跨图连线"的阈值(经纬度跳变超过阈值就断开)
DLON_MAX_DEG = 20.0
DLAT_MAX_DEG = 10.0
# ======================================================================

# 输出集中目录
CSV_DIR = os.path.join(OUT_ROOT, "csv")
FIG_DIR = os.path.join(OUT_ROOT, "fig")
os.makedirs(CSV_DIR, exist_ok=True)
os.makedirs(FIG_DIR, exist_ok=True)


# ===================== 1) HDF4 SDS 读取 =====================
def read_hdf4_sds(path, sds_name):
    """
    读取 HDF4 的一个 SDS 数据集。
    返回:
      arr: numpy.ndarray
      attrs: dict(属性)
    """
    from pyhdf.SD import SD, SDC
    h = SD(path, SDC.READ)
    sds = h.select(sds_name)
    arr = np.array(sds.get())
    attrs = sds.attributes()
    h.end()
    return arr, attrs


# ===================== 2) 从文件名提取时间标签 =====================
def extract_datetime_tag_from_filename(filename: str) -> str:
    """
    从 CALIPSO 文件名中提取时间标签(作为输出文件名前缀)
    例:
      CAL_LID_L2_VFM-Standard-V4-51.2011-01-03T06-12-40ZD.hdf
    返回:
      2011-01-03T06-12-40ZD
    若提取失败,则返回去掉后缀的文件名。
    """
    base = os.path.basename(filename)
    name = os.path.splitext(base)[0]  # 去掉 .hdf

    # 常见结构:... .2011-01-03T06-12-40ZD
    if "." in name:
        tag = name.split(".")[-1]
        if "T" in tag:  # 简单校验
            return tag
    return name


# ===================== 3) UTC 时间解析:yymmdd.ffffffff =====================
def utc_float_to_datetime64(utc_arr):
    """
    CALIPSO Profile_UTC_Time 常见格式:yymmdd.ffffffff
      - 整数部分是日期 yymmdd 或 yyyymmdd
      - 小数部分是"当天的比例",乘 86400 得到秒
    返回:numpy.datetime64[us] 数组(同 shape)
    """
    utc_arr = np.asarray(utc_arr, dtype=np.float64)
    flat = utc_arr.ravel()
    out = np.empty(flat.shape, dtype="datetime64[us]")

    for i, v in enumerate(flat):
        if not np.isfinite(v):
            out[i] = np.datetime64("NaT")
            continue

        ip = int(np.floor(v))
        frac = float(v - np.floor(v))

        # yymmdd vs yyyymmdd
        if ip < 1_000_000:
            yy = ip // 10000
            mm = (ip % 10000) // 100
            dd = ip % 100
            year = (1900 + yy) if yy >= 80 else (2000 + yy)
        else:
            year = ip // 10000
            mm = (ip % 10000) // 100
            dd = ip % 100

        try:
            base = datetime(year, mm, dd)
            dt = base + timedelta(seconds=frac * 86400.0)
            out[i] = np.datetime64(dt)
        except Exception:
            out[i] = np.datetime64("NaT")

    return out.reshape(utc_arr.shape)


# ===================== 4) 经纬度清洗:fillvalue -> NaN;经度归一化 [-180,180] =====================
def clean_latlon(lat, lon, fillvalue=-9999.0):
    lat = np.array(lat, dtype=np.float64)
    lon = np.array(lon, dtype=np.float64)
    lat[lat == fillvalue] = np.nan
    lon[lon == fillvalue] = np.nan
    lon = ((lon + 180.0) % 360.0) - 180.0
    return lat, lon


# ===================== 5) 5515 -> (nBlock,15,545) =====================
def reshape_vfm_to_profiles(flags_5515):
    """
    将 Feature_Classification_Flags (nBlock,5515) 展开到 (nBlock,15,545)

    5515 的 packing 结构(常用解读):
      高层: 3×55
      中层: 5×200
      低层: 15×290
    扩展到 15 条 profile:
      高层(3) repeat 5 -> 15
      中层(5) repeat 3 -> 15

    拼接后翻转高度轴,让第0个bin对应最低层(与高度数组一致)
    """
    f = np.asarray(flags_5515, dtype=np.uint16)
    nBlock, n = f.shape
    if n != 5515:
        raise ValueError(f"期望 flags 第二维=5515,但得到 {n}")

    # 高 -> 中 -> 低 的切片边界
    high = f[:, 0:165].reshape(nBlock, 3, 55)
    mid  = f[:, 165:1165].reshape(nBlock, 5, 200)
    low  = f[:, 1165:5515].reshape(nBlock, 15, 290)

    high15 = np.repeat(high, 5, axis=1)  # 3 -> 15
    mid15  = np.repeat(mid, 3, axis=1)   # 5 -> 15

    out = np.concatenate([high15, mid15, low], axis=2)  # (nBlock,15,545)
    out = out[:, :, ::-1]                               # 翻转为 低->高
    return out


# ===================== 6) 解码:只取 feature_type =====================
def decode_feature_type(val_uint16):
    """
    Feature Type 位段:最低 3 bits
    返回 uint8 数组:与输入 shape 相同
    """
    v = np.asarray(val_uint16, dtype=np.uint16)
    return ((v >> 0) & 0b111).astype(np.uint8)


# ===================== 7) 高度网格:545 bins 的 edges & centers =====================
def build_vfm_height_edges_centers_km():
    """
    VFM 高度结构(km):
      -0.5~8.2 km : 30 m  (290)
       8.2~20.2 km: 60 m  (200)
      20.2~30.1 km: 180 m (55)
    返回:
      edges:   (546,) bin边界(pcolormesh最推荐)
      centers: (545,) bin中心(用于找 4km 对应的 bin)
    """
    e1 = -0.5 + np.arange(290 + 1) * 0.03
    e2 =  8.2 + np.arange(200 + 1) * 0.06
    e3 = 20.2 + np.arange(55  + 1) * 0.18
    edges = np.concatenate([e1, e2[1:], e3[1:]])  # 546
    centers = 0.5 * (edges[:-1] + edges[1:])      # 545
    return edges, centers


# ===================== 8) 工具:强制拉平为 1D 并对齐长度 =====================
def to_1d(*arrays):
    outs = [np.asarray(a).reshape(-1) for a in arrays]
    n = min(x.size for x in outs)
    return [x[:n] for x in outs]


# ===================== 9) 绘图:轨迹(按高度某个bin的分类上色,过滤跨图连线) =====================
def plot_track_colored(lon, lat, ftype_1d, title, out_png, dlon_max=20.0, dlat_max=10.0):
    lon, lat, ftype_1d = to_1d(lon, lat, ftype_1d)

    colors = [
        "#FFFFFF",  # 0 invalid
        "#E6FFFF",  # 1 clear air
        "#87CEFA",  # 2 cloud
        "#FFD700",  # 3 aerosol
        "#FF3333",  # 4 stratospheric feature
        "#2E8B57",  # 5 surface
        "#006400",  # 6 subsurface
        "#000000",  # 7 no signal
    ]

    # 去 NaN
    ok = np.isfinite(lon) & np.isfinite(lat)
    lon = lon[ok]
    lat = lat[ok]
    types = ftype_1d[ok]

    if lon.size < 2:
        raise ValueError("有效轨迹点太少(<2),无法绘制轨迹。")

    # 相邻段
    p0 = np.column_stack([lon[:-1], lat[:-1]])
    p1 = np.column_stack([lon[1:],  lat[1:]])
    seg = np.stack([p0, p1], axis=1)

    # 过滤异常跳变(防止跨图蓝线)
    dlon = np.abs(lon[1:] - lon[:-1])
    dlat = np.abs(lat[1:] - lat[:-1])
    keep = (dlon <= dlon_max) & (dlat <= dlat_max)

    seg = seg[keep]
    seg_colors = [colors[int(t)] for t in types[:-1][keep]]

    if len(seg) < 1:
        raise ValueError("过滤跳变后没有可绘制线段,请放宽阈值或检查经纬度。")

    # cartopy(有就用底图)
    try:
        import cartopy.crs as ccrs
        import cartopy.feature as cfeature

        fig = plt.figure(figsize=(7.8, 5.6))
        ax = plt.axes(projection=ccrs.PlateCarree())
        ax.add_feature(cfeature.COASTLINE, linewidth=0.6)
        ax.add_feature(cfeature.BORDERS, linewidth=0.4)

        lc = LineCollection(seg, colors=seg_colors, linewidths=2.0, transform=ccrs.PlateCarree())
        ax.add_collection(lc)

        pad = 1.0
        ax.set_extent([np.nanmin(lon) - pad, np.nanmax(lon) + pad,
                       np.nanmin(lat) - pad, np.nanmax(lat) + pad],
                      crs=ccrs.PlateCarree())
        ax.set_title(title)
        plt.savefig(out_png, dpi=200, bbox_inches="tight")
        plt.close(fig)

    except Exception:
        # 无底图
        fig = plt.figure(figsize=(7.8, 5.6))
        ax = plt.gca()
        lc = LineCollection(seg, colors=seg_colors, linewidths=2.0)
        ax.add_collection(lc)
        ax.set_xlim(np.nanmin(lon) - 1.0, np.nanmax(lon) + 1.0)
        ax.set_ylim(np.nanmin(lat) - 1.0, np.nanmax(lat) + 1.0)
        ax.set_xlabel("Longitude (deg)")
        ax.set_ylabel("Latitude (deg)")
        ax.set_title(title)
        ax.grid(True, linestyle="--", linewidth=0.5)
        plt.savefig(out_png, dpi=200, bbox_inches="tight")
        plt.close(fig)


# ===================== 10) 绘图:Curtain(沿轨迹-高度) =====================
def plot_curtain(lon, lat, ftype_profile_bins, height_edges_km, title, out_png, y_max_km=30.0):
    lon, lat = to_1d(lon, lat)
    nProfiles = ftype_profile_bins.shape[0]
    n = min(nProfiles, lon.size, lat.size)

    ftype_profile_bins = ftype_profile_bins[:n, :]
    lon = lon[:n]
    lat = lat[:n]

    cmap = ListedColormap([
        "#FFFFFF", "#E6FFFF", "#87CEFA", "#FFD700", "#FF3333", "#2E8B57", "#006400", "#000000"
    ])
    norm = BoundaryNorm(np.arange(0, 9), cmap.N)

    x_edges = np.arange(n + 1)
    C = ftype_profile_bins.T  # (545, n)

    fig = plt.figure(figsize=(11.5, 4.3))
    ax = plt.gca()
    pm = ax.pcolormesh(x_edges, height_edges_km, C, cmap=cmap, norm=norm, shading="flat")

    ax.set_ylim(0, y_max_km)
    ax.set_ylabel("Height (km)")
    ax.set_title(title)

    ticks = np.linspace(0, n - 1, 6).astype(int)
    ax.set_xticks(ticks + 0.5)
    labels = []
    for i in ticks:
        lo, la = lon[i], lat[i]
        if np.isfinite(lo) and np.isfinite(la):
            lo_s = f"{abs(lo):.1f}°{'E' if lo >= 0 else 'W'}"
            la_s = f"{abs(la):.1f}°{'N' if la >= 0 else 'S'}"
            labels.append(f"{lo_s}\n{la_s}")
        else:
            labels.append("NaN\nNaN")
    ax.set_xticklabels(labels)

    ax.grid(True, linestyle="--", linewidth=0.5, alpha=0.6)

    cbar = plt.colorbar(pm, ax=ax, pad=0.01)
    cbar.set_ticks(np.arange(0.5, 8.5, 1.0))
    cbar.set_ticklabels([
        "invalid", "clear air", "cloud", "aerosol", "stratospheric feature", "surface", "subsurface", "no signal"
    ])

    plt.savefig(out_png, dpi=200, bbox_inches="tight")
    plt.close(fig)


# ===================== 11) CSV 输出 =====================
def write_profile_csv(lat, lon, utc_dt64, out_profile_csv, out_time_csv):
    lat, lon, utc_dt64 = to_1d(lat, lon, utc_dt64)

    with open(out_profile_csv, "w", newline="", encoding="utf-8-sig") as f:
        w = csv.writer(f)
        w.writerow(["profile_index", "lat_wgs84", "lon_wgs84", "utc_time"])
        for i in range(lat.size):
            w.writerow([
                i,
                "" if not np.isfinite(lat[i]) else float(lat[i]),
                "" if not np.isfinite(lon[i]) else float(lon[i]),
                str(utc_dt64[i])
            ])

    with open(out_time_csv, "w", newline="", encoding="utf-8-sig") as f:
        w = csv.writer(f)
        w.writerow(["profile_index", "utc_time"])
        for i in range(lat.size):
            w.writerow([i, str(utc_dt64[i])])


# ===================== 12) 单文件处理流程(输出集中到 CSV_DIR/FIG_DIR) =====================
def process_one_file(hdf_path):
    t_start = time.time()
    base = os.path.basename(hdf_path)
    tag = extract_datetime_tag_from_filename(base)

    print(f"\n[START] {base}")
    print(f"  - Output tag: {tag}")

    out_track = os.path.join(FIG_DIR, f"track_vfm_4km_{tag}.png")
    out_curtain = os.path.join(FIG_DIR, f"curtain_vfm_{tag}.png")
    out_csv = os.path.join(CSV_DIR, f"profiles_latlon_time_{tag}.csv")
    out_time = os.path.join(CSV_DIR, f"profiles_time_only_{tag}.csv")

    # ---------- 读取 ss ----------
    print("  - Reading ssLatitude/ssLongitude/ssProfile_UTC_Time ...")
    ssLat, _ = read_hdf4_sds(hdf_path, "ssLatitude")
    ssLon, _ = read_hdf4_sds(hdf_path, "ssLongitude")
    ssUTC, _ = read_hdf4_sds(hdf_path, "ssProfile_UTC_Time")

    lat, lon = clean_latlon(ssLat, ssLon, fillvalue=-9999.0)
    utc_dt64 = utc_float_to_datetime64(ssUTC)
    lat, lon, utc_dt64 = to_1d(lat, lon, utc_dt64)
    print(f"    ss profiles count = {lat.size}")

    # ---------- 读取 flags ----------
    print("  - Reading Feature_Classification_Flags ...")
    flags_5515, _ = read_hdf4_sds(hdf_path, "Feature_Classification_Flags")
    print(f"    flags_5515 shape = {flags_5515.shape}")

    print("  - Reshaping flags_5515 -> (nBlock,15,545) ...")
    flags_prof = reshape_vfm_to_profiles(flags_5515)
    print(f"    flags_prof shape = {flags_prof.shape}")

    print("  - Decoding feature_type ...")
    ftype = decode_feature_type(flags_prof)  # (nBlock,15,545)
    ftype_profiles = ftype.reshape(-1, ftype.shape[-1])  # (nProfiles,545)
    print(f"    ftype_profiles shape = {ftype_profiles.shape}")

    # ---------- 对齐长度 ----------
    n = min(lat.size, lon.size, utc_dt64.size, ftype_profiles.shape[0])
    lat = lat[:n]
    lon = lon[:n]
    utc_dt64 = utc_dt64[:n]
    ftype_profiles = ftype_profiles[:n, :]
    print(f"  - Aligned profile count = {n}")

    # ---------- 写 CSV ----------
    print("  - Writing CSV ...")
    write_profile_csv(lat, lon, utc_dt64, out_csv, out_time)
    print(f"    saved: {out_csv}")
    print(f"    saved: {out_time}")

    # ---------- 高度 ----------
    height_edges, height_centers = build_vfm_height_edges_centers_km()
    idx = int(np.argmin(np.abs(height_centers - TRACK_HEIGHT_KM)))
    used_km = float(height_centers[idx])
    ftype_4km = ftype_profiles[:, idx]

    # ---------- 绘图 ----------
    t0 = str(utc_dt64[0]) if n > 0 else "unknown"
    print("  - Plotting track ...")
    plot_track_colored(
        lon, lat, ftype_4km,
        title=f"{t0} | VFM at ~{used_km:.2f} km",
        out_png=out_track,
        dlon_max=DLON_MAX_DEG,
        dlat_max=DLAT_MAX_DEG,
    )
    print(f"    saved: {out_track}")

    print("  - Plotting curtain ...")
    plot_curtain(
        lon, lat, ftype_profiles, height_edges,
        title=f"VFM curtain | start: {t0}",
        out_png=out_curtain,
        y_max_km=CURTAIN_YMAX_KM
    )
    print(f"    saved: {out_curtain}")

    dt = time.time() - t_start
    print(f"[DONE ] {base}  (elapsed {dt:.1f}s)")


# ===================== 13) 主程序:批量处理 =====================
def main():
    os.makedirs(OUT_ROOT, exist_ok=True)
    os.makedirs(CSV_DIR, exist_ok=True)
    os.makedirs(FIG_DIR, exist_ok=True)

    files = sorted(glob.glob(os.path.join(IN_DIR, FILE_GLOB)))
    print("===============================================")
    print("CALIPSO VFM Batch Processor")
    print("IN_DIR   =", IN_DIR)
    print("OUT_ROOT =", OUT_ROOT)
    print("CSV_DIR  =", CSV_DIR)
    print("FIG_DIR  =", FIG_DIR)
    print("PATTERN  =", FILE_GLOB)
    print("FOUND    =", len(files), "files")
    print("===============================================")

    if not files:
        print("没有找到文件,请检查 IN_DIR 和 FILE_GLOB")
        return

    n_ok = 0
    n_fail = 0
    fail_list = []

    t_all = time.time()
    for i, f in enumerate(files, start=1):
        base = os.path.basename(f)
        print(f"\n==== [{i}/{len(files)}] Processing: {base} ====")
        try:
            process_one_file(f)
            n_ok += 1
        except Exception as e:
            n_fail += 1
            fail_list.append((base, str(e)))
            print(f"[ERROR] {base}")
            print("Reason:", e)
            print(traceback.format_exc())

    dt_all = time.time() - t_all
    print("\n===============================================")
    print("Batch Summary")
    print("Total:", len(files))
    print("OK   :", n_ok)
    print("Fail :", n_fail)
    print(f"Elapsed total: {dt_all:.1f}s")
    if fail_list:
        print("\nFailed files:")
        for b, msg in fail_list:
            print(" -", b, "|", msg)
    print("===============================================")


if __name__ == "__main__":
    main()
2、额外的特征信息解码:
python
# ===================== 6) 按位解码 =====================
def decode_feature_flags(val_uint16):
v = np.asarray(val_uint16, dtype=np.uint16)
feature_type = (v >> 0) & 0b111
feature_type_qa = (v >> 3) & 0b11
ice_water_phase = (v >> 5) & 0b11
ice_water_phase_qa = (v >> 7) & 0b11
feature_subtype = (v >> 9) & 0b111
type_confident = (v >> 12) & 0b1
horizontal_averaging = (v >> 13) & 0b111
return {
"feature_type": feature_type.astype(np.uint8),
"feature_type_qa": feature_type_qa.astype(np.uint8),
"ice_water_phase": ice_water_phase.astype(np.uint8),
"ice_water_phase_qa": ice_water_phase_qa.astype(np.uint8),
"feature_subtype": feature_subtype.astype(np.uint8),
"type_confident": type_confident.astype(np.uint8),
"horizontal_averaging": horizontal_averaging.astype(np.uint8),
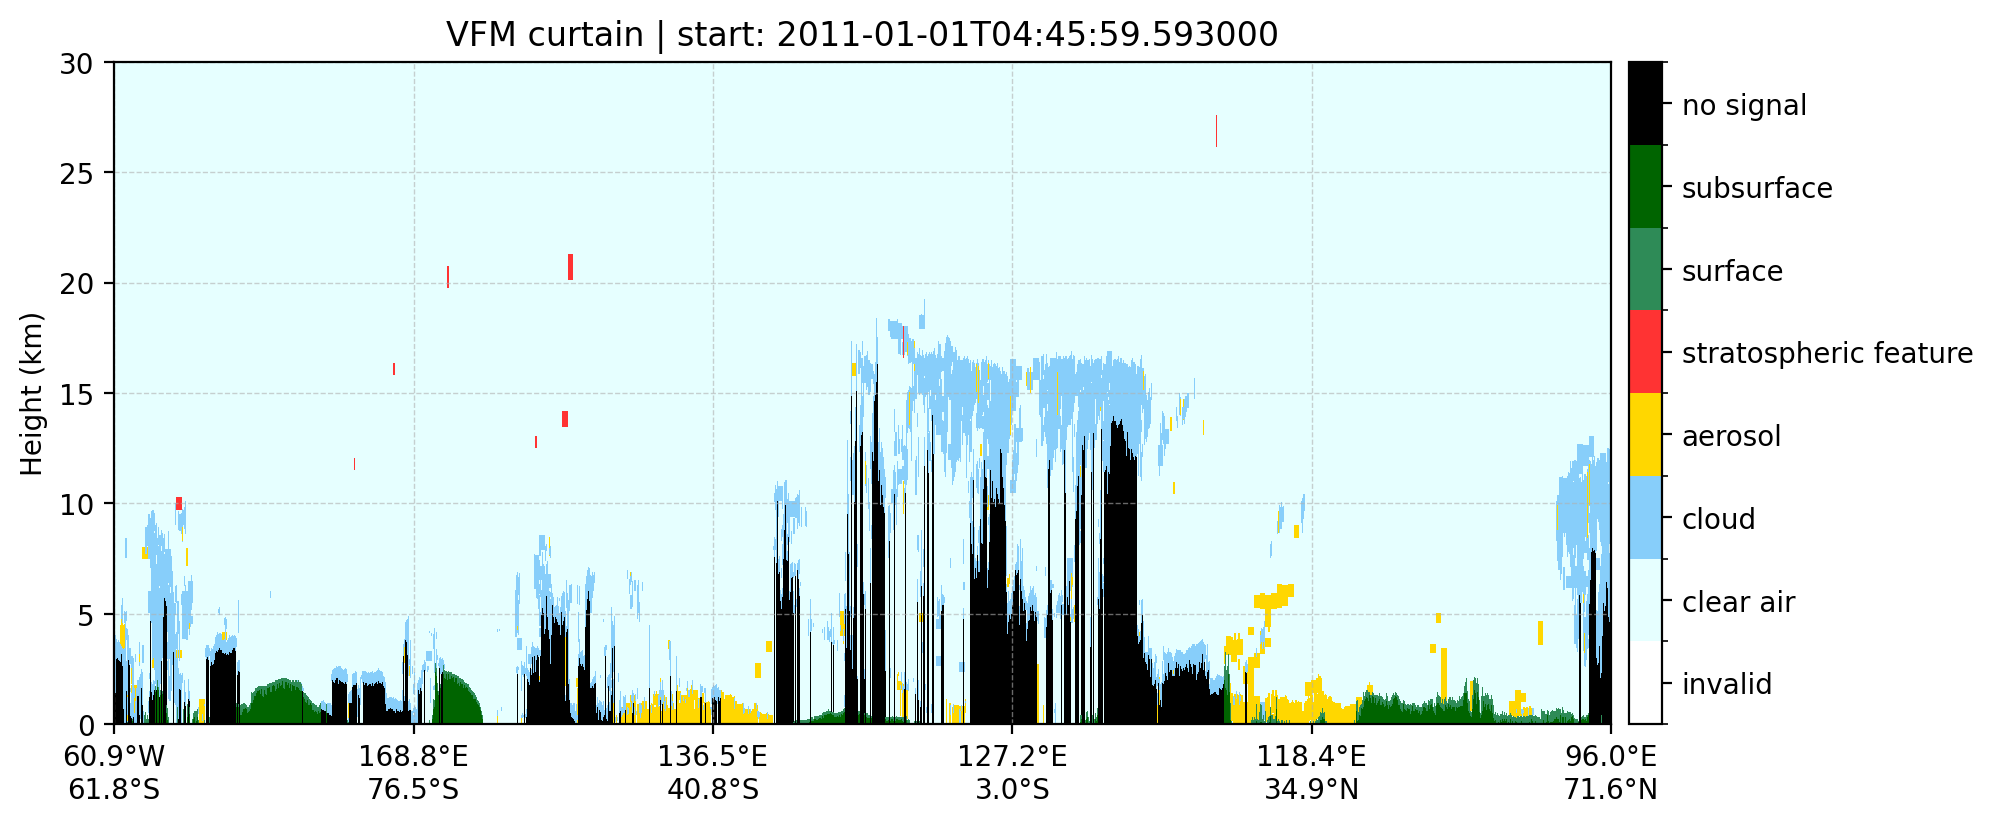
}3、效果展示图:
4、批量绘制子类型图
python
#!/usr/bin/env python3
# -*- coding: utf-8 -*-
"""
批量读取 CALIPSO VFM (HDF4) 文件,统一输出到两个文件夹:
OUT_ROOT/
csv/ -> 所有 CSV
fig/ -> 所有 PNG
输出内容(每个输入文件都会产生以下文件,文件名包含原始年月日时间 tag):
1) 主类型轨迹图(~4km):
track_vfm_4km_{tag}.png
2) 主类型 curtain(0-30km):
curtain_vfm_{tag}.png
3) 云子类型 curtain(仅 cloud bins 上色,其余留白):
curtain_cloud_subtype_{tag}.png
4) 气溶胶子类型 curtain(仅 aerosol bins 上色,其余留白):
curtain_aerosol_subtype_{tag}.png
5) 云子类型轨迹图(~4km,仅 cloud 段绘制):
track_cloud_subtype_4km_{tag}.png
6) 气溶胶子类型轨迹图(~4km,仅 aerosol 段绘制):
track_aerosol_subtype_4km_{tag}.png
7) CSV(每条 profile 的 lat/lon/time):
profiles_latlon_time_{tag}.csv
8) CSV(仅时间):
profiles_time_only_{tag}.csv
依赖:
- numpy
- matplotlib
- pyhdf (HDF4读取)
- (可选) cartopy:如果装了,会带海岸线/国界底图;没装也能画(无底图)
"""
import os
import csv
import glob
import time
import traceback
import numpy as np
import matplotlib.pyplot as plt
from datetime import datetime, timedelta
from matplotlib.colors import ListedColormap, BoundaryNorm
from matplotlib.collections import LineCollection
# ===================== 0) 用户配置区域(只需要改这里) =====================
IN_DIR = r"E:/haze_judge/test_calipso/test_read_calipso/a02_data" # 输入文件夹:放很多 .hdf
OUT_ROOT = r"E:/haze_judge/test_calipso/test_read_calipso/a03_output/batch_export2/" # 输出根目录
# 文件名匹配(你也可以改成 *.hdf)
FILE_GLOB = "CAL_LID_L2_VFM-Standard-*.hdf"
# 轨迹按多少 km 上色(主类型 & 子类型轨迹都用这个高度层)
TRACK_HEIGHT_KM = 4.0
# curtain 图高度上限(km)
CURTAIN_YMAX_KM = 30.0
# 过滤"跨图连线"的阈值(经纬度跳变超过阈值就断开)
DLON_MAX_DEG = 20.0
DLAT_MAX_DEG = 10.0
# ======================================================================
# 输出集中目录
CSV_DIR = os.path.join(OUT_ROOT, "csv")
FIG_DIR = os.path.join(OUT_ROOT, "fig")
os.makedirs(CSV_DIR, exist_ok=True)
os.makedirs(FIG_DIR, exist_ok=True)
# ===================== 1) HDF4 SDS 读取 =====================
def read_hdf4_sds(path, sds_name):
"""读取 HDF4 的一个 SDS 数据集。返回 (arr, attrs)."""
from pyhdf.SD import SD, SDC
h = SD(path, SDC.READ)
sds = h.select(sds_name)
arr = np.array(sds.get())
attrs = sds.attributes()
h.end()
return arr, attrs
# ===================== 2) 从文件名提取时间标签 =====================
def extract_datetime_tag_from_filename(filename: str) -> str:
"""
例:CAL_LID_L2_VFM-Standard-V4-51.2011-01-03T06-12-40ZD.hdf
返回:2011-01-03T06-12-40ZD
"""
base = os.path.basename(filename)
name = os.path.splitext(base)[0]
if "." in name:
tag = name.split(".")[-1]
if "T" in tag:
return tag
return name
# ===================== 3) UTC 时间解析:yymmdd.ffffffff =====================
def utc_float_to_datetime64(utc_arr):
"""
整数部分 yymmdd 或 yyyymmdd;小数部分为"当天比例",*86400 得秒。
"""
utc_arr = np.asarray(utc_arr, dtype=np.float64)
flat = utc_arr.ravel()
out = np.empty(flat.shape, dtype="datetime64[us]")
for i, v in enumerate(flat):
if not np.isfinite(v):
out[i] = np.datetime64("NaT")
continue
ip = int(np.floor(v))
frac = float(v - np.floor(v))
if ip < 1_000_000:
yy = ip // 10000
mm = (ip % 10000) // 100
dd = ip % 100
year = (1900 + yy) if yy >= 80 else (2000 + yy)
else:
year = ip // 10000
mm = (ip % 10000) // 100
dd = ip % 100
try:
base = datetime(year, mm, dd)
dt = base + timedelta(seconds=frac * 86400.0)
out[i] = np.datetime64(dt)
except Exception:
out[i] = np.datetime64("NaT")
return out.reshape(utc_arr.shape)
# ===================== 4) 经纬度清洗 =====================
def clean_latlon(lat, lon, fillvalue=-9999.0):
lat = np.array(lat, dtype=np.float64)
lon = np.array(lon, dtype=np.float64)
lat[lat == fillvalue] = np.nan
lon[lon == fillvalue] = np.nan
lon = ((lon + 180.0) % 360.0) - 180.0
return lat, lon
# ===================== 5) 5515 -> (nBlock,15,545) =====================
def reshape_vfm_to_profiles(flags_5515):
"""
将 Feature_Classification_Flags (nBlock,5515) 展开到 (nBlock,15,545)
packing(常用解读):
high: 3×55
mid : 5×200
low : 15×290
扩展到 15 profiles: 简单粗暴,直接复制的,不插值类似插值
high(3) repeat 5 -> 15
mid(5) repeat 3 -> 15
拼接后翻转高度轴,让第0个bin对应最低层
"""
f = np.asarray(flags_5515, dtype=np.uint16)
nBlock, n = f.shape
if n != 5515:
raise ValueError(f"期望 flags 第二维=5515,但得到 {n}")
high = f[:, 0:165].reshape(nBlock, 3, 55)
mid = f[:, 165:1165].reshape(nBlock, 5, 200)
low = f[:, 1165:5515].reshape(nBlock, 15, 290)
high15 = np.repeat(high, 5, axis=1)
mid15 = np.repeat(mid, 3, axis=1)
out = np.concatenate([high15, mid15, low], axis=2) # 高->中->低
out = out[:, :, ::-1] # 翻转为 低->高
return out
# ===================== 6) 解码:feature_type + feature_subtype =====================
def decode_feature_type_and_subtype(val_uint16):
"""
CALIPSO VFM flag 16-bit 字段(常用IDL解码):
feature_type : bits 0-2 (3 bits)
feature_subtype : bits 9-11 (3 bits)
注意:subtype 的含义依赖 feature_type:
- feature_type==2 (cloud) -> cloud subtype
- feature_type==3 (aerosol) -> aerosol subtype
- feature_type==4 (strat) -> strat subtype(这里不画)
"""
v = np.asarray(val_uint16, dtype=np.uint16)
feature_type = ((v >> 0) & 0b111).astype(np.uint8)
feature_subtype = ((v >> 9) & 0b111).astype(np.uint8)
return feature_type, feature_subtype
# ===================== 7) 高度网格:545 bins 的 edges & centers =====================
def build_vfm_height_edges_centers_km():
e1 = -0.5 + np.arange(290 + 1) * 0.03
e2 = 8.2 + np.arange(200 + 1) * 0.06
e3 = 20.2 + np.arange(55 + 1) * 0.18
edges = np.concatenate([e1, e2[1:], e3[1:]]) # 546
centers = 0.5 * (edges[:-1] + edges[1:]) # 545
return edges, centers
# ===================== 8) 工具:强制拉平为 1D 并对齐长度 =====================
def to_1d(*arrays):
outs = [np.asarray(a).reshape(-1) for a in arrays]
n = min(x.size for x in outs)
return [x[:n] for x in outs]
# ===================== 9) 主类型颜色/标签 =====================
FEATURE_TYPE_COLORS = [
"#FFFFFF", # 0 invalid
"#E6FFFF", # 1 clear air
"#87CEFA", # 2 cloud
"#FFD700", # 3 aerosol
"#FF3333", # 4 stratospheric feature
"#2E8B57", # 5 surface
"#006400", # 6 subsurface
"#000000", # 7 no signal
]
FEATURE_TYPE_LABELS = [
"invalid",
"clear air",
"cloud",
"aerosol",
"stratospheric feature",
"surface",
"subsurface",
"no signal",
]
# ===================== 10) 子类型标签(0-7) =====================
CLOUD_SUBTYPE_LABELS = [
"low overcast (transp.)",
"low overcast (opaque)",
"transition stratocumulus",
"low broken cumulus",
"altocumulus (transp.)",
"altostratus (opaque)",
"cirrus (transp.)",
"deep convective (opaque)",
]
AEROSOL_SUBTYPE_LABELS = [
"not determined",
"clean marine",
"dust",
"polluted continental",
"clean continental",
"polluted dust",
"smoke",
"other",
]
# ===================== 11) 绘图:主类型轨迹(~4km) =====================
def plot_track_feature_type(lon, lat, ftype_1d, title, out_png, dlon_max=20.0, dlat_max=10.0):
lon, lat, ftype_1d = to_1d(lon, lat, ftype_1d)
ok = np.isfinite(lon) & np.isfinite(lat)
lon = lon[ok]
lat = lat[ok]
types = ftype_1d[ok]
if lon.size < 2:
raise ValueError("有效轨迹点太少(<2),无法绘制轨迹。")
p0 = np.column_stack([lon[:-1], lat[:-1]])
p1 = np.column_stack([lon[1:], lat[1:]])
seg = np.stack([p0, p1], axis=1)
dlon = np.abs(lon[1:] - lon[:-1])
dlat = np.abs(lat[1:] - lat[:-1])
keep = (dlon <= dlon_max) & (dlat <= dlat_max)
seg = seg[keep]
seg_colors = [FEATURE_TYPE_COLORS[int(t)] for t in types[:-1][keep]]
if len(seg) < 1:
raise ValueError("过滤跳变后没有可绘制线段,放宽阈值或检查经纬度。")
try:
import cartopy.crs as ccrs
import cartopy.feature as cfeature
fig = plt.figure(figsize=(7.8, 5.6))
ax = plt.axes(projection=ccrs.PlateCarree())
ax.add_feature(cfeature.COASTLINE, linewidth=0.6)
ax.add_feature(cfeature.BORDERS, linewidth=0.4)
lc = LineCollection(seg, colors=seg_colors, linewidths=2.0, transform=ccrs.PlateCarree())
ax.add_collection(lc)
pad = 1.0
ax.set_extent([np.nanmin(lon) - pad, np.nanmax(lon) + pad,
np.nanmin(lat) - pad, np.nanmax(lat) + pad],
crs=ccrs.PlateCarree())
ax.set_title(title)
plt.savefig(out_png, dpi=200, bbox_inches="tight")
plt.close(fig)
except Exception:
fig = plt.figure(figsize=(7.8, 5.6))
ax = plt.gca()
lc = LineCollection(seg, colors=seg_colors, linewidths=2.0)
ax.add_collection(lc)
ax.set_xlim(np.nanmin(lon) - 1.0, np.nanmax(lon) + 1.0)
ax.set_ylim(np.nanmin(lat) - 1.0, np.nanmax(lat) + 1.0)
ax.set_xlabel("Longitude (deg)")
ax.set_ylabel("Latitude (deg)")
ax.set_title(title)
ax.grid(True, linestyle="--", linewidth=0.5)
plt.savefig(out_png, dpi=200, bbox_inches="tight")
plt.close(fig)
# ===================== 12) 绘图:子类型轨迹(~4km,仅绘制目标类型段) =====================
def plot_track_subtype_only(lon, lat, ftype_1d, fsub_1d, target_type, subtype_labels, title, out_png,
dlon_max=20.0, dlat_max=10.0):
"""
只绘制 ftype==target_type 的线段,颜色按 subtype(0-7)。
target_type:
cloud -> 2
aerosol -> 3
"""
lon, lat, ftype_1d, fsub_1d = to_1d(lon, lat, ftype_1d, fsub_1d)
# 定义 8 种 subtype 颜色(你可以按喜好替换)
subtype_colors = [
"#1f77b4", "#2ca02c", "#ff7f0e", "#d62728",
"#9467bd", "#8c564b", "#e377c2", "#7f7f7f"
]
# 逐段判断更稳:避免"只筛点"导致段索引错位
lon0 = lon[:-1]; lon1 = lon[1:]
lat0 = lat[:-1]; lat1 = lat[1:]
t0 = ftype_1d[:-1]; t1 = ftype_1d[1:]
s0 = fsub_1d[:-1]
ok = np.isfinite(lon0) & np.isfinite(lat0) & np.isfinite(lon1) & np.isfinite(lat1)
jump = (np.abs(lon1 - lon0) <= dlon_max) & (np.abs(lat1 - lat0) <= dlat_max)
tgt = (t0 == target_type) & (t1 == target_type) # 两端都必须是目标类型,避免跨类别连线
keep = ok & jump & tgt
if np.count_nonzero(keep) < 1:
raise ValueError("没有可绘制的目标子类型线段(可能该高度层没有目标类型/或被跳变过滤)。")
seg = np.stack([np.column_stack([lon0[keep], lat0[keep]]),
np.column_stack([lon1[keep], lat1[keep]])], axis=1)
seg_colors = [subtype_colors[int(ss)] for ss in s0[keep]]
# 画图(cartopy可选)
try:
import cartopy.crs as ccrs
import cartopy.feature as cfeature
fig = plt.figure(figsize=(7.8, 5.6))
ax = plt.axes(projection=ccrs.PlateCarree())
ax.add_feature(cfeature.COASTLINE, linewidth=0.6)
ax.add_feature(cfeature.BORDERS, linewidth=0.4)
lc = LineCollection(seg, colors=seg_colors, linewidths=2.4, transform=ccrs.PlateCarree())
ax.add_collection(lc)
pad = 1.0
all_lon = np.concatenate([lon0[keep], lon1[keep]])
all_lat = np.concatenate([lat0[keep], lat1[keep]])
ax.set_extent([np.nanmin(all_lon) - pad, np.nanmax(all_lon) + pad,
np.nanmin(all_lat) - pad, np.nanmax(all_lat) + pad],
crs=ccrs.PlateCarree())
ax.set_title(title)
# 简单图例(8类)
from matplotlib.lines import Line2D
handles = [Line2D([0], [0], color=subtype_colors[i], lw=3, label=f"{i}: {subtype_labels[i]}")
for i in range(8)]
ax.legend(handles=handles, loc="upper right", frameon=True, fontsize=8)
plt.savefig(out_png, dpi=200, bbox_inches="tight")
plt.close(fig)
except Exception:
fig = plt.figure(figsize=(7.8, 5.6))
ax = plt.gca()
lc = LineCollection(seg, colors=seg_colors, linewidths=2.4)
ax.add_collection(lc)
all_lon = np.concatenate([lon0[keep], lon1[keep]])
all_lat = np.concatenate([lat0[keep], lat1[keep]])
ax.set_xlim(np.nanmin(all_lon) - 1.0, np.nanmax(all_lon) + 1.0)
ax.set_ylim(np.nanmin(all_lat) - 1.0, np.nanmax(all_lat) + 1.0)
ax.set_xlabel("Longitude (deg)")
ax.set_ylabel("Latitude (deg)")
ax.set_title(title)
ax.grid(True, linestyle="--", linewidth=0.5)
from matplotlib.lines import Line2D
handles = [Line2D([0], [0], color=subtype_colors[i], lw=3, label=f"{i}: {subtype_labels[i]}")
for i in range(8)]
ax.legend(handles=handles, loc="upper right", frameon=True, fontsize=8)
plt.savefig(out_png, dpi=200, bbox_inches="tight")
plt.close(fig)
# ===================== 13) 绘图:主类型 Curtain =====================
def plot_curtain_feature_type(lon, lat, ftype_profile_bins, height_edges_km, title, out_png, y_max_km=30.0):
lon, lat = to_1d(lon, lat)
nProfiles = ftype_profile_bins.shape[0]
n = min(nProfiles, lon.size, lat.size)
ftype_profile_bins = ftype_profile_bins[:n, :]
lon = lon[:n]
lat = lat[:n]
cmap = ListedColormap(FEATURE_TYPE_COLORS)
norm = BoundaryNorm(np.arange(0, 9), cmap.N)
x_edges = np.arange(n + 1)
C = ftype_profile_bins.T # (545, n)
fig = plt.figure(figsize=(11.5, 4.3))
ax = plt.gca()
pm = ax.pcolormesh(x_edges, height_edges_km, C, cmap=cmap, norm=norm, shading="flat")
ax.set_ylim(0, y_max_km)
ax.set_ylabel("Height (km)")
ax.set_title(title)
ticks = np.linspace(0, n - 1, 6).astype(int)
ax.set_xticks(ticks + 0.5)
labels = []
for i in ticks:
lo, la = lon[i], lat[i]
if np.isfinite(lo) and np.isfinite(la):
lo_s = f"{abs(lo):.1f}°{'E' if lo >= 0 else 'W'}"
la_s = f"{abs(la):.1f}°{'N' if la >= 0 else 'S'}"
labels.append(f"{lo_s}\n{la_s}")
else:
labels.append("NaN\nNaN")
ax.set_xticklabels(labels)
ax.grid(True, linestyle="--", linewidth=0.5, alpha=0.6)
cbar = plt.colorbar(pm, ax=ax, pad=0.01)
cbar.set_ticks(np.arange(0.5, 8.5, 1.0))
cbar.set_ticklabels(FEATURE_TYPE_LABELS)
plt.savefig(out_png, dpi=200, bbox_inches="tight")
plt.close(fig)
# ===================== 14) 绘图:子类型 Curtain(仅 cloud 或 aerosol bins 上色) =====================
def plot_curtain_subtype_only(lon, lat, ftype_bins, fsub_bins, height_edges_km,
target_type, subtype_labels, title, out_png, y_max_km=30.0):
"""
只对指定类型(target_type)的bin上色,其他类型显示为白色背景。
target_type:
cloud -> 2
aerosol -> 3
"""
lon, lat = to_1d(lon, lat)
nProfiles = ftype_bins.shape[0]
n = min(nProfiles, lon.size, lat.size)
ftype_bins = ftype_bins[:n, :]
fsub_bins = fsub_bins[:n, :]
lon = lon[:n]
lat = lat[:n]
# 构造显示数组:背景=-1,subtype=0..7
show = np.full_like(fsub_bins, fill_value=-1, dtype=np.int16)
m = (ftype_bins == target_type)
show[m] = fsub_bins[m].astype(np.int16)
# 为了用 ListedColormap,做一次 shift:背景(-1)->0;subtype0->1 ... subtype7->8
show = show + 1 # now in [0..8]
# 颜色:0 是背景(白),1..8 是 subtype 0..7
subtype_colors = [
"#FFFFFF", # background
"#1f77b4", "#2ca02c", "#ff7f0e", "#d62728",
"#9467bd", "#8c564b", "#e377c2", "#7f7f7f"
]
cmap = ListedColormap(subtype_colors)
norm = BoundaryNorm(np.arange(-0.5, 9.5, 1.0), cmap.N)
x_edges = np.arange(n + 1)
C = show.T # (545, n)
fig = plt.figure(figsize=(11.5, 4.3))
ax = plt.gca()
pm = ax.pcolormesh(x_edges, height_edges_km, C, cmap=cmap, norm=norm, shading="flat")
ax.set_ylim(0, y_max_km)
ax.set_ylabel("Height (km)")
ax.set_title(title)
ticks = np.linspace(0, n - 1, 6).astype(int)
ax.set_xticks(ticks + 0.5)
labels = []
for i in ticks:
lo, la = lon[i], lat[i]
if np.isfinite(lo) and np.isfinite(la):
lo_s = f"{abs(lo):.1f}°{'E' if lo >= 0 else 'W'}"
la_s = f"{abs(la):.1f}°{'N' if la >= 0 else 'S'}"
labels.append(f"{lo_s}\n{la_s}")
else:
labels.append("NaN\nNaN")
ax.set_xticklabels(labels)
ax.grid(True, linestyle="--", linewidth=0.5, alpha=0.6)
# colorbar:只显示 subtype(1..8)
cbar = plt.colorbar(pm, ax=ax, pad=0.01)
cbar.set_ticks(np.arange(1.0, 9.0, 1.0))
cbar.set_ticklabels([f"{i}: {subtype_labels[i]}" for i in range(8)])
plt.savefig(out_png, dpi=200, bbox_inches="tight")
plt.close(fig)
# ===================== 15) CSV 输出 =====================
def write_profile_csv(lat, lon, utc_dt64, out_profile_csv, out_time_csv):
lat, lon, utc_dt64 = to_1d(lat, lon, utc_dt64)
with open(out_profile_csv, "w", newline="", encoding="utf-8-sig") as f:
w = csv.writer(f)
w.writerow(["profile_index", "lat_wgs84", "lon_wgs84", "utc_time"])
for i in range(lat.size):
w.writerow([
i,
"" if not np.isfinite(lat[i]) else float(lat[i]),
"" if not np.isfinite(lon[i]) else float(lon[i]),
str(utc_dt64[i])
])
with open(out_time_csv, "w", newline="", encoding="utf-8-sig") as f:
w = csv.writer(f)
w.writerow(["profile_index", "utc_time"])
for i in range(lat.size):
w.writerow([i, str(utc_dt64[i])])
# ===================== 16) 单文件处理流程 =====================
def process_one_file(hdf_path):
t_start = time.time()
base = os.path.basename(hdf_path)
tag = extract_datetime_tag_from_filename(base)
print(f"\n[START] {base}")
print(f" - Output tag: {tag}")
# 输出文件名(主类型)
out_track_type = os.path.join(FIG_DIR, f"track_vfm_4km_{tag}.png")
out_curtain_type = os.path.join(FIG_DIR, f"curtain_vfm_{tag}.png")
# 输出文件名(子类型)
out_curtain_cloud = os.path.join(FIG_DIR, f"curtain_cloud_subtype_{tag}.png")
out_curtain_aer = os.path.join(FIG_DIR, f"curtain_aerosol_subtype_{tag}.png")
out_track_cloud = os.path.join(FIG_DIR, f"track_cloud_subtype_4km_{tag}.png")
out_track_aer = os.path.join(FIG_DIR, f"track_aerosol_subtype_4km_{tag}.png")
# CSV
out_csv = os.path.join(CSV_DIR, f"profiles_latlon_time_{tag}.csv")
out_time = os.path.join(CSV_DIR, f"profiles_time_only_{tag}.csv")
# ---------- 读取 ss ----------
print(" - Reading ssLatitude/ssLongitude/ssProfile_UTC_Time ...")
ssLat, _ = read_hdf4_sds(hdf_path, "ssLatitude")
ssLon, _ = read_hdf4_sds(hdf_path, "ssLongitude")
ssUTC, _ = read_hdf4_sds(hdf_path, "ssProfile_UTC_Time")
lat, lon = clean_latlon(ssLat, ssLon, fillvalue=-9999.0)
utc_dt64 = utc_float_to_datetime64(ssUTC)
lat, lon, utc_dt64 = to_1d(lat, lon, utc_dt64)
print(f" ss profiles count = {lat.size}")
# ---------- 读取 flags ----------
print(" - Reading Feature_Classification_Flags ...")
flags_5515, _ = read_hdf4_sds(hdf_path, "Feature_Classification_Flags")
print(f" flags_5515 shape = {flags_5515.shape}")
print(" - Reshaping flags_5515 -> (nBlock,15,545) ...")
flags_prof = reshape_vfm_to_profiles(flags_5515)
print(f" flags_prof shape = {flags_prof.shape}")
print(" - Decoding feature_type & feature_subtype ...")
ftype_3d, fsub_3d = decode_feature_type_and_subtype(flags_prof) # (nBlock,15,545)
ftype_profiles = ftype_3d.reshape(-1, ftype_3d.shape[-1]) # (nProfiles,545)
fsub_profiles = fsub_3d.reshape(-1, fsub_3d.shape[-1]) # (nProfiles,545)
print(f" ftype_profiles shape = {ftype_profiles.shape}")
print(f" fsub_profiles shape = {fsub_profiles.shape}")
# ---------- 对齐长度 ----------
n = min(lat.size, lon.size, utc_dt64.size, ftype_profiles.shape[0], fsub_profiles.shape[0])
lat = lat[:n]
lon = lon[:n]
utc_dt64 = utc_dt64[:n]
ftype_profiles = ftype_profiles[:n, :]
fsub_profiles = fsub_profiles[:n, :]
print(f" - Aligned profile count = {n}")
# ---------- 写 CSV ----------
print(" - Writing CSV ...")
write_profile_csv(lat, lon, utc_dt64, out_csv, out_time)
print(f" saved: {out_csv}")
print(f" saved: {out_time}")
# ---------- 高度 ----------
height_edges, height_centers = build_vfm_height_edges_centers_km()
idx = int(np.argmin(np.abs(height_centers - TRACK_HEIGHT_KM)))
used_km = float(height_centers[idx])
# 该高度层的 type/subtype(用于轨迹)
ftype_h = ftype_profiles[:, idx]
fsub_h = fsub_profiles[:, idx]
# ---------- 标题 ----------
t0 = str(utc_dt64[0]) if n > 0 else "unknown"
title_track_type = f"{t0} | VFM type at ~{used_km:.2f} km"
title_curtain_type = f"VFM curtain (type) | start: {t0}"
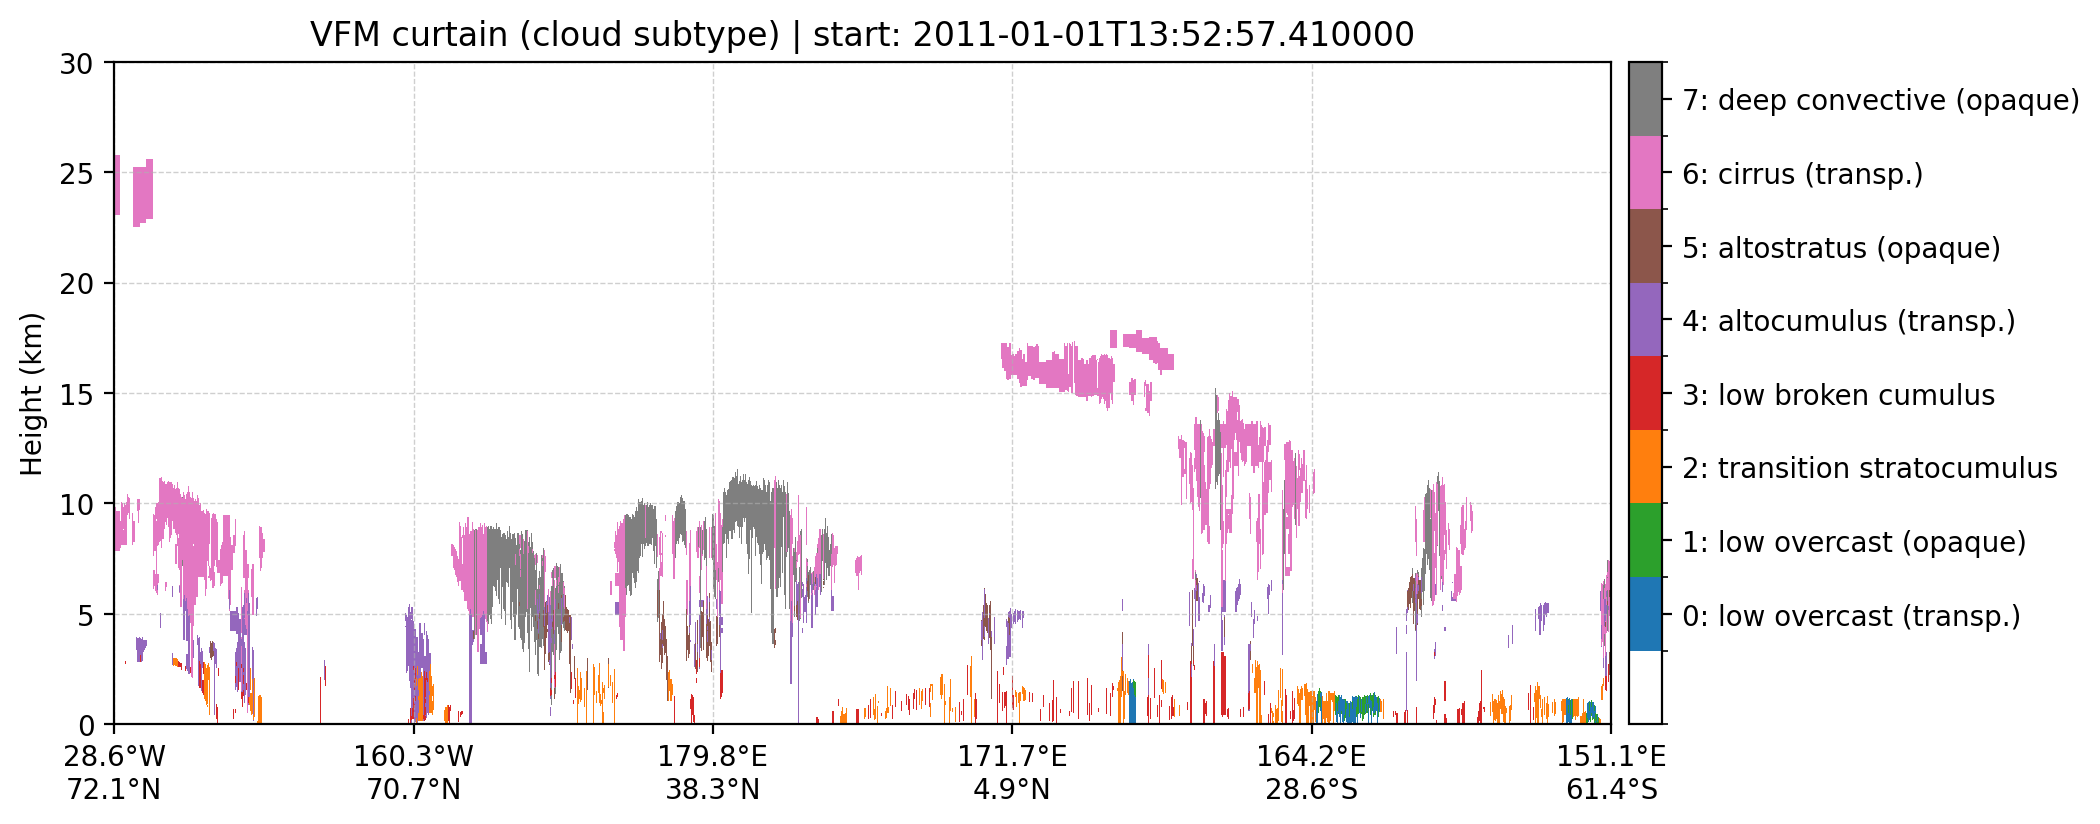
title_curtain_cloud = f"VFM curtain (cloud subtype) | start: {t0}"
title_curtain_aer = f"VFM curtain (aerosol subtype) | start: {t0}"
title_track_cloud = f"{t0} | Cloud subtype at ~{used_km:.2f} km"
title_track_aer = f"{t0} | Aerosol subtype at ~{used_km:.2f} km"
# ---------- 绘图:主类型轨迹 ----------
print(" - Plotting track (feature type) ...")
plot_track_feature_type(
lon, lat, ftype_h,
title=title_track_type,
out_png=out_track_type,
dlon_max=DLON_MAX_DEG,
dlat_max=DLAT_MAX_DEG,
)
print(f" saved: {out_track_type}")
# ---------- 绘图:主类型 curtain ----------
print(" - Plotting curtain (feature type) ...")
plot_curtain_feature_type(
lon, lat, ftype_profiles, height_edges,
title=title_curtain_type,
out_png=out_curtain_type,
y_max_km=CURTAIN_YMAX_KM
)
print(f" saved: {out_curtain_type}")
# ---------- 绘图:云子类型 curtain(仅 cloud bins 上色) ----------
print(" - Plotting curtain (cloud subtype only) ...")
plot_curtain_subtype_only(
lon, lat, ftype_profiles, fsub_profiles, height_edges,
target_type=2,
subtype_labels=CLOUD_SUBTYPE_LABELS,
title=title_curtain_cloud,
out_png=out_curtain_cloud,
y_max_km=CURTAIN_YMAX_KM
)
print(f" saved: {out_curtain_cloud}")
# ---------- 绘图:气溶胶子类型 curtain(仅 aerosol bins 上色) ----------
print(" - Plotting curtain (aerosol subtype only) ...")
plot_curtain_subtype_only(
lon, lat, ftype_profiles, fsub_profiles, height_edges,
target_type=3,
subtype_labels=AEROSOL_SUBTYPE_LABELS,
title=title_curtain_aer,
out_png=out_curtain_aer,
y_max_km=CURTAIN_YMAX_KM
)
print(f" saved: {out_curtain_aer}")
# ---------- 绘图:云子类型轨迹(仅 cloud 段绘制) ----------
print(" - Plotting track (cloud subtype only) ...")
try:
plot_track_subtype_only(
lon, lat, ftype_h, fsub_h,
target_type=2,
subtype_labels=CLOUD_SUBTYPE_LABELS,
title=title_track_cloud,
out_png=out_track_cloud,
dlon_max=DLON_MAX_DEG,
dlat_max=DLAT_MAX_DEG,
)
print(f" saved: {out_track_cloud}")
except Exception as e:
print(f" [skip] cloud subtype track not generated: {e}")
# ---------- 绘图:气溶胶子类型轨迹(仅 aerosol 段绘制) ----------
print(" - Plotting track (aerosol subtype only) ...")
try:
plot_track_subtype_only(
lon, lat, ftype_h, fsub_h,
target_type=3,
subtype_labels=AEROSOL_SUBTYPE_LABELS,
title=title_track_aer,
out_png=out_track_aer,
dlon_max=DLON_MAX_DEG,
dlat_max=DLAT_MAX_DEG,
)
print(f" saved: {out_track_aer}")
except Exception as e:
print(f" [skip] aerosol subtype track not generated: {e}")
dt = time.time() - t_start
print(f"[DONE ] {base} (elapsed {dt:.1f}s)")
# ===================== 17) 主程序:批量处理 =====================
def main():
os.makedirs(OUT_ROOT, exist_ok=True)
os.makedirs(CSV_DIR, exist_ok=True)
os.makedirs(FIG_DIR, exist_ok=True)
files = sorted(glob.glob(os.path.join(IN_DIR, FILE_GLOB)))
print("===============================================")
print("CALIPSO VFM Batch Processor (type + subtype plots)")
print("IN_DIR =", IN_DIR)
print("OUT_ROOT =", OUT_ROOT)
print("CSV_DIR =", CSV_DIR)
print("FIG_DIR =", FIG_DIR)
print("PATTERN =", FILE_GLOB)
print("FOUND =", len(files), "files")
print("===============================================")
if not files:
print("没有找到文件,请检查 IN_DIR 和 FILE_GLOB")
return
n_ok = 0
n_fail = 0
fail_list = []
t_all = time.time()
for i, f in enumerate(files, start=1):
base = os.path.basename(f)
print(f"\n==== [{i}/{len(files)}] Processing: {base} ====")
try:
process_one_file(f)
n_ok += 1
except Exception as e:
n_fail += 1
fail_list.append((base, str(e)))
print(f"[ERROR] {base}")
print("Reason:", e)
print(traceback.format_exc())
dt_all = time.time() - t_all
print("\n===============================================")
print("Batch Summary")
print("Total:", len(files))
print("OK :", n_ok)
print("Fail :", n_fail)
print(f"Elapsed total: {dt_all:.1f}s")
if fail_list:
print("\nFailed files:")
for b, msg in fail_list:
print(" -", b, "|", msg)
print("===============================================")
if __name__ == "__main__":
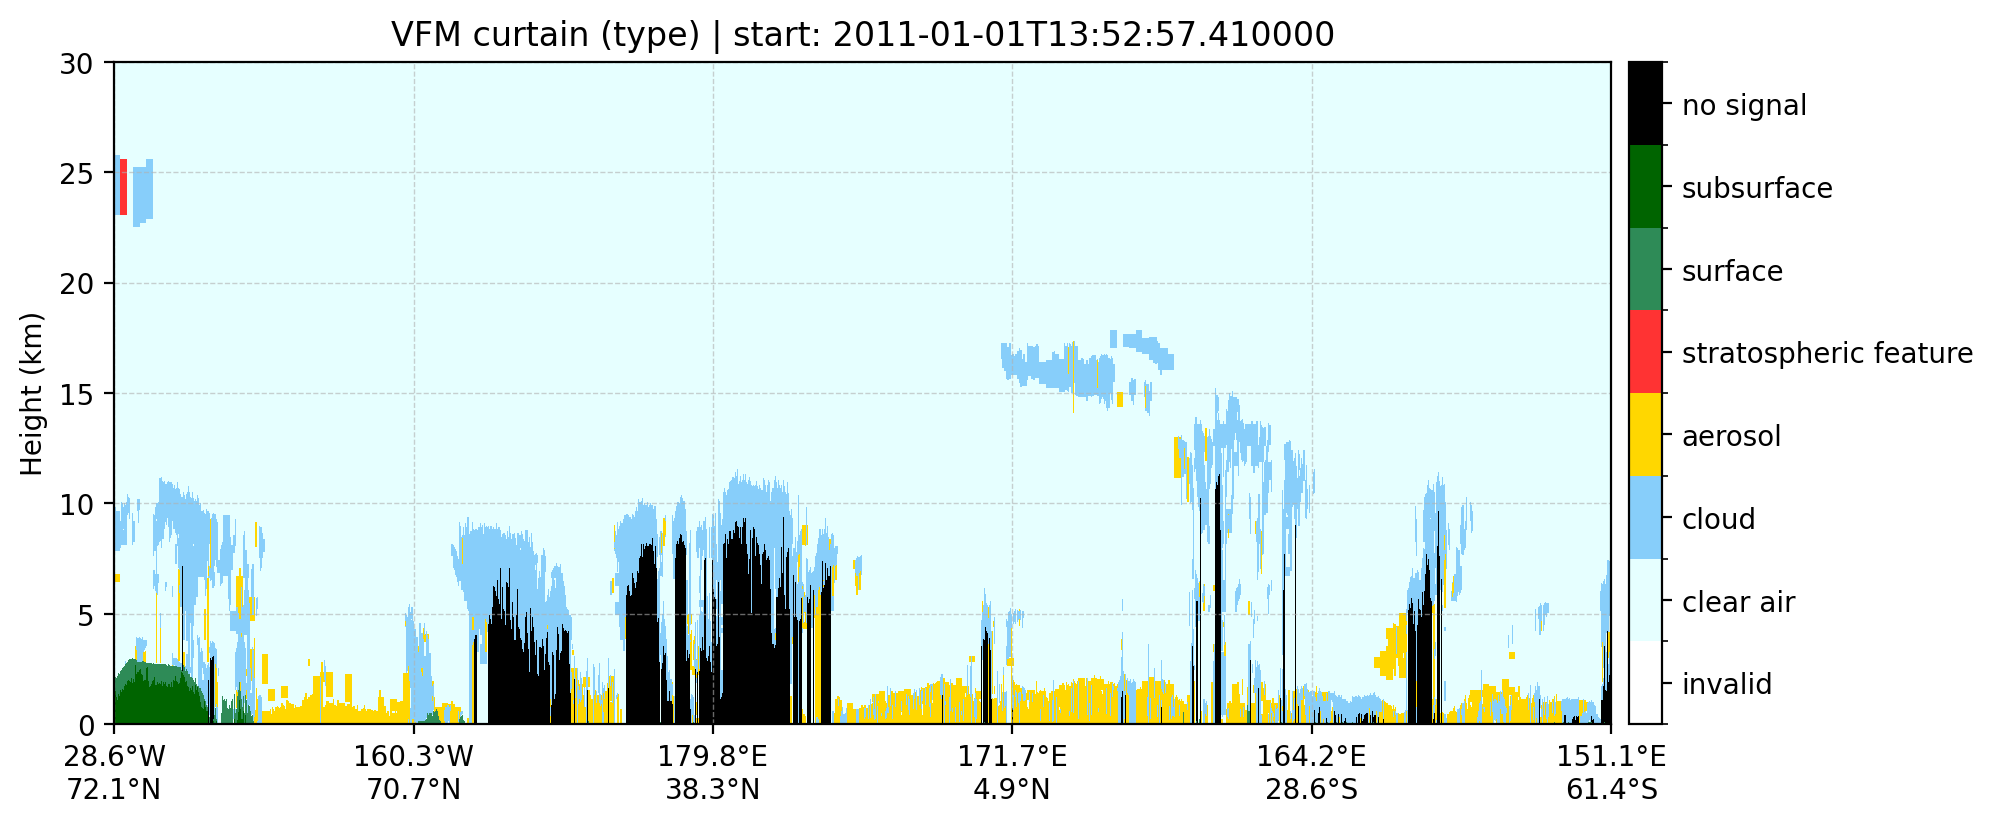
main()5、效果展示图
5.1、主类型:
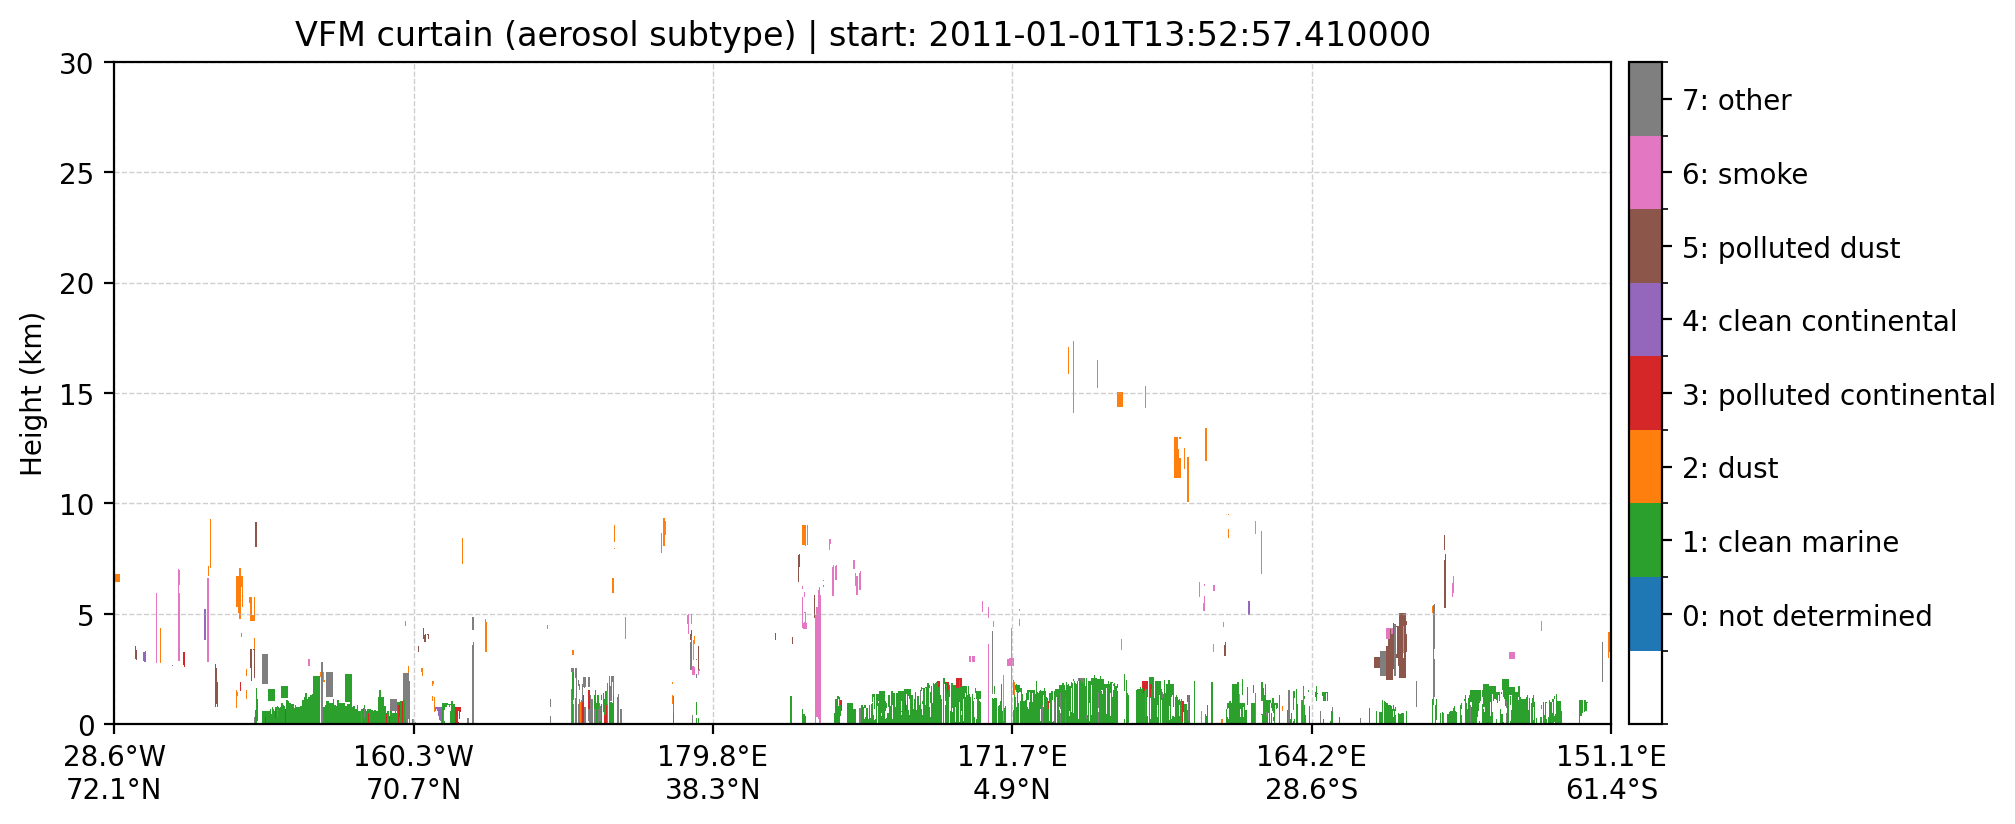
5.2、气溶胶:
5.3、云类型:
6、补充信息
bash
#!/usr/bin/env python3
# -*- coding: utf-8 -*-

"""
===============================================================================
CALIPSO VFM 批量读取 + 主类型/子类型可视化 + CSV 导出(HDF4)
===============================================================================

一、CALIPSO / CALIOP / VFM 是什么?
--------------------------------
1) CALIPSO
   CALIPSO(Cloud-Aerosol Lidar and Infrared Pathfinder Satellite Observations)
   是 NASA 与 CNES 的联合卫星任务,核心载荷之一是 CALIOP 激光雷达。
   CALIOP 通过主动发射激光并接收回波,在全球范围提供云、气溶胶、地表等的垂直剖面信息。

2) VFM(Vertical Feature Mask)
   VFM 是 CALIOP 二级产品(L2)中的一个"垂直特征掩膜",它不是物理量(例如消光系数),
   而是一个分类标志(mask):
     - 在每个廓线(profile)的每个高度 bin 上,给出该体素的"主类型"(feature type)
       例如:云/气溶胶/清洁空气/地表/完全衰减等
     - 同时在某些主类型上,还给出"子类型"(subtype)
       例如:云的子类型(卷云、积云、深对流...),气溶胶子类型(沙尘、烟、海洋...)

   VFM 的价值:
     - 可快速识别云/气溶胶的垂直分布结构
     - 适合做筛选、分类统计、轨迹与剖面可视化
     - 常与其他 CALIPSO 产品(例如 L2 5km AEROSOL PROFILE)联合分析

3) VFM 的数据结构(最关键的理解点)
   VFM 使用"多分辨率高度网格":
     -0.5 ~  8.2 km :30 m 分辨率,共 290 个 bin
      8.2 ~ 20.2 km :60 m 分辨率,共 200 个 bin
     20.2 ~ 30.1 km :180 m 分辨率,共 55  个 bin
   合计:290 + 200 + 55 = 545 个高度 bin(每条 profile)

   在 CAL_LID_L2_VFM 产品中,Feature_Classification_Flags 通常以 HDF4 SDS 形式存在,
   常见形状为:
       (nBlock, 5515)
   其中 5515 是把"15 条 333m profile"的 545 个高度 bin 做了压缩打包后的长度。

   本脚本采用一种非常常见的 unpack 方式(与你当前需求一致):
     - 将 (nBlock,5515) 解包为 (nBlock,15,545)
     - 最后将高度轴翻转,使得第 0 个 bin 对应最低层,和高度数组的顺序一致

   注意:
   不同版本/工具对 5515 的打包顺序描述可能存在"看起来相反"的情况(高->低 or 低->高),
   你只要确保:解包后的 flags_prof[:,:,k] 与 height_centers[k] 对应同一高度即可。
   如果你发现"每一层都翻转",通常是高度轴方向没对齐(这里已经做 out[:,:,::-1] 处理)。

二、Feature_Classification_Flags 的位字段含义(只讲我们用到的)
-------------------------------------------------------------
VFM 的每个高度 bin 是一个 16-bit 无符号整数(uint16),其中包含多个 bit-field:
  - Feature Type    :bits 0-2 (3 bits)  -> 0..7 主类型
  - Feature Subtype :bits 9-11(3 bits)  -> 0..7 子类型(含义依赖 feature type)
(其余 QA/相态/水平平均等 bit 本脚本不用于绘图,但你可以继续扩展。)

主类型(Feature Type)常用编码(0..7):
  0 invalid
  1 clear air
  2 cloud
  3 aerosol
  4 stratospheric feature (PSC / stratospheric aerosol)
  5 surface
  6 subsurface
  7 no signal / totally attenuated

子类型(Feature Subtype,0..7)依赖主类型:
  - 当 feature_type == 2(cloud)时,subtype 表示云类别(8类)
  - 当 feature_type == 3(aerosol)时,subtype 表示气溶胶类别(8类)
  - 当 feature_type == 4 时,subtype 表示平流层特征类别(这里不画)

三、脚本能做什么?
----------------
对 IN_DIR 下所有匹配 FILE_GLOB 的 HDF 文件,逐个处理并输出:

(1) CSV(统一输出到 OUT_ROOT/csv/)
    - profiles_latlon_time_{tag}.csv
      每条 profile 一行:profile_index, lat, lon, utc_time
    - profiles_time_only_{tag}.csv
      仅输出时间:profile_index, utc_time

(2) PNG 图片(统一输出到 OUT_ROOT/fig/)
    - track_vfm_4km_{tag}.png
      ~4km 处按"主类型"对轨迹线段着色
    - curtain_vfm_{tag}.png
      0-30km 的 curtain(主类型)
    - curtain_cloud_subtype_{tag}.png
      仅 cloud 的 bin 按"云子类型"着色,其余 bin 置白
    - curtain_aerosol_subtype_{tag}.png
      仅 aerosol 的 bin 按"气溶胶子类型"着色,其余 bin 置白
    - track_cloud_subtype_4km_{tag}.png
      仅绘制 ~4km 处 cloud 段轨迹,按云子类型着色(若该高度无 cloud 则 skip)
    - track_aerosol_subtype_4km_{tag}.png
      仅绘制 ~4km 处 aerosol 段轨迹,按气溶胶子类型着色(若该高度无 aerosol 则 skip)

四、输入变量假设(与你当前一致)
------------------------------
本脚本读取以下 SDS(HDF4 数据集):
  - ssLatitude
  - ssLongitude
  - ssProfile_UTC_Time
  - Feature_Classification_Flags

其中 ssLatitude/ssLongitude/ssProfile_UTC_Time 可能是 (nBlock,15) 或 (nBlock*15,) 等,
脚本会强制 flatten 为 1D,并与 flags 展开后的 profile 维度对齐到最短长度,避免末尾不齐。

五、可调参数
-----------
在"用户配置区域"可以改:
  - TRACK_HEIGHT_KM:轨迹上色高度(默认 4km)
  - CURTAIN_YMAX_KM:curtain 最大高度(默认 30km)
  - DLON_MAX_DEG / DLAT_MAX_DEG:断线阈值,避免跨图蓝线

===============================================================================
"""