QT中的大屏可视化带源码
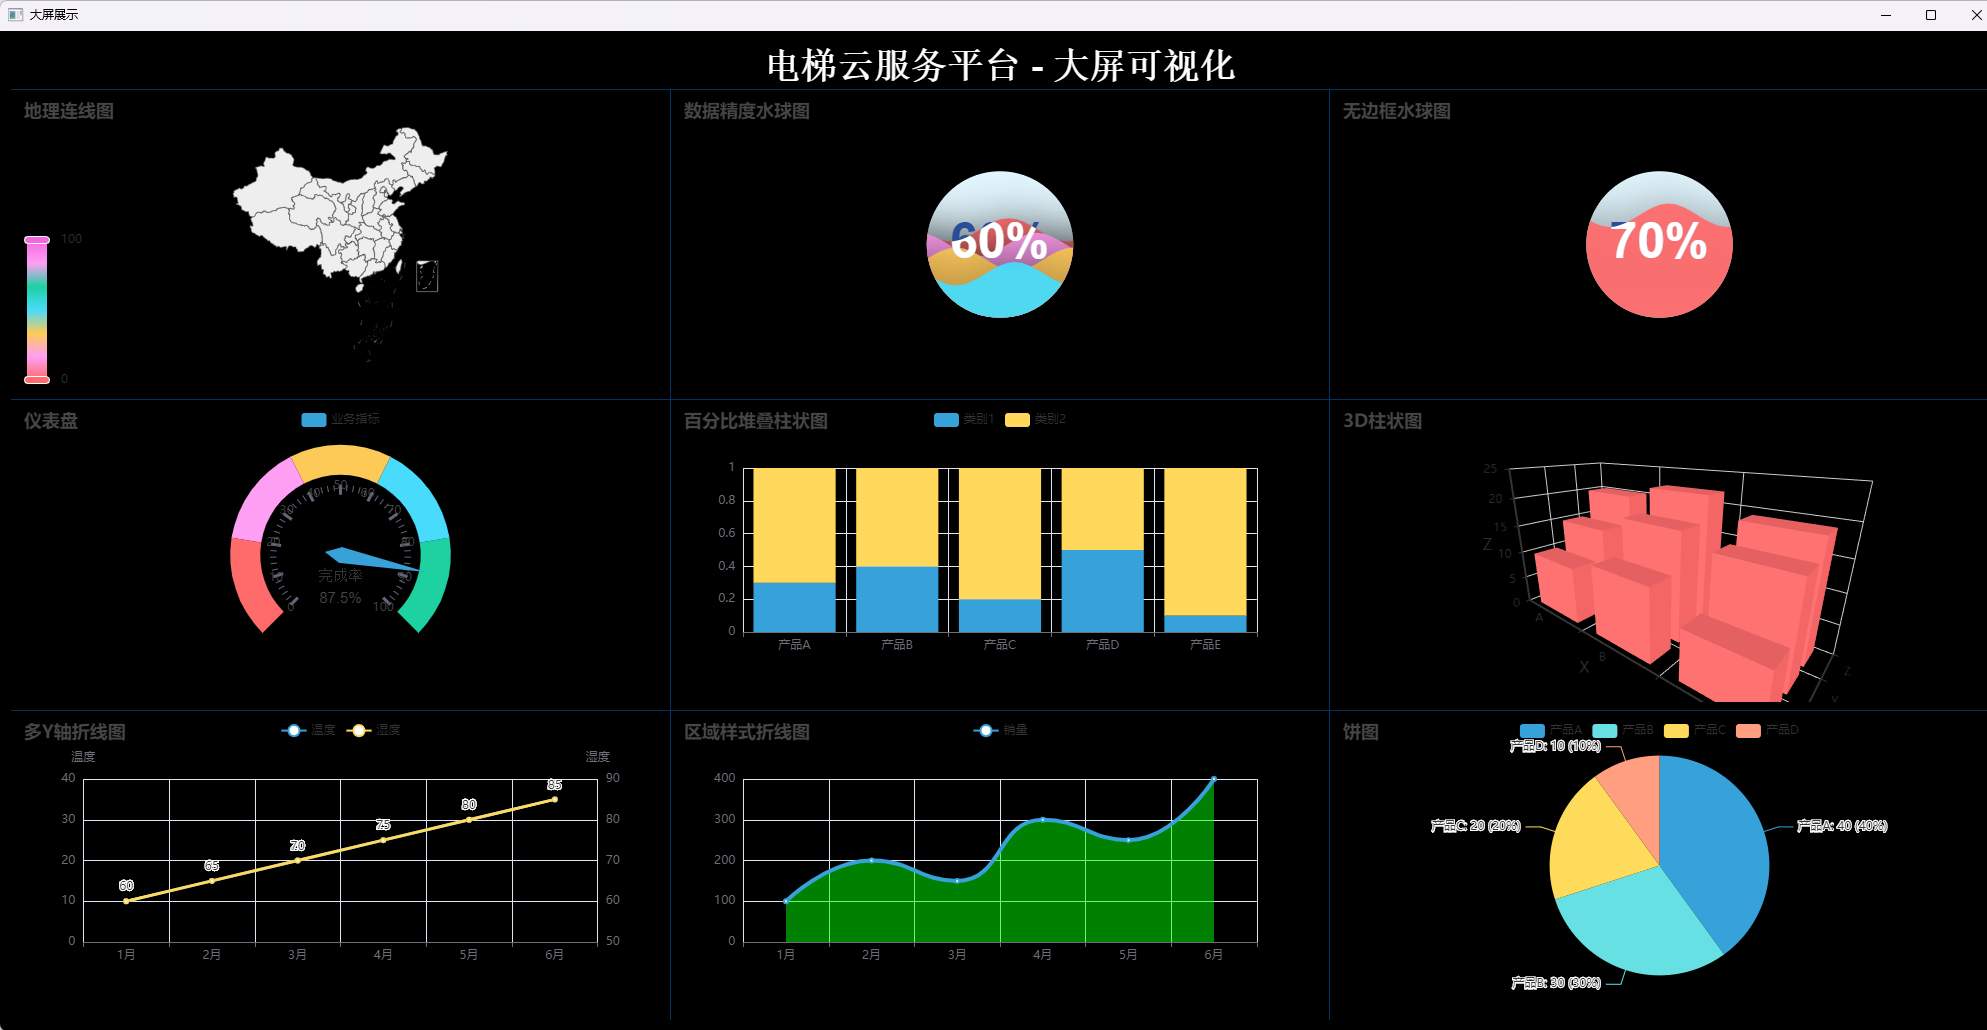
python
import sys
import os
from PyQt5.QtWidgets import (QWidget, QHBoxLayout, QSplitter, QApplication, QSizePolicy)
from PyQt5.QtCore import (Qt, QUrl)
from PyQt5.QtWebEngineWidgets import QWebEngineView, QWebEngineSettings
from PyQt5.QtGui import QPalette, QPixmap, QBrush, QColor
import pyecharts.options as opts
from pyecharts.charts import Line, Bar, Pie, Scatter, Geo, Map, EffectScatter, Liquid, Gauge, Bar3D
from pyecharts.globals import ThemeType

# 所有图表功能已整合到MainWindow类中,无需外部文件依赖
# 图表参考:https://pyecharts.org/#/zh-cn/intro
class MainWindow(QWidget):
    def __init__(self):
        super().__init__()
        self.initUI()
        self.setBackground()

    def generate_title_html(self):
        """生成标题HTML"""
        html = '''
        <!DOCTYPE html>
        <html>
        <head>
            <meta charset="UTF-8">
            <title>大屏可视化</title>
            <style>
                html, body {
                    margin: 0;
                    padding: 0;
                    width: 100%;
                    height: 100%;
                    background: transparent;
                    color: white;
                    font-family: Arial, sans-serif;
                    text-align: center;
                    display: flex;
                    align-items: center;
                    justify-content: center;
                }
                h1 {
                    font-size: 36px;
                    margin: 0;
                    text-shadow: 2px 2px 4px rgba(0,0,0,0.5);
                }
            </style>
        </head>
        <body>
            <h1>电梯云服务平台 - 大屏可视化</h1>
        </body>
        </html>
        '''
        return html

    def generate_geo_lines_html(self):
        """生成地理连线图HTML"""
        data = [
            ("北京", "上海"),
            ("北京", "广州"),
            ("上海", "深圳"),
            ("广州", "深圳")
        ]

        # 添加自定义CSS确保图表充满容器
        custom_css = """
        <style>
        .chart-container {
            width: 100% !important;
            height: 100% !important;
            margin: 0 !important;
            padding: 0 !important;
        }
        </style>
        """

        geo = (
            Geo(init_opts=opts.InitOpts(theme=ThemeType.LIGHT, width="100%", height="100%"))
            .add_schema(maptype="china")
            .add(
                "",
                data,
                type_="lines",
                linestyle_opts=opts.LineStyleOpts(
                    curve=0.2,
                    color="#ff6b6b",  # 红色
                    width=3
                ),
            )
            .set_global_opts(
                title_opts=opts.TitleOpts(title="地理连线图"),
                visualmap_opts=opts.VisualMapOpts(
                    is_show=True,
                    type_="color",
                    min_=0,
                    max_=100,
                    range_color=["#ff6b6b", "#ff9ff3", "#feca57", "#48dbfb", "#1dd1a1", "#ff9ff3", "#f368e0"]  # 七彩渐变
                )
            )
        )

        # 将自定义CSS添加到图表HTML中
        chart_html = geo.render_embed()
        return custom_css + chart_html

    def generate_liquid_data_precision_html(self):
        """生成数据精度水球图HTML"""
        liquid = (
            Liquid(init_opts=opts.InitOpts(theme=ThemeType.LIGHT, width="100%", height="100%"))
            .add(
                "完成率",
                [0.6, 0.5, 0.4, 0.3],
                color=["#ff6b6b", "#ff9ff3", "#feca57", "#48dbfb"],  # 七彩水球
                is_outline_show=False
            )
            .set_global_opts(title_opts=opts.TitleOpts(title="数据精度水球图"))
        )

        # 添加自定义CSS确保图表充满容器
        custom_css = """
        <style>
        #chart-container, .chart-container {
            width: 100% !important;
            height: 100% !important;
            margin: 0 !important;
            padding: 0 !important;
        }
        </style>
        """

        chart_html = liquid.render_embed()
        return custom_css + chart_html

    def generate_liquid_without_outline_html(self):
        """生成无边框水球图HTML"""
        liquid = (
            Liquid(init_opts=opts.InitOpts(theme=ThemeType.LIGHT, width="100%", height="100%"))
            .add(
                "完成率",
                [0.7],
                is_outline_show=False,
                color=["#ff6b6b"]  # 鲜艳红色
            )
            .set_global_opts(title_opts=opts.TitleOpts(title="无边框水球图"))
        )

        # 添加自定义CSS确保图表充满容器
        custom_css = """
        <style>
        #chart-container, .chart-container {
            width: 100% !important;
            height: 100% !important;
            margin: 0 !important;
            padding: 0 !important;
        }
        </style>
        """

        chart_html = liquid.render_embed()
        return custom_css + chart_html

    def generate_gauge_html(self):
        """生成仪表盘HTML"""
        gauge = (
            Gauge(init_opts=opts.InitOpts(theme=ThemeType.LIGHT, width="100%", height="100%"))
            .add(
                "业务指标",
                [("完成率", 87.5)],
                axisline_opts=opts.AxisLineOpts(
                    linestyle_opts=opts.LineStyleOpts(
                        color=[
                            [0.2, "#ff6b6b"],
                            [0.4, "#ff9ff3"],
                            [0.6, "#feca57"],
                            [0.8, "#48dbfb"],
                            [1, "#1dd1a1"]
                        ],
                        width=30
                    )
                )
            )
            .set_global_opts(title_opts=opts.TitleOpts(title="仪表盘"))
        )

        # 添加自定义CSS确保图表充满容器
        custom_css = """
        <style>
        #chart-container, .chart-container {
            width: 100% !important;
            height: 100% !important;
            margin: 0 !important;
            padding: 0 !important;
        }
        </style>
        """

        chart_html = gauge.render_embed()
        return custom_css + chart_html

    def generate_stack_bar_percent_html(self):
        """生成百分比堆叠柱状图HTML"""
        bar = (
            Bar(init_opts=opts.InitOpts(theme=ThemeType.LIGHT, width="100%", height="100%"))
            .add_xaxis(["产品A", "产品B", "产品C", "产品D", "产品E"])
            .add_yaxis(
                "类别1",
                [0.3, 0.4, 0.2, 0.5, 0.1],
                stack="stack1",
                color="#ff6b6b"  # 红色
            )
            .add_yaxis(
                "类别2",
                [0.7, 0.6, 0.8, 0.5, 0.9],
                stack="stack1",
                color="#48dbfb"  # 蓝色
            )
            .set_series_opts(label_opts=opts.LabelOpts(is_show=False))
            .set_global_opts(title_opts=opts.TitleOpts(title="百分比堆叠柱状图"))
        )

        # 添加自定义CSS确保图表充满容器
        custom_css = """
        <style>
        #chart-container, .chart-container {
            width: 100% !important;
            height: 100% !important;
            margin: 0 !important;
            padding: 0 !important;
        }
        </style>
        """

        chart_html = bar.render_embed()
        return custom_css + chart_html

    def generate_bar3d_punch_card_html(self):
        """生成3D柱状图HTML"""
        data = [
            [0, 0, 10], [0, 1, 15], [0, 2, 20],
            [1, 0, 12], [1, 1, 18], [1, 2, 22],
            [2, 0, 8], [2, 1, 16], [2, 2, 19]
        ]
        bar3d = (
            Bar3D(init_opts=opts.InitOpts(theme=ThemeType.LIGHT, width="100%", height="100%"))
            .add(
                "",
                data,
                xaxis3d_opts=opts.Axis3DOpts(type_="category", data=["A", "B", "C"]),
                yaxis3d_opts=opts.Axis3DOpts(type_="category", data=["X", "Y", "Z"]),
                zaxis3d_opts=opts.Axis3DOpts(type_="value"),
                shading="realistic",
                itemstyle_opts=opts.ItemStyleOpts(
                    color="#ff6b6b"  # 鲜艳红色
                )
            )
            .set_global_opts(title_opts=opts.TitleOpts(title="3D柱状图"))
        )

        # 添加自定义CSS确保图表充满容器
        custom_css = """
        <style>
        #chart-container, .chart-container {
            width: 100% !important;
            height: 100% !important;
            margin: 0 !important;
            padding: 0 !important;
        }
        </style>
        """

        chart_html = bar3d.render_embed()
        return custom_css + chart_html

    def generate_grid_multi_yaxis_html(self):
        """生成多Y轴网格图HTML"""
        line = (
            Line(init_opts=opts.InitOpts(theme=ThemeType.LIGHT, width="100%", height="100%"))
            .add_xaxis(["1月", "2月", "3月", "4月", "5月", "6月"])
            .add_yaxis(
                "温度",
                [10, 15, 20, 25, 30, 35],
                yaxis_index=0,
                color="#ff6b6b",  # 红色温度线
                linestyle_opts=opts.LineStyleOpts(width=3)
            )
            .add_yaxis(
                "湿度",
                [60, 65, 70, 75, 80, 85],
                yaxis_index=1,
                color="#48dbfb",  # 蓝色湿度线
                linestyle_opts=opts.LineStyleOpts(width=3)
            )
            .extend_axis(yaxis=opts.AxisOpts(type_="value", name="湿度", min_=50, max_=90))
            .set_global_opts(
                title_opts=opts.TitleOpts(title="多Y轴折线图"),
                yaxis_opts=opts.AxisOpts(type_="value", name="温度", min_=0, max_=40)
            )
        )

        # 添加自定义CSS确保图表充满容器
        custom_css = """
        <style>
        #chart-container, .chart-container {
            width: 100% !important;
            height: 100% !important;
            margin: 0 !important;
            padding: 0 !important;
        }
        </style>
        """

        chart_html = line.render_embed()
        return custom_css + chart_html

    def generate_line_areastyle_boundary_gap_html(self):
        """生成区域样式折线图HTML"""
        line = (
            Line(init_opts=opts.InitOpts(theme=ThemeType.LIGHT, width="100%", height="100%"))
            .add_xaxis(["1月", "2月", "3月", "4月", "5月", "6月"])
            .add_yaxis(
                "销量",
                [100, 200, 150, 300, 250, 400],
                is_smooth=True,
                color="#00FF00",  # 纯绿色
                areastyle_opts=opts.AreaStyleOpts(
                    opacity=0.5,
                    color="#00FF00"
                ),
                linestyle_opts=opts.LineStyleOpts(width=4)
            )
            .set_series_opts(label_opts=opts.LabelOpts(is_show=False))
            .set_global_opts(title_opts=opts.TitleOpts(title="区域样式折线图"))
        )

        # 添加自定义CSS确保图表充满容器
        custom_css = """
        <style>
        #chart-container, .chart-container {
            width: 100% !important;
            height: 100% !important;
            margin: 0 !important;
            padding: 0 !important;
        }
        </style>
        """

        chart_html = line.render_embed()
        return custom_css + chart_html

    def generate_pie_position_html(self):
        """生成饼图HTML"""
        pie = (
            Pie(init_opts=opts.InitOpts(theme=ThemeType.LIGHT, width="100%", height="100%"))
            .add(
                "",
                [("产品A", 40), ("产品B", 30), ("产品C", 20), ("产品D", 10)],
                color=["#FF0000", "#00FF00", "#0000FF", "#FFFF00"]  # 红绿蓝黄四色饼图
            )
            .set_global_opts(title_opts=opts.TitleOpts(title="饼图"))
            .set_series_opts(label_opts=opts.LabelOpts(formatter="{b}: {c} ({d}%)"))
        )

        # 添加自定义CSS确保图表充满容器
        custom_css = """
        <style>
        #chart-container, .chart-container {
            width: 100% !important;
            height: 100% !important;
            margin: 0 !important;
            padding: 0 !important;
        }
        </style>
        """

        chart_html = pie.render_embed()
        return custom_css + chart_html

    #设置背景图
    def setBackground(self):
        palette = QPalette()
        pix = QPixmap("./images/bg.jpg")
        pix = pix.scaled(self.width(), self.height(), Qt.IgnoreAspectRatio, Qt.SmoothTransformation)#自适应图片大小
        palette.setBrush(self.backgroundRole(), QBrush(pix))# 设置背景图片
        #palette.setColor(self.backgroundRole(), QColor(192, 253, 123))  # 设置背景颜色
        self.setPalette(palette)

    #画界面元素
    def initUI(self):
        main_box = QHBoxLayout(self)

        self.browser1 = QWebEngineView()
        self.browser1.page().setBackgroundColor(QColor(0, 0, 0, 0))
        self.browser1.setHtml(self.generate_title_html())
        self.browser1.setSizePolicy(QSizePolicy.Expanding, QSizePolicy.Expanding)

        self.browser2 = QWebEngineView()
        self.browser2.page().setBackgroundColor(QColor(0, 0, 0, 0))
        self.browser2.setHtml(self.generate_geo_lines_html())
        self.browser2.setSizePolicy(QSizePolicy.Expanding, QSizePolicy.Expanding)

        self.browser3 = QWebEngineView()
        self.browser3.page().setBackgroundColor(QColor(0, 0, 0, 0))
        self.browser3.setHtml(self.generate_liquid_data_precision_html())
        self.browser3.setSizePolicy(QSizePolicy.Expanding, QSizePolicy.Expanding)

        self.browser4 = QWebEngineView()
        self.browser4.page().setBackgroundColor(QColor(0, 0, 0, 0))
        self.browser4.setHtml(self.generate_liquid_without_outline_html())
        self.browser4.setSizePolicy(QSizePolicy.Expanding, QSizePolicy.Expanding)

        self.browser5 = QWebEngineView()
        self.browser5.page().setBackgroundColor(QColor(0, 0, 0, 0))
        self.browser5.setHtml(self.generate_gauge_html())
        self.browser5.setSizePolicy(QSizePolicy.Expanding, QSizePolicy.Expanding)

        self.browser6 = QWebEngineView()
        self.browser6.page().setBackgroundColor(QColor(0, 0, 0, 0))
        self.browser6.setHtml(self.generate_stack_bar_percent_html())
        self.browser6.setSizePolicy(QSizePolicy.Expanding, QSizePolicy.Expanding)

        self.browser7 = QWebEngineView()
        self.browser7.page().setBackgroundColor(QColor(0, 0, 0, 0))
        self.browser7.setHtml(self.generate_bar3d_punch_card_html())
        self.browser7.setSizePolicy(QSizePolicy.Expanding, QSizePolicy.Expanding)

        self.browser8 = QWebEngineView()
        self.browser8.page().setBackgroundColor(QColor(0, 0, 0, 0))
        self.browser8.setHtml(self.generate_grid_multi_yaxis_html())
        self.browser8.setSizePolicy(QSizePolicy.Expanding, QSizePolicy.Expanding)

        self.browser9 = QWebEngineView()
        self.browser9.page().setBackgroundColor(QColor(0, 0, 0, 0))
        self.browser9.setHtml(self.generate_line_areastyle_boundary_gap_html())
        self.browser9.setSizePolicy(QSizePolicy.Expanding, QSizePolicy.Expanding)

        self.browser10 = QWebEngineView()
        self.browser10.page().setBackgroundColor(QColor(0, 0, 0, 0))
        self.browser10.setHtml(self.generate_pie_position_html())
        self.browser10.setSizePolicy(QSizePolicy.Expanding, QSizePolicy.Expanding)

        splitter_width = 1

        # 主布局:标题 + 内容区域
        main_splitter = QSplitter(Qt.Vertical)
        main_splitter.setStyleSheet("QSplitter::handle { background-color: rgb(0,51,102) }")
        main_splitter.setHandleWidth(splitter_width)

        # 内容区域:3x3网格布局
        content_splitter = QSplitter(Qt.Vertical)
        content_splitter.setHandleWidth(splitter_width)

        # 第一行:3个图表
        row1_splitter = QSplitter(Qt.Horizontal)
        row1_splitter.setHandleWidth(splitter_width)

        # 第二行:3个图表
        row2_splitter = QSplitter(Qt.Horizontal)
        row2_splitter.setHandleWidth(splitter_width)

        # 第三行:3个图表
        row3_splitter = QSplitter(Qt.Horizontal)
        row3_splitter.setHandleWidth(splitter_width)

        # 构建布局结构
        main_splitter.addWidget(self.browser1)  # 标题
        main_splitter.addWidget(content_splitter)  # 内容区域
        main_splitter.setSizes([1, 20])  # 标题占1份,内容占20份

        content_splitter.addWidget(row1_splitter)
        content_splitter.addWidget(row2_splitter)
        content_splitter.addWidget(row3_splitter)
        content_splitter.setSizes([7, 7, 7])  # 三行等分,增加行高

        # 第一行:地理连线图 + 数据精度水球图 + 无边框水球图
        row1_splitter.addWidget(self.browser2)  # 地理连线图
        row1_splitter.addWidget(self.browser3)  # 数据精度水球图
        row1_splitter.addWidget(self.browser4)  # 无边框水球图
        row1_splitter.setSizes([8, 8, 8])  # 所有格子等宽

        # 第二行:仪表盘 + 百分比堆叠柱状图 + 3D柱状图
        row2_splitter.addWidget(self.browser5)  # 仪表盘
        row2_splitter.addWidget(self.browser6)  # 百分比堆叠柱状图
        row2_splitter.addWidget(self.browser7)  # 3D柱状图
        row2_splitter.setSizes([8, 8, 8])  # 所有格子等宽

        # 第三行:多Y轴网格图 + 区域样式折线图 + 饼图
        row3_splitter.addWidget(self.browser8)  # 多Y轴网格图
        row3_splitter.addWidget(self.browser9)  # 区域样式折线图
        row3_splitter.addWidget(self.browser10)  # 饼图
        row3_splitter.setSizes([8, 8, 8])  # 所有格子等宽

        main_box.addWidget(main_splitter)
        self.setLayout(main_box)
        self.setGeometry(0, 0, 2000, 1000)
        self.setWindowTitle('大屏展示')
        self.show()

    def resizeEvent(self, event):
        print("resizeEvent")
        self.setBackground()

if __name__ == '__main__':
    app = QApplication(sys.argv)
    ex = MainWindow()
    sys.exit(app.exec_())
nicegui中的大屏可视化
html
python
from pyecharts import options as opts
from pyecharts.charts import Bar,Gauge,Pie,Page,Funnel,Geo,Scatter3D
import random


def bar(): #柱状图
    cate = ['1月', '2月', '3月', '4月', '5月', '6月']
    c = (
         Bar()
            .add_xaxis(cate)
            .add_yaxis("订单数", [random.randint(100, 200) for _ in cate])
            .add_yaxis("完成数", [random.randint(50, 100) for _ in cate])
            .set_series_opts(
                             label_opts=opts.LabelOpts(is_show=True,color="#2CB34A")

            )
            .set_global_opts(title_opts=opts.TitleOpts(title="2021年订单推移图",
                                                       title_textstyle_opts=opts.TextStyleOpts(color="#2CB34A"),
                                                       pos_left="5%"),
                             legend_opts=opts.LegendOpts(textstyle_opts=opts.TextStyleOpts(color="#2CB34A")),
                             xaxis_opts=opts.AxisOpts(axislabel_opts=opts.LabelOpts(color="#2CB34A")),
                             yaxis_opts=opts.AxisOpts(axislabel_opts=opts.LabelOpts(color="#2CB34A"))

            )
            .set_colors(["blue", "green"])
            #.render("bar_stack0.html")
    )
    return c


def tab0(name,color): #标题
    c = (Pie().
        set_global_opts(
        title_opts=opts.TitleOpts(title=name,pos_left='center',pos_top='center',
                                title_textstyle_opts=opts.TextStyleOpts(color=color,font_size=20))))
    return c


def tab1(name,color): #标题
    c = (Pie().
        set_global_opts(
        title_opts=opts.TitleOpts(title=name,pos_left='center',pos_top='center',
                                title_textstyle_opts=opts.TextStyleOpts(color=color,font_size=25))))
    return c


def gau():#仪表图
    c = (
        Gauge(init_opts=opts.InitOpts(width="400px", height="400px"))
            .add(series_name="库位利用率", data_pair=[["", 90]])
            .set_global_opts(
            legend_opts=opts.LegendOpts(is_show=False),
            tooltip_opts=opts.TooltipOpts(is_show=True, formatter="{a} <br/>{b} : {c}%"),

        )
            #.render("gauge.html")
    )
    return c


def radius():
    cate = ['客户A', '客户B', '客户C', '客户D', '客户E', '其他客户']
    data = [153, 124, 107, 99, 89, 46]
    c=Pie()
    c.add('', [list(z) for z in zip(cate, data)],
            radius=["30%", "75%"],
            rosetype="radius")
    c.set_global_opts(title_opts=opts.TitleOpts(title="客户销售额占比", padding=[1,250],title_textstyle_opts=opts.TextStyleOpts(color="#FFFFFF")),
                      legend_opts=opts.LegendOpts(textstyle_opts=opts.TextStyleOpts(color="#FFFFFF"),type_="scroll",orient="vertical",pos_right="5%",pos_top="middle")
                      )
    c.set_series_opts(label_opts=opts.LabelOpts(formatter="{b}: {d}%"))
    c.set_colors(['red',"orange", "yellow", "green", "Cyan", "purple"])

    return c


def funnel():
    cate = ['访问', '注册', '加入购物车', '提交订单', '付款成功']
    data = [30398, 15230, 10045, 8109, 5698]
    c = Funnel()
    c.add("用户数", [list(z) for z in zip(cate, data)],
               sort_='ascending',
               label_opts=opts.LabelOpts(position="inside"))
    c.set_global_opts(title_opts=opts.TitleOpts(title=""))


    return c


def geo():
    city_num = [('武汉',105),('成都',70),('北京',99),
            ('西安',80),('杭州',60),('贵阳',34),
            ('上海',65),('深圳',54),('乌鲁木齐',76),
            ('哈尔滨',47),('兰州',56),('信阳',85)]
    start_end = [('宁波','成都'),('武汉','北京'),('武汉','西安'),
             ('长沙','杭州'),('武汉','贵阳'),('武汉','上海'),
             ('甘肃','深圳'),('北京','乌鲁木齐'),('上海','哈尔滨'),
             ('武汉','兰州'),('西藏','信阳')]
    c = Geo()
    c.add_schema(maptype='china',
                itemstyle_opts=opts.ItemStyleOpts(color='#323c48', border_color='white'))
    # 4.添加数据
    c.add('', data_pair=city_num, color='white')
    c.add('', data_pair=start_end, type_="lines",label_opts=opts.LabelOpts(is_show=False),
         effect_opts=opts.EffectOpts(symbol="arrow",
                                     color='gold',
                                     symbol_size=7))
    c.set_global_opts(
        title_opts = opts.TitleOpts(title=""))

    return c


def scatter3D():
    data = [(random.randint(0, 100), random.randint(0, 100), random.randint(0, 100)) for _ in range(80)]
    c = (Scatter3D()
            .add("", data)
            .set_global_opts(
              title_opts=opts.TitleOpts(""),
            )
        )
    return c


page = Page()
page.add(
         tab0("OFFICETOUCH","#2CB34A"),
         bar(),
         tab1("数据可视化大屏","#2CB34A"),
         gau(),
         radius(),
         funnel(),
         geo(),
         scatter3D()
         )
page.render("datacenter.html")
#os.system("scatter.html")


from bs4 import BeautifulSoup
with open("datacenter.html", "r+", encoding='utf-8') as html:
    html_bf = BeautifulSoup(html, 'lxml')
    divs = html_bf.select('.chart-container')
    divs[0]["style"] = "width:10%;height:10%;position:absolute;top:0;left:2%;"
    divs[1]["style"] = "width:40%;height:40%;position:absolute;top:12%;left:0;"
    divs[2]["style"] = "width:35%;height:10%;position:absolute;top:2%;left:30%;"
    divs[3]["style"] = "width:40%;height:40%;position:absolute;top:10%;left:28%;"
    divs[4]["style"] = "width:40%;height:35%;position:absolute;top:12%;left:55%;"
    divs[5]["style"] = "width:30%;height:35%;position:absolute;top:60%;left:2%;"
    divs[6]["style"] = "width:60%;height:50%;position:absolute;top:45%;left:15%;"
    divs[7]["style"] = "width:35%;height:40%;position:absolute;top:50%;left:60%;"
    body = html_bf.find("body")
    body["style"] = "background-image: url(bgd.jpg)"  # 背景颜色
    html_new = str(html_bf)
    html.seek(0, 0)
    html.truncate()
    html.write(html_new)