1. 构造矩阵
test = matrix(rnorm(200), 20, 10)
test1:10, seq(1, 10, 2) = test1:10, seq(1, 10, 2) + 3
test11:20, seq(2, 10, 2) = test11:20, seq(2, 10, 2) + 2
test15:20, seq(2, 10, 2) = test15:20, seq(2, 10, 2) + 4
colnames(test) = paste("Test", 1:10, sep = "")
rownames(test) = paste("Gene", 1:20, sep = "")
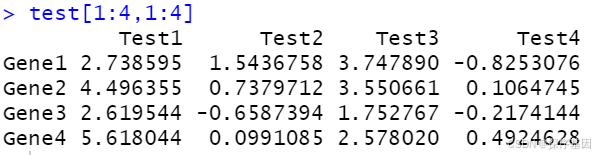
我们按看这个矩阵的四行四列的效果:
2. 构造注释信息
annotation_col = data.frame(
CellType = factor(rep(c("CT1", "CT2"), 5)), Time = 1:5
)
rownames(annotation_col) = paste("Test", 1:10, sep = "")
annotation_row = data.frame(
GeneClass = factor(rep(c("Path1", "Path2", "Path3"), c(10, 4, 6)))
)
rownames(annotation_row) = paste("Gene", 1:20, sep = "")
注意要为因子的形式!!!
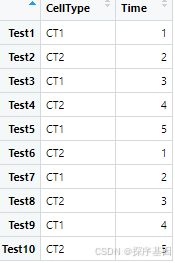
annotation_col的样子:
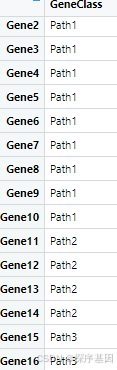
annotation_row 的样子:
3. 画图
我们使用的是pheatmap包
library(pheatmap)
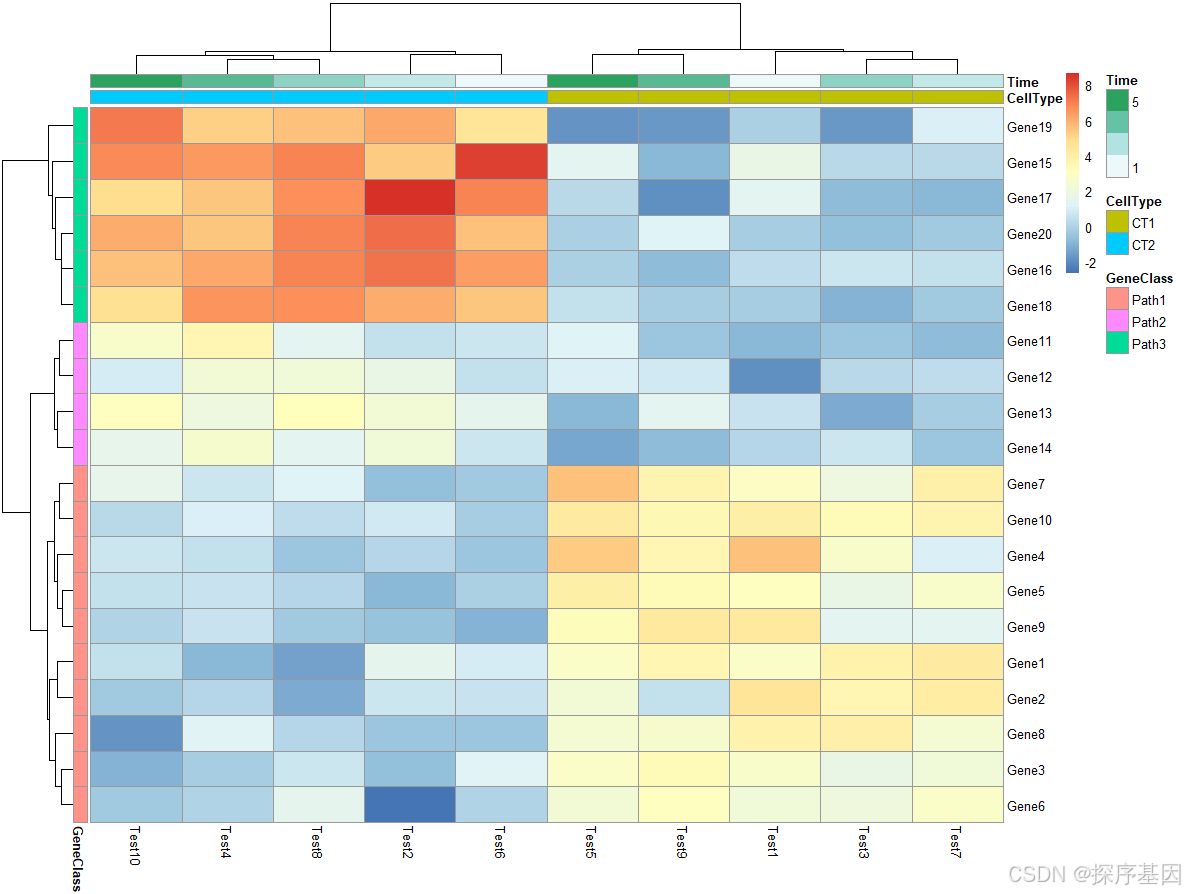
pheatmap(test, annotation_col = annotation_col, annotation_row = annotation_row)
此函数的各种参数:
pheatmap(mat, color = colorRampPalette(rev(brewer.pal(n = 7, name =
"RdYlBu")))(100), kmeans_k = NA, breaks = NA, border_color = "grey60",
cellwidth = NA, cellheight = NA, scale = "none", cluster_rows = TRUE,
cluster_cols = TRUE, clustering_distance_rows = "euclidean",
clustering_distance_cols = "euclidean", clustering_method = "complete",
clustering_callback = identity2, cutree_rows = NA, cutree_cols = NA,
treeheight_row = ifelse((class(cluster_rows) == "hclust") || cluster_rows,
50, 0), treeheight_col = ifelse((class(cluster_cols) == "hclust") ||
cluster_cols, 50, 0), legend = TRUE, legend_breaks = NA,
legend_labels = NA, annotation_row = NA, annotation_col = NA,
annotation = NA, annotation_colors = NA, annotation_legend = TRUE,
annotation_names_row = TRUE, annotation_names_col = TRUE,
drop_levels = TRUE, show_rownames = T, show_colnames = T, main = NA,
fontsize = 10, fontsize_row = fontsize, fontsize_col = fontsize,
angle_col = c("270", "0", "45", "90", "315"), display_numbers = F,
number_format = "%.2f", number_color = "grey30", fontsize_number = 0.8
* fontsize, gaps_row = NULL, gaps_col = NULL, labels_row = NULL,
labels_col = NULL, filename = NA, width = NA, height = NA,
silent = FALSE, na_col = "#DDDDDD", ...)