实现的效果如下图
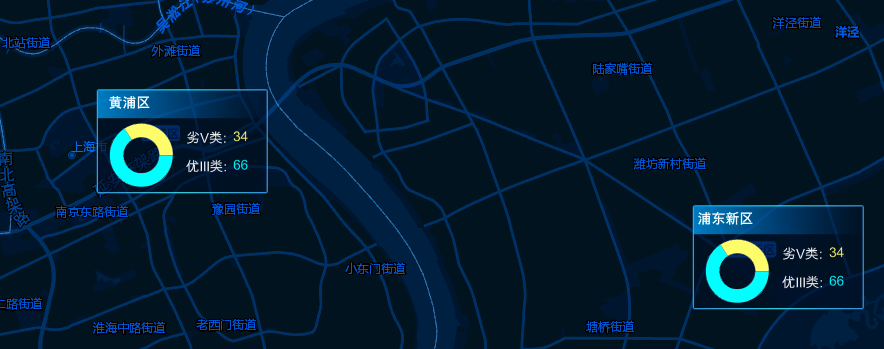
代码如下
createCIMWatertQuality(data: any) {
// 饼图样式配置(可根据需求调整)
const pieConfig = {
outerRadius: 3.5, // 外半径(适配背景框大小)
innerRadius: 2, // 内半径(环状空白部分)
centerX: 3.5, // 饼图中心X(背景框中心)
centerY: 6.5, // 饼图中心Y(上移1个单位,避开标题)
defaultColors: [
// 默认扇区颜色(可通过data.colors覆盖)
255, 255, 102, 255, // 浅黄
0, 255, 255, 255, // 浅蓝
255, 102, 102, 200, // 浅红
102, 255, 102, 200, // 浅绿
255, 102, 255, 200 // 浅紫
]
};
const getRingSectorPath = (startAngle: number, endAngle: number) => {
const points = \[\];
const step = (endAngle - startAngle) / 30; // 分段数(越多越平滑)
  // 1. 绘制外圆弧(从startAngle到endAngle)
  for (let angle = startAngle; angle < endAngle; angle += step) {
    const x = pieConfig.centerX + pieConfig.outerRadius * Math.cos(angle);
    const y = pieConfig.centerY + pieConfig.outerRadius * Math.sin(angle);
    points.push([x, y]);
  }
  points.push([
    pieConfig.centerX + pieConfig.outerRadius * Math.cos(endAngle),
    pieConfig.centerY + pieConfig.outerRadius * Math.sin(endAngle)
  ]);

  // 2. 绘制内圆弧(反向,从endAngle到startAngle)
  for (let angle = endAngle; angle > startAngle; angle -= step) {
    const x = pieConfig.centerX + pieConfig.innerRadius * Math.cos(angle);
    const y = pieConfig.centerY + pieConfig.innerRadius * Math.sin(angle);
    points.push([x, y]);
  }
  // 强制添加起始角度的点,确保内圆弧精确闭合
  points.push([
    pieConfig.centerX + pieConfig.innerRadius * Math.cos(startAngle),
    pieConfig.centerY + pieConfig.innerRadius * Math.sin(startAngle)
  ]);

  // 3. 闭合路径(回到外圆弧起点)
  points.push([
    pieConfig.centerX + pieConfig.outerRadius * Math.cos(startAngle),
    pieConfig.centerY + pieConfig.outerRadius * Math.sin(startAngle)
  ]);
  return points;
};
const generatePieGraphics = () => {
  const graphics = [];
  const values = data.value || [12, 22];
  const total = values.reduce((sum: number, item: any) => sum + (item.value || 0), 0);
  // 无有效数据时,绘制一个灰色空环
  if (total === 0) {
    graphics.push({
      type: "CIMMarkerGraphic",
      geometry: {
        rings: [getRingSectorPath(0, 2 * Math.PI)] // 完整圆环
      },
      symbol: {
        type: "CIMPolygonSymbol",
        symbolLayers: [
          { type: "CIMSolidFill", enable: true, color: [150, 150, 150, 100] } // 灰色半透明
        ]
      }
    });
    return graphics;
  }
  // 有数据时,计算每个扇区的角度并生成图形
  let startAngle = 0; // 起始角度(0弧度=右侧)
  const colors = data.colors || pieConfig.defaultColors;
  values.forEach((item: any, index: number) => {
    if (item.value <= 0) return; // 跳过0值
    const ratio = item.value / total;
    const endAngle = startAngle + ratio * 2 * Math.PI; // 结束角度
    const color = colors[index] || colors[index % colors.length]; // 取颜色(循环使用)
    let title = "优III类:";
    if (item.type === 0) {
      title = "劣V类:";
    }
    graphics.push({
      type: "CIMMarkerGraphic",
      geometry: {
        rings: [getRingSectorPath(startAngle, endAngle)]
      },
      symbol: {
        type: "CIMPolygonSymbol",
        symbolLayers: [
          { type: "CIMSolidStroke", enable: true, color: [255, 255, 255, 200], width: 0.2 }, // 扇区边框
          { type: "CIMSolidFill", enable: true, color: color }, // 扇区填充色
          {
            type: "CIMVectorMarker",
            enable: true,
            offsetX: -6,
            offsetY: 22,
            size: 180,
            frame: { xmin: 0, ymin: 0, xmax: 16, ymax: 16 },
            markerGraphics: [
              {
                type: "CIMMarkerGraphic",
                geometry: {
                  x: 0,
                  y: 0
                },
                symbol: {
                  type: "CIMPolygonSymbol",
                  symbolLayers: [
                    {
                      type: "CIMVectorMarker",
                      enable: true,
                      size: 12,
                      colorLocked: true,
                      anchorPointUnits: "Relative",
                      frame: { xmin: 0, ymin: 0, xmax: 14, ymax: 14 },
                      markerGraphics: [
                        {
                          type: "CIMMarkerGraphic",
                          geometry: { x: 65, y: -10 + index * -25 },
                          symbol: {
                            type: "CIMTextSymbol",
                            fontFamilyName: "Arial",
                            fontStyleName: "Bold",
                            height: 12,
                            horizontalAlignment: "Center",
                            symbol: {
                              type: "CIMPolygonSymbol",
                              symbolLayers: [{ type: "CIMSolidFill", color: color }]
                            },
                            verticalAlignment: "Top"
                          },
                          textString: `${item.value}`
                        },
                        {
                          type: "CIMMarkerGraphic",
                          geometry: { x: 35, y: -10 + index * -25 },
                          symbol: {
                            type: "CIMTextSymbol",
                            fontFamilyName: "Arial",
                            fontStyleName: "Bold",
                            height: 12,
                            horizontalAlignment: "Center",
                            symbol: {
                              type: "CIMPolygonSymbol",
                              symbolLayers: [{ type: "CIMSolidFill", color: [255, 255, 255, 255] }]
                            },
                            verticalAlignment: "Top"
                          },
                          textString: `${title}`
                        }
                      ],
                      scaleSymbolsProportionally: true,
                      respectFrame: true
                    }
                  ]
                }
              }
            ]
          }
        ]
      }
    });

    startAngle = endAngle;
  });

  return graphics;
};
const symbol = new CIMSymbol({
  data: {
    type: "CIMSymbolReference",
    symbol: {
      type: "CIMPointSymbol",
      symbolLayers: [
        // 3. 新增:环状饼图图层
        {
          type: "CIMVectorMarker",
          enable: true,
          size: 108,
          frame: { xmin: 0, ymin: 0, xmax: 16, ymax: 16 },
          markerGraphics: generatePieGraphics()
        },
        {
          type: "CIMVectorMarker",
          enable: true,
          offsetX: -45,
          offsetY: 40,
          size: 78,
          frame: { xmin: 0, ymin: 0, xmax: 16, ymax: 16 },
          markerGraphics: [
            {
              type: "CIMMarkerGraphic",
              geometry: {
                x: 0,
                y: 0
              },
              symbol: {
                type: "CIMPolygonSymbol",
                symbolLayers: [
                  {
                    type: "CIMVectorMarker",
                    enable: true,
                    size: 12,
                    colorLocked: true,
                    anchorPointUnits: "Relative",
                    frame: { xmin: 0, ymin: 0, xmax: 16, ymax: 16 },
                    markerGraphics: [
                      {
                        type: "CIMMarkerGraphic",
                        geometry: { x: 15, y: 0 },
                        symbol: {
                          type: "CIMTextSymbol",
                          fontStyleName: "Bold",
                          height: 14,
                          horizontalAlignment: "Center",
                          symbol: {
                            type: "CIMPolygonSymbol",
                            symbolLayers: [{ type: "CIMSolidFill", color: [255, 255, 255, 255] }]
                          },
                          verticalAlignment: "Top",
                          textString: data.name || "未命名监测点"
                        },
                        textString: data.name || "未命名监测点"
                      }
                    ],
                    scaleSymbolsProportionally: true,
                    respectFrame: true
                  }
                ]
              }
            }
          ]
        },
        {
          type: "CIMPictureMarker",
          enable: true,
          anchorPoint: {
            x: 0,
            y: 0
          },
          size: 78,
          scaleX: 1,
          tintColor: [255, 255, 255, 255],
          url: boxImg
        }
      ]
    }
  }
});
return symbol;
}
实现柱状图如下图效果
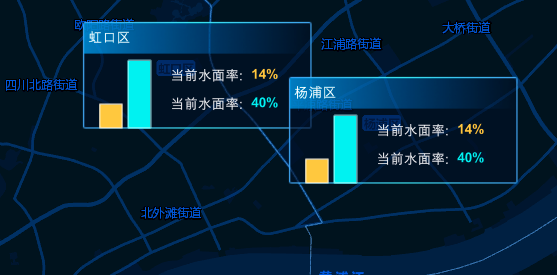
代码如下:
createCIMsymbol(barData1: any) {
const bgBox = {
xMin: 1, // 背景框左边界
xMax: 12, // 背景框右边界
yMin: 4, // 背景框上边界
yMax: 4.5, // 背景框下边界
width: 10, // 背景框宽度
height: 3.5 // 背景框高度
};
const safeBarBox = {
...bgBox,
yMax: 7.6 - 0.5
};
const barConfig = {
width: 1.5, // 单根柱子宽度
spacing: 0.4, // 组内柱子间距
maxHeight: safeBarBox.height + 1,
baseX: bgBox.xMin + 0.5,
baseY: 0
};
const allValues = ...barData1.value.map(item =\> item.value);
const maxValue = Math.max(...allValues, 1);
const heightRatio = barConfig.maxHeight / maxValue;
const buildBarGroup = (data: any[], groupOffsetX: number) => {
  const groupTotalWidth = data.length * (barConfig.width + barConfig.spacing) - barConfig.spacing;
  const maxAllowX = bgBox.xMax - 0.5;
  const groupEndX = groupOffsetX + groupTotalWidth;

  if (groupEndX > maxAllowX) {
    const excessRatio = (maxAllowX - groupOffsetX) / groupTotalWidth;
    barConfig.width = barConfig.width * excessRatio; // 按比例缩小宽度
    const newGroupTotalWidth = data.length * (barConfig.width + barConfig.spacing) - barConfig.spacing;
    if (newGroupTotalWidth > maxAllowX - groupOffsetX) {
      barConfig.width = (maxAllowX - groupOffsetX - (data.length - 1) * barConfig.spacing) / data.length;
    }
  }

  let layers: any[] = [];
  data.forEach((item, index) => {
    const barX = groupOffsetX + index * (barConfig.width + barConfig.spacing);
    const barHeight = Math.min(item.value * heightRatio, barConfig.maxHeight);

    const barTopY = safeBarBox.yMin + 0.5; // 顶部留边距
    const barBottomY = barTopY + barHeight;
    const finalBarBottomY = barBottomY;

    const barGeometry = {
      rings: [
        [
          [barX, barTopY], // 左上(Y小,靠上)
          [barX + barConfig.width, barTopY], // 右上
          [barX + barConfig.width, finalBarBottomY], // 右下
          [barX, finalBarBottomY], // 左下
          [barX, barTopY] // 闭合
        ]
      ]
    };
    let color = [53, 243, 243, 255];
    let borderColor = [184, 254, 254, 255];
    if (index === 0) {
      borderColor = [255, 249, 226, 255];
      color = [255, 209, 49, 255];
    }
    layers.push({
      type: "CIMVectorMarker",
      enable: true,
      size: 180,
      frame: { xmin: 0, ymin: 0, xmax: 16, ymax: 16 },
      markerGraphics: [
        {
          type: "CIMMarkerGraphic",
          geometry: barGeometry,
          symbol: {
            type: "CIMPolygonSymbol",
            symbolLayers: [
              { type: "CIMSolidStroke", color: borderColor, width: 1, capStyle: "Round", joinStyle: "Round" },
              { type: "CIMSolidFill", color: color, capStyle: "Round", joinStyle: "Round" },
              {
                type: "CIMVectorMarker",
                enable: true,
                offsetX: -6,
                offsetY: 45,
                size: 80,
                frame: { xmin: 0, ymin: 0, xmax: 16, ymax: 16 },
                markerGraphics: [
                  {
                    type: "CIMMarkerGraphic",
                    geometry: {
                      x: 0,
                      y: 0
                    },
                    symbol: {
                      type: "CIMPolygonSymbol",
                      symbolLayers: [
                        {
                          type: "CIMVectorMarker",
                          enable: true,
                          size: 12,
                          colorLocked: true,
                          anchorPointUnits: "Relative",
                          frame: { xmin: 0, ymin: 0, xmax: 14, ymax: 14 },
                          markerGraphics: [
                            {
                              type: "CIMMarkerGraphic",
                              geometry: { x: 73, y: -40 + index * -25 },
                              symbol: {
                                type: "CIMTextSymbol",
                                fontFamilyName: "Arial",
                                fontStyleName: "Bold",
                                height: 12,
                                horizontalAlignment: "Center",
                                symbol: {
                                  type: "CIMPolygonSymbol",
                                  symbolLayers: [{ type: "CIMSolidFill", color: color }]
                                },
                                verticalAlignment: "Top"
                              },
                              textString: `${item.value}%`
                            },
                            {
                              type: "CIMMarkerGraphic",
                              geometry: { x: 22, y: -40 + index * -25 },
                              symbol: {
                                type: "CIMTextSymbol",
                                fontFamilyName: "Arial",
                                fontStyleName: "Bold",
                                height: 12,
                                horizontalAlignment: "Center",
                                symbol: {
                                  type: "CIMPolygonSymbol",
                                  symbolLayers: [{ type: "CIMSolidFill", color: [255, 255, 255, 255] }]
                                },
                                verticalAlignment: "Top"
                              },
                              textString: `当前水面率:`
                            }
                          ],
                          scaleSymbolsProportionally: true,
                          respectFrame: true
                        }
                      ]
                    }
                  }
                ]
              }
            ]
          }
        }
      ]
    });
  });
  return layers;
};
barConfig.baseX = bgBox.xMin + 0.5; // 固定靠左(背景框左边界+0.5留边)

const barLayers = [...buildBarGroup(barData1.value, barConfig.baseX)];

const symbol = new CIMSymbol({
  data: {
    type: "CIMSymbolReference",
    symbol: {
      type: "CIMPointSymbol",
      symbolLayers: [
        // 柱形图图层(包含文字)
        ...barLayers,
        // 标题
        {
          type: "CIMVectorMarker",
          enable: true,
          offsetX: -7.5,
          offsetY: 28,
          size: 80,
          frame: { xmin: 0, ymin: 0, xmax: 16, ymax: 16 },
          markerGraphics: [
            {
              type: "CIMMarkerGraphic",
              geometry: {
                x: 0,
                y: 0
              },
              symbol: {
                type: "CIMPolygonSymbol",
                symbolLayers: [
                  {
                    type: "CIMVectorMarker",
                    enable: true,
                    size: 12,
                    colorLocked: true,
                    anchorPointUnits: "Relative",
                    frame: { xmin: 0, ymin: 0, xmax: 16, ymax: 16 },
                    markerGraphics: [
                      {
                        type: "CIMMarkerGraphic",
                        geometry: { x: 0, y: 0 },
                        symbol: {
                          type: "CIMTextSymbol",
                          fontFamilyName: "Arial",
                          fontStyleName: "Bold",
                          height: 14,
                          horizontalAlignment: "Center",
                          offsetX: -70,
                          offsetY: 15,
                          symbol: {
                            type: "CIMPolygonSymbol",
                            symbolLayers: [{ type: "CIMSolidFill", color: [255, 255, 255, 255] }]
                          },
                          verticalAlignment: "Top"
                        },
                        textString: barData1.name
                      }
                    ],
                    scaleSymbolsProportionally: true,
                    respectFrame: true
                  }
                  // {
                  //   type: "CIMSolidFill",
                  //   color: [0, 163, 244, 255 * 0.6]
                  // }
                ]
              }
            }
          ]
        },
        // 基础多边形背景层
        {
          type: "CIMPictureMarker",
          enable: true,
          anchorPoint: {
            x: 0,
            y: 0
          },
          size: 80,
          scaleX: 1,
          tintColor: [255, 255, 255, 255],
          url: boxImg3
        }
      ]
    }
  }
});
return symbol;
}