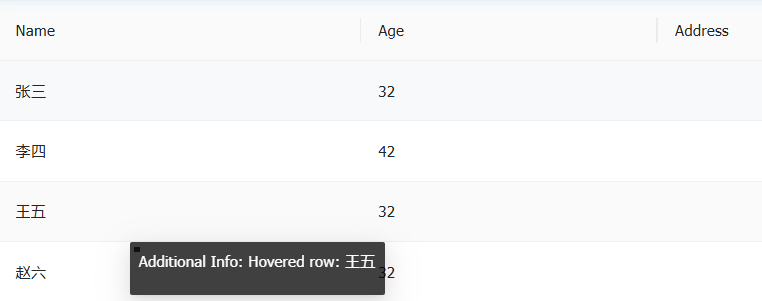
效果
代码
html
<template>
  <a-table :columns="columns" :data-source="data" :customRow="onClickRow" ref="tableRef" :scroll="{ x: 1500 }" />

  <!-- Tooltip组件 -->
  <a-tooltip
    v-model:visible="tooltipVisible"
    placement="bottom"
    trigger="manual"
    :overlay-style="{
      position: 'absolute',
      pointerEvents: 'none',
      zIndex: 9999,
      top: `${tooltipStyle.top} !important`,
      left: `${tooltipStyle.left} !important`
    }"
  >
    <template #title>
      <div>
        <p>Additional Info: {{ tipInfo }}</p>
      </div>
    </template>
    <!-- 隐藏触发元素:使其不占据任何位置,避免作为锚点 -->
    <span style="position: fixed; top: -9999px; left: -9999px; width: 0; height: 0"></span>
  </a-tooltip>
</template>

<script setup>
  import { ref, reactive } from 'vue';
  // 表格DOM引用
  const tableRef = ref(null);

  const tipInfo = ref(''); // 提示信息
  const tooltipVisible = ref(false); // tooltip的显示与隐藏
  const tooltipStyle = reactive({ left: '0px', top: '0px' }); // tooltip的位置样式

  // 模拟数据
  const data = reactive([
    { key: '1', name: '张三', age: 32 },
    { key: '2', name: '李四', age: 42 },
    { key: '3', name: '王五', age: 32 },
    { key: '4', name: '赵六', age: 32 }
  ]);

  // 列定义
  const columns = [
    { title: 'Name', dataIndex: 'name', key: 'name' },
    { title: 'Age', dataIndex: 'age', key: 'age' }
  ];

  onMounted(() => {
    // 绑定表格的鼠标移出mouseleave事件
    if (tableRef.value) {
      const tableDom = tableRef.value.$el || tableRef.value;
      tableDom.addEventListener('mouseleave', onTableMouseLeave);
    }
  });

  onUnmounted(() => {
    // 取消表格的鼠标移出mouseleave事件
    if (tableRef.value) {
      const tableDom = tableRef.value.$el || tableRef.value;
      tableDom.removeEventListener('mouseleave', onTableMouseLeave);
    }
  });
  // 行点击
  const onClickRow = record => {
    return {
      onMouseenter: event => handleRowMouseEnter(event, record) // 鼠标移入行
    };
  };
  // 鼠标进入行
  const handleRowMouseEnter = (e, record) => {
    // 计算正确位置(行视口位置 + 滚动偏移)
    const rect = e.currentTarget.getBoundingClientRect();
    const scrollTop = window.pageYOffset || document.documentElement.scrollTop;
    const scrollLeft = window.pageXOffset || document.documentElement.scrollLeft;
    // 滚动偏移 (横向偏移)
    tooltipStyle.left = `${scrollLeft + 120}px`;
    // 行的底部 + 滚动偏移 (纵向偏移)
    tooltipStyle.top = `${rect.bottom + scrollTop}px`;
    // 设置提示信息
    tipInfo.value = `Hovered row: ${record.name}`;
    nextTick(() => {
      tooltipVisible.value = true;
    });
  };

  // 鼠标离开表格
  const onTableMouseLeave = () => {
    // console.log('Leave');
    tooltipVisible.value = false;
  };
</script>