Flutter实时潮汐查询:智能预测潮汐时间
项目简介
实时潮汐查询是一款专为沿海地区用户打造的Flutter应用,帮助用户查询潮汐时间、潮高数据和月相信息。通过智能预测和可视化展示,让出海、垂钓、观潮等活动更加安全便捷。
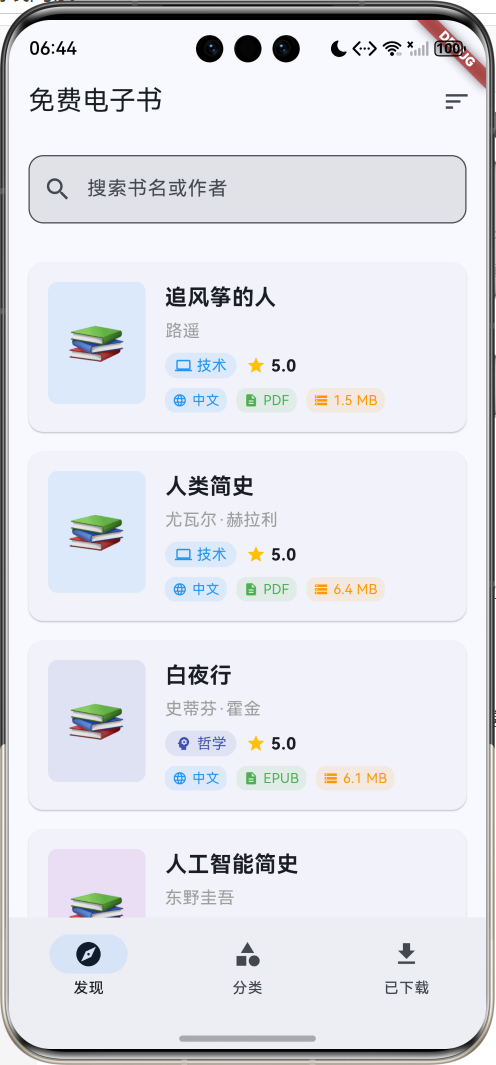
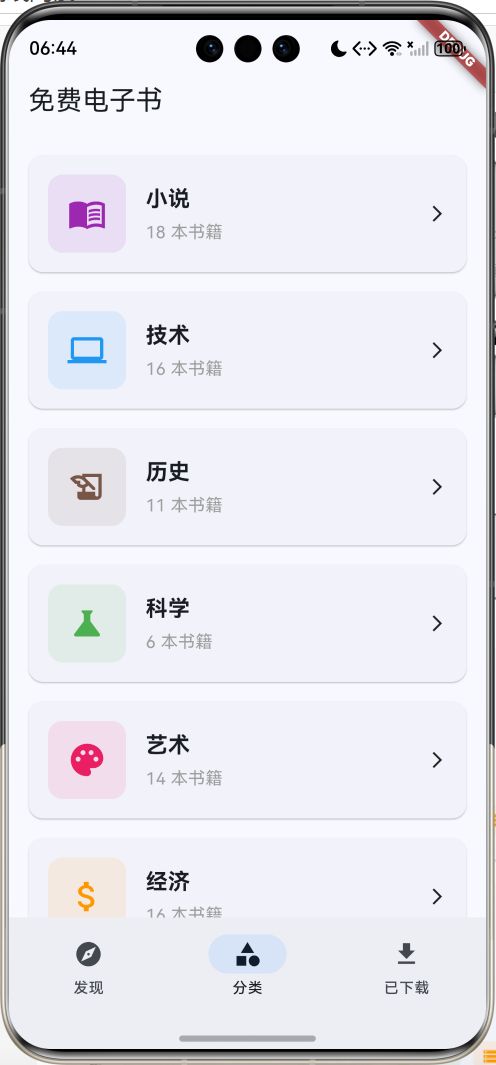
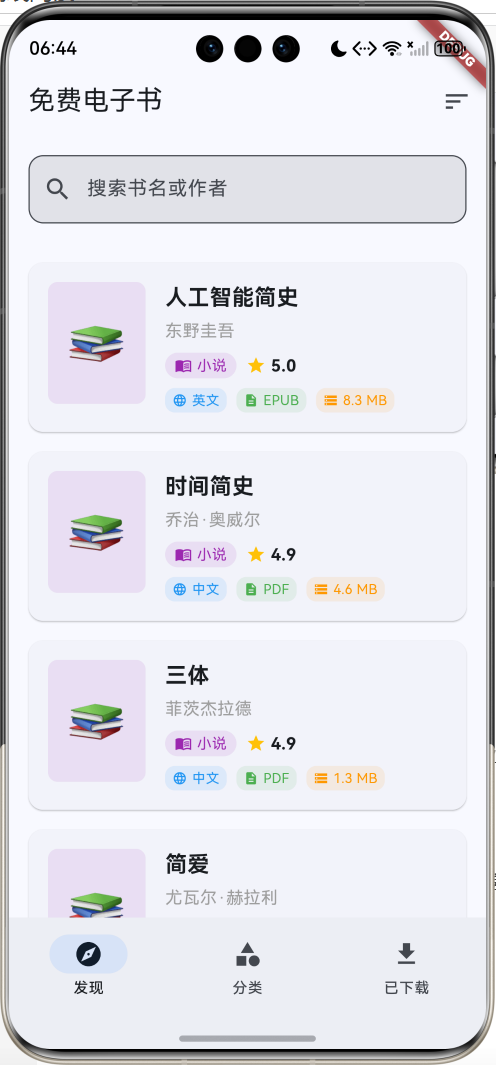
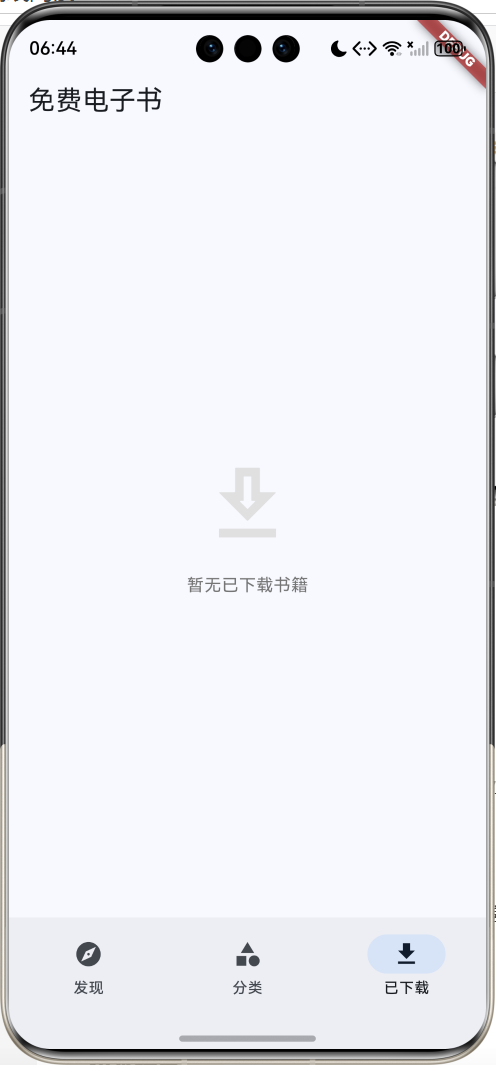
运行效果图
核心功能
- 城市选择:支持10个沿海城市查询
- 潮汐预测:显示未来3/7/15天潮汐数据
- 时刻表:每日高潮低潮时间精确到分钟
- 潮高数据:显示潮位高度(米)
- 潮汐等级:特大潮、大潮、中潮、平潮、小潮
- 月相信息:显示当日月相及其影响
- 潮汐曲线:可视化展示潮汐变化趋势
- 潮差计算:自动计算最高潮位与最低潮位差
- 知识科普:潮汐相关知识介绍
- 数据刷新:实时更新潮汐数据
技术特点
- Material Design 3设计风格
- 自定义Canvas绘制潮汐曲线
- 多城市数据模拟
- 月相可视化展示
- 响应式卡片布局
- 详细的数据展示
- 科普知识集成
核心代码实现
1. 沿海城市数据模型
dart
class CoastalCity {
  String name;              // 城市名称
  String province;          // 省份
  double latitude;          // 纬度
  double longitude;         // 经度
  String timezone;          // 时区

  CoastalCity({
    required this.name,
    required this.province,
    required this.latitude,
    required this.longitude,
    required this.timezone,
  });
}模型字段说明:
| 字段 | 类型 | 说明 |
|---|---|---|
| name | String | 城市名称 |
| province | String | 所属省份 |
| latitude | double | 纬度坐标 |
| longitude | double | 经度坐标 |
| timezone | String | 时区信息 |
支持城市列表:
| 城市 | 省份 | 纬度 | 经度 |
|---|---|---|---|
| 上海 | 上海市 | 31.2304 | 121.4737 |
| 青岛 | 山东省 | 36.0671 | 120.3826 |
| 大连 | 辽宁省 | 38.9140 | 121.6147 |
| 厦门 | 福建省 | 24.4798 | 118.0894 |
| 深圳 | 广东省 | 22.5431 | 114.0579 |
| 广州 | 广东省 | 23.1291 | 113.2644 |
| 宁波 | 浙江省 | 29.8683 | 121.5440 |
| 天津 | 天津市 | 39.0842 | 117.2010 |
| 烟台 | 山东省 | 37.4638 | 121.4478 |
| 海口 | 海南省 | 20.0444 | 110.1999 |
2. 潮汐数据模型
dart
class TideData {
  DateTime time;            // 潮汐时间
  String type;              // 类型(high/low)
  double height;            // 潮高(米)
  String level;             // 等级

  TideData({
    required this.time,
    required this.type,
    required this.height,
    required this.level,
  });

  // 类型文本
  String get typeText {
    switch (type) {
      case 'high':
        return '高潮';
      case 'low':
        return '低潮';
      default:
        return '未知';
    }
  }

  // 类型颜色
  Color get typeColor {
    switch (type) {
      case 'high':
        return Colors.blue;
      case 'low':
        return Colors.orange;
      default:
        return Colors.grey;
    }
  }

  // 类型图标
  IconData get typeIcon {
    switch (type) {
      case 'high':
        return Icons.arrow_upward;
      case 'low':
        return Icons.arrow_downward;
      default:
        return Icons.remove;
    }
  }

  // 等级文本
  String get levelText {
    switch (level) {
      case 'extreme_high':
        return '特大潮';
      case 'very_high':
        return '大潮';
      case 'high':
        return '中潮';
      case 'normal':
        return '平潮';
      case 'low':
        return '小潮';
      default:
        return '未知';
    }
  }

  // 等级颜色
  Color get levelColor {
    switch (level) {
      case 'extreme_high':
        return Colors.red;
      case 'very_high':
        return Colors.deepOrange;
      case 'high':
        return Colors.orange;
      case 'normal':
        return Colors.blue;
      case 'low':
        return Colors.green;
      default:
        return Colors.grey;
    }
  }
}模型字段说明:
| 字段 | 类型 | 说明 |
|---|---|---|
| time | DateTime | 潮汐发生时间 |
| type | String | 潮汐类型(high/low) |
| height | double | 潮位高度(米) |
| level | String | 潮汐等级 |
计算属性:
typeText:返回类型中文描述typeColor:返回类型对应颜色typeIcon:返回类型对应图标levelText:返回等级中文描述levelColor:返回等级对应颜色
潮汐类型:
| 类型 | 说明 | 颜色 | 图标 |
|---|---|---|---|
| high | 高潮 | 蓝色 | arrow_upward |
| low | 低潮 | 橙色 | arrow_downward |
潮汐等级:
| 等级 | 说明 | 潮高范围 | 颜色 |
|---|---|---|---|
| extreme_high | 特大潮 | >4.5m | 红色 |
| very_high | 大潮 | 4.0-4.5m | 深橙色 |
| high | 中潮 | 3.0-4.0m | 橙色 |
| normal | 平潮 | 2.0-3.0m | 蓝色 |
| low | 小潮 | <2.0m | 绿色 |
3. 每日潮汐数据模型
dart
class DailyTide {
  DateTime date;            // 日期
  List<TideData> tides;     // 潮汐列表
  double maxHeight;         // 最高潮位
  double minHeight;         // 最低潮位
  String moonPhase;         // 月相

  DailyTide({
    required this.date,
    required this.tides,
    required this.maxHeight,
    required this.minHeight,
    required this.moonPhase,
  });

  // 日期文本
  String get dateText {
    final weekdays = ['周一', '周二', '周三', '周四', '周五', '周六', '周日'];
    return '${date.month}月${date.day}日 ${weekdays[date.weekday - 1]}';
  }

  // 月相图标
  IconData get moonIcon {
    switch (moonPhase) {
      case 'new':
        return Icons.brightness_1;
      case 'waxing_crescent':
        return Icons.brightness_2;
      case 'first_quarter':
        return Icons.brightness_3;
      case 'waxing_gibbous':
        return Icons.brightness_4;
      case 'full':
        return Icons.brightness_5;
      case 'waning_gibbous':
        return Icons.brightness_6;
      case 'last_quarter':
        return Icons.brightness_7;
      case 'waning_crescent':
        return Icons.brightness_2;
      default:
        return Icons.brightness_1;
    }
  }

  // 月相文本
  String get moonPhaseText {
    switch (moonPhase) {
      case 'new':
        return '新月';
      case 'waxing_crescent':
        return '娥眉月';
      case 'first_quarter':
        return '上弦月';
      case 'waxing_gibbous':
        return '盈凸月';
      case 'full':
        return '满月';
      case 'waning_gibbous':
        return '亏凸月';
      case 'last_quarter':
        return '下弦月';
      case 'waning_crescent':
        return '残月';
      default:
        return '未知';
    }
  }
}模型字段说明:
| 字段 | 类型 | 说明 |
|---|---|---|
| date | DateTime | 日期 |
| tides | List | 当日潮汐列表 |
| maxHeight | double | 最高潮位(米) |
| minHeight | double | 最低潮位(米) |
| moonPhase | String | 月相类型 |
计算属性:
dateText:返回格式化日期文本moonIcon:返回月相对应图标moonPhaseText:返回月相中文名称
月相类型:
| 月相 | 中文名 | 图标 | 说明 |
|---|---|---|---|
| new | 新月 | brightness_1 | 月球位于太阳和地球之间 |
| waxing_crescent | 娥眉月 | brightness_2 | 新月之后的月牙 |
| first_quarter | 上弦月 | brightness_3 | 月球右半边被照亮 |
| waxing_gibbous | 盈凸月 | brightness_4 | 上弦月之后 |
| full | 满月 | brightness_5 | 月球完全被照亮 |
| waning_gibbous | 亏凸月 | brightness_6 | 满月之后 |
| last_quarter | 下弦月 | brightness_7 | 月球左半边被照亮 |
| waning_crescent | 残月 | brightness_2 | 下弦月之后 |
4. 潮汐数据生成
dart
void _generateTideData() {
  if (_selectedCity == null) return;

  final random = Random();
  final moonPhases = [
    'new', 'waxing_crescent', 'first_quarter', 'waxing_gibbous',
    'full', 'waning_gibbous', 'last_quarter', 'waning_crescent'
  ];

  _dailyTides = List.generate(_selectedDays, (dayIndex) {
    final date = _selectedDate.add(Duration(days: dayIndex));
    final tides = <TideData>[];

    // 每天生成4次潮汐(2次高潮2次低潮)
    final tideCount = 4;
    final baseHour = 6;

    for (int i = 0; i < tideCount; i++) {
      final isHigh = i % 2 == 0;
      final hour = baseHour + (i * 6) + random.nextInt(2) - 1;
      final minute = random.nextInt(60);

      final height = isHigh
          ? 2.5 + random.nextDouble() * 2.5  // 高潮:2.5-5.0m
          : 0.5 + random.nextDouble() * 1.0; // 低潮:0.5-1.5m

      String level;
      if (height > 4.5) {
        level = 'extreme_high';
      } else if (height > 4.0) {
        level = 'very_high';
      } else if (height > 3.0) {
        level = 'high';
      } else if (height > 2.0) {
        level = 'normal';
      } else {
        level = 'low';
      }

      tides.add(TideData(
        time: DateTime(date.year, date.month, date.day, hour, minute),
        type: isHigh ? 'high' : 'low',
        height: height,
        level: level,
      ));
    }

    tides.sort((a, b) => a.time.compareTo(b.time));

    final maxHeight = tides
        .where((t) => t.type == 'high')
        .map((t) => t.height)
        .reduce((a, b) => a > b ? a : b);
    final minHeight = tides
        .where((t) => t.type == 'low')
        .map((t) => t.height)
        .reduce((a, b) => a < b ? a : b);

    return DailyTide(
      date: date,
      tides: tides,
      maxHeight: maxHeight,
      minHeight: minHeight,
      moonPhase: moonPhases[(dayIndex + random.nextInt(3)) % moonPhases.length],
    );
  });

  setState(() {});
}数据生成逻辑:
- 每天生成4次潮汐(2次高潮、2次低潮)
- 高潮时间:约6:00、18:00(±1小时)
- 低潮时间:约12:00、24:00(±1小时)
- 高潮潮高:2.5-5.0米
- 低潮潮高:0.5-1.5米
- 根据潮高自动判定等级
- 按时间排序
- 计算最高潮位和最低潮位
- 随机分配月相
潮汐规律:
- 一天通常有2次高潮和2次低潮
- 高潮和低潮间隔约6小时
- 相邻两天的潮汐时间推迟约50分钟
- 月相影响潮汐大小
5. 城市选择对话框
dart
void _selectCity() {
  showModalBottomSheet(
    context: context,
    builder: (context) => Container(
      padding: const EdgeInsets.all(16),
      child: Column(
        mainAxisSize: MainAxisSize.min,
        crossAxisAlignment: CrossAxisAlignment.start,
        children: [
          const Text(
            '选择城市',
            style: TextStyle(fontSize: 18, fontWeight: FontWeight.bold),
          ),
          const SizedBox(height: 16),
          Expanded(
            child: ListView.builder(
              itemCount: _cities.length,
              itemBuilder: (context, index) {
                final city = _cities[index];
                return ListTile(
                  leading: const Icon(Icons.location_city),
                  title: Text(city.name),
                  subtitle: Text(city.province),
                  trailing: _selectedCity?.name == city.name
                      ? const Icon(Icons.check, color: Colors.blue)
                      : null,
                  onTap: () {
                    setState(() {
                      _selectedCity = city;
                      _generateTideData();
                    });
                    Navigator.pop(context);
                  },
                );
              },
            ),
          ),
        ],
      ),
    ),
  );
}交互设计:
- 使用ModalBottomSheet展示城市列表
- ListView.builder实现可滚动列表
- 显示城市名称和省份
- 选中城市显示勾选图标
- 选择后自动关闭对话框并刷新数据
6. 查询天数选择
dart
void _selectDateRange() {
  showModalBottomSheet(
    context: context,
    builder: (context) => Container(
      padding: const EdgeInsets.all(16),
      child: Column(
        mainAxisSize: MainAxisSize.min,
        crossAxisAlignment: CrossAxisAlignment.start,
        children: [
          const Text(
            '选择查询天数',
            style: TextStyle(fontSize: 18, fontWeight: FontWeight.bold),
          ),
          const SizedBox(height: 16),
          RadioListTile<int>(
            title: const Text('未来3天'),
            value: 3,
            groupValue: _selectedDays,
            onChanged: (value) {
              setState(() {
                _selectedDays = value!;
                _generateTideData();
              });
              Navigator.pop(context);
            },
          ),
          RadioListTile<int>(
            title: const Text('未来7天'),
            value: 7,
            groupValue: _selectedDays,
            onChanged: (value) {
              setState(() {
                _selectedDays = value!;
                _generateTideData();
              });
              Navigator.pop(context);
            },
          ),
          RadioListTile<int>(
            title: const Text('未来15天'),
            value: 15,
            groupValue: _selectedDays,
            onChanged: (value) {
              setState(() {
                _selectedDays = value!;
                _generateTideData();
              });
              Navigator.pop(context);
            },
          ),
        ],
      ),
    ),
  );
}查询天数选项:
- 未来3天:短期预测,适合近期出海
- 未来7天:一周预测,适合周计划
- 未来15天:半月预测,适合长期规划
7. 每日潮汐卡片
dart
Widget _buildDailyTideCard(DailyTide dailyTide) {
  return Card(
    margin: const EdgeInsets.only(bottom: 16),
    child: InkWell(
      onTap: () {
        Navigator.push(
          context,
          MaterialPageRoute(
            builder: (_) => TideDetailPage(
              city: _selectedCity!,
              dailyTide: dailyTide,
            ),
          ),
        );
      },
      child: Padding(
        padding: const EdgeInsets.all(16),
        child: Column(
          crossAxisAlignment: CrossAxisAlignment.start,
          children: [
            // 顶部:月相、日期、最高最低潮位
            Row(
              children: [
                Container(
                  padding: const EdgeInsets.all(8),
                  decoration: BoxDecoration(
                    color: Colors.blue.withValues(alpha: 0.1),
                    borderRadius: BorderRadius.circular(8),
                  ),
                  child: Icon(
                    dailyTide.moonIcon,
                    color: Colors.blue,
                    size: 24,
                  ),
                ),
                const SizedBox(width: 12),
                Expanded(
                  child: Column(
                    crossAxisAlignment: CrossAxisAlignment.start,
                    children: [
                      Text(
                        dailyTide.dateText,
                        style: const TextStyle(
                          fontSize: 18,
                          fontWeight: FontWeight.bold,
                        ),
                      ),
                      Text(
                        dailyTide.moonPhaseText,
                        style: const TextStyle(
                          fontSize: 14,
                          color: Colors.grey,
                        ),
                      ),
                    ],
                  ),
                ),
                Column(
                  crossAxisAlignment: CrossAxisAlignment.end,
                  children: [
                    Row(
                      children: [
                        const Icon(Icons.arrow_upward,
                            size: 16, color: Colors.blue),
                        Text(
                          '${dailyTide.maxHeight.toStringAsFixed(2)}m',
                          style: const TextStyle(
                            fontSize: 14,
                            fontWeight: FontWeight.bold,
                            color: Colors.blue,
                          ),
                        ),
                      ],
                    ),
                    Row(
                      children: [
                        const Icon(Icons.arrow_downward,
                            size: 16, color: Colors.orange),
                        Text(
                          '${dailyTide.minHeight.toStringAsFixed(2)}m',
                          style: const TextStyle(
                            fontSize: 14,
                            fontWeight: FontWeight.bold,
                            color: Colors.orange,
                          ),
                        ),
                      ],
                    ),
                  ],
                ),
              ],
            ),
            const SizedBox(height: 16),
            const Divider(),
            const SizedBox(height: 8),
            // 潮汐时刻列表
            ...dailyTide.tides.map((tide) => _buildTideItem(tide)),
          ],
        ),
      ),
    ),
  );
}卡片布局结构:
- 顶部:月相图标、日期、星期、最高最低潮位
- 分隔线
- 潮汐时刻列表(每个潮汐的时间、类型、潮高、等级)
8. 潮汐时刻项
dart
Widget _buildTideItem(TideData tide) {
  return Container(
    margin: const EdgeInsets.only(bottom: 8),
    padding: const EdgeInsets.all(12),
    decoration: BoxDecoration(
      color: tide.typeColor.withValues(alpha: 0.1),
      borderRadius: BorderRadius.circular(8),
    ),
    child: Row(
      children: [
        Container(
          padding: const EdgeInsets.all(8),
          decoration: BoxDecoration(
            color: tide.typeColor,
            borderRadius: BorderRadius.circular(8),
          ),
          child: Icon(
            tide.typeIcon,
            color: Colors.white,
            size: 20,
          ),
        ),
        const SizedBox(width: 12),
        Expanded(
          child: Column(
            crossAxisAlignment: CrossAxisAlignment.start,
            children: [
              Text(
                tide.typeText,
                style: TextStyle(
                  fontSize: 16,
                  fontWeight: FontWeight.bold,
                  color: tide.typeColor,
                ),
              ),
              Text(
                '${tide.time.hour.toString().padLeft(2, '0')}:${tide.time.minute.toString().padLeft(2, '0')}',
                style: const TextStyle(
                  fontSize: 14,
                  color: Colors.grey,
                ),
              ),
            ],
          ),
        ),
        Column(
          crossAxisAlignment: CrossAxisAlignment.end,
          children: [
            Text(
              '${tide.height.toStringAsFixed(2)}m',
              style: TextStyle(
                fontSize: 18,
                fontWeight: FontWeight.bold,
                color: tide.typeColor,
              ),
            ),
            Container(
              padding: const EdgeInsets.symmetric(horizontal: 8, vertical: 2),
              decoration: BoxDecoration(
                color: tide.levelColor,
                borderRadius: BorderRadius.circular(12),
              ),
              child: Text(
                tide.levelText,
                style: const TextStyle(
                  fontSize: 12,
                  color: Colors.white,
                ),
              ),
            ),
          ],
        ),
      ],
    ),
  );
}时刻项设计:
- 左侧:类型图标(高潮/低潮)
- 中间:类型文本、时间
- 右侧:潮高数值、等级标签
9. 潮汐详情页
dart
class TideDetailPage extends StatelessWidget {
  final CoastalCity city;
  final DailyTide dailyTide;

  const TideDetailPage({
    super.key,
    required this.city,
    required this.dailyTide,
  });

  @override
  Widget build(BuildContext context) {
    return Scaffold(
      appBar: AppBar(
        title: Text('${city.name} - ${dailyTide.dateText}'),
      ),
      body: SingleChildScrollView(
        child: Column(
          crossAxisAlignment: CrossAxisAlignment.start,
          children: [
            _buildDateInfo(),
            _buildTideChart(),
            _buildTideList(),
            _buildMoonInfo(),
            _buildTideKnowledge(),
          ],
        ),
      ),
    );
  }
}详情页结构:
- 日期信息卡片:日期、月相、最高最低潮位、潮差
- 潮汐曲线卡片:可视化展示潮汐变化
- 潮汐时刻表卡片:详细的时刻列表
- 月相信息卡片:月相图标、名称、描述
- 潮汐知识卡片:科普知识
10. 潮汐曲线绘制
dart
class TideChartPainter extends CustomPainter {
  final List<TideData> tides;

  TideChartPainter(this.tides);

  @override
  void paint(Canvas canvas, Size size) {
    final paint = Paint()
      ..style = PaintingStyle.stroke
      ..strokeWidth = 3;

    final maxHeight = tides.map((t) => t.height).reduce((a, b) => a > b ? a : b);
    final minHeight = tides.map((t) => t.height).reduce((a, b) => a < b ? a : b);
    final heightRange = maxHeight - minHeight;

    final path = Path();
    for (int i = 0; i < tides.length; i++) {
      final x = (size.width / (tides.length - 1)) * i;
      final y = size.height -
          ((tides[i].height - minHeight) / heightRange) * size.height;

      if (i == 0) {
        path.moveTo(x, y);
      } else {
        path.lineTo(x, y);
      }

      // 绘制点
      paint.color = tides[i].typeColor;
      canvas.drawCircle(Offset(x, y), 6, paint);
    }

    // 绘制曲线
    paint.color = Colors.blue;
    canvas.drawPath(path, paint);

    // 绘制网格线
    final gridPaint = Paint()
      ..color = Colors.grey.withValues(alpha: 0.3)
      ..strokeWidth = 1;

    for (int i = 0; i <= 4; i++) {
      final y = (size.height / 4) * i;
      canvas.drawLine(Offset(0, y), Offset(size.width, y), gridPaint);
    }
  }

  @override
  bool shouldRepaint(covariant CustomPainter oldDelegate) => true;
}绘制逻辑:
- 计算最高和最低潮位
- 计算潮位范围
- 将潮高映射到画布坐标
- 绘制连接各点的曲线
- 绘制潮汐点(高潮蓝色、低潮橙色)
- 绘制网格线辅助阅读
坐标转换:
y = height - ((tideHeight - minHeight) / heightRange) * height11. 月相信息展示
dart
Widget _buildMoonInfo() {
  return Card(
    margin: const EdgeInsets.symmetric(horizontal: 16, vertical: 8),
    child: Padding(
      padding: const EdgeInsets.all(16),
      child: Column(
        crossAxisAlignment: CrossAxisAlignment.start,
        children: [
          const Row(
            children: [
              Icon(Icons.brightness_3, color: Colors.blue),
              SizedBox(width: 8),
              Text(
                '月相信息',
                style: TextStyle(fontSize: 18, fontWeight: FontWeight.bold),
              ),
            ],
          ),
          const SizedBox(height: 16),
          Row(
            children: [
              Container(
                padding: const EdgeInsets.all(24),
                decoration: BoxDecoration(
                  color: Colors.blue.withValues(alpha: 0.1),
                  borderRadius: BorderRadius.circular(16),
                ),
                child: Icon(
                  dailyTide.moonIcon,
                  size: 64,
                  color: Colors.blue,
                ),
              ),
              const SizedBox(width: 24),
              Expanded(
                child: Column(
                  crossAxisAlignment: CrossAxisAlignment.start,
                  children: [
                    Text(
                      dailyTide.moonPhaseText,
                      style: const TextStyle(
                        fontSize: 24,
                        fontWeight: FontWeight.bold,
                      ),
                    ),
                    const SizedBox(height: 8),
                    Text(
                      _getMoonPhaseDescription(dailyTide.moonPhase),
                      style: const TextStyle(
                        fontSize: 14,
                        color: Colors.grey,
                      ),
                    ),
                  ],
                ),
              ),
            ],
          ),
        ],
      ),
    ),
  );
}

String _getMoonPhaseDescription(String phase) {
  switch (phase) {
    case 'new':
      return '月球位于太阳和地球之间,朝向地球的一面不被太阳照亮。此时潮汐力较大,易形成大潮。';
    case 'first_quarter':
      return '月球、地球、太阳成直角,月球的右半边被照亮。此时潮汐力较小,易形成小潮。';
    case 'full':
      return '月球位于地球和太阳之间的对面,朝向地球的一面完全被太阳照亮。此时潮汐力最大,形成大潮。';
    case 'last_quarter':
      return '月球、地球、太阳再次成直角,月球的左半边被照亮。此时潮汐力较小,易形成小潮。';
    default:
      return '';
  }
}月相与潮汐关系:
- 新月和满月:潮汐力最大,形成大潮
- 上弦月和下弦月:潮汐力较小,形成小潮
- 月相周期约29.5天
12. 潮汐知识科普
dart
Widget _buildTideKnowledge() {
  return Card(
    margin: const EdgeInsets.all(16),
    child: Padding(
      padding: const EdgeInsets.all(16),
      child: Column(
        crossAxisAlignment: CrossAxisAlignment.start,
        children: [
          const Row(
            children: [
              Icon(Icons.info_outline, color: Colors.blue),
              SizedBox(width: 8),
              Text(
                '潮汐知识',
                style: TextStyle(fontSize: 18, fontWeight: FontWeight.bold),
              ),
            ],
          ),
          const SizedBox(height: 16),
          _buildKnowledgeItem(
            '什么是潮汐?',
            '潮汐是海水在天体(主要是月球和太阳)引潮力作用下所产生的周期性运动。',
          ),
          const SizedBox(height: 12),
          _buildKnowledgeItem(
            '高潮和低潮',
            '海水上涨到最高位置称为高潮,下降到最低位置称为低潮。一般每天有两次高潮和两次低潮。',
          ),
          const SizedBox(height: 12),
          _buildKnowledgeItem(
            '大潮和小潮',
            '农历初一、十五前后,月球、地球、太阳在一条直线上,引潮力最大,形成大潮。农历初八、二十三前后形成小潮。',
          ),
          const SizedBox(height: 12),
          _buildKnowledgeItem(
            '潮汐的影响',
            '潮汐影响航海、渔业、海洋工程等。了解潮汐规律对海上活动安全至关重要。',
          ),
        ],
      ),
    ),
  );
}

Widget _buildKnowledgeItem(String title, String content) {
  return Container(
    padding: const EdgeInsets.all(12),
    decoration: BoxDecoration(
      color: Colors.blue.withValues(alpha: 0.05),
      borderRadius: BorderRadius.circular(8),
    ),
    child: Column(
      crossAxisAlignment: CrossAxisAlignment.start,
      children: [
        Text(
          title,
          style: const TextStyle(
            fontSize: 16,
            fontWeight: FontWeight.bold,
          ),
        ),
        const SizedBox(height: 8),
        Text(
          content,
          style: const TextStyle(
            fontSize: 14,
            color: Colors.grey,
            height: 1.5,
          ),
        ),
      ],
    ),
  );
}科普内容:
- 潮汐的定义和成因
- 高潮和低潮的概念
- 大潮和小潮的形成
- 潮汐对人类活动的影响
技术要点详解
1. CustomPainter自定义绘制
CustomPainter是Flutter中用于自定义绘制的强大工具。
基本用法:
dart
class MyPainter extends CustomPainter {
  @override
  void paint(Canvas canvas, Size size) {
    // 绘制逻辑
  }

  @override
  bool shouldRepaint(covariant CustomPainter oldDelegate) => true;
}

// 使用
CustomPaint(
  painter: MyPainter(),
  child: Container(),
)Canvas常用方法:
drawLine:绘制直线drawCircle:绘制圆形drawPath:绘制路径drawRect:绘制矩形drawText:绘制文本
Paint属性:
color:颜色strokeWidth:线宽style:样式(填充/描边)
使用场景:
- 图表绘制
- 自定义形状
- 动画效果
- 数据可视化
2. Path路径绘制
Path用于创建复杂的绘制路径。
基本用法:
dart
final path = Path();
path.moveTo(x1, y1);  // 移动到起点
path.lineTo(x2, y2);  // 画线到终点
path.quadraticBezierTo(cx, cy, x, y);  // 二次贝塞尔曲线
path.cubicTo(cx1, cy1, cx2, cy2, x, y);  // 三次贝塞尔曲线
path.close();  // 闭合路径

canvas.drawPath(path, paint);常用方法:
moveTo:移动画笔lineTo:画直线arcTo:画圆弧addRect:添加矩形addOval:添加椭圆
使用场景:
- 曲线图表
- 自定义形状
- 路径动画
3. 坐标系统转换
在绘制图表时,需要将数据坐标转换为画布坐标。
转换公式:
dart
// 数据范围:minValue ~ maxValue
// 画布范围:0 ~ size.height

// Y轴转换(注意Y轴方向相反)
double dataToCanvasY(double value) {
  final range = maxValue - minValue;
  final ratio = (value - minValue) / range;
  return size.height - (ratio * size.height);
}

// X轴转换
double dataToCanvasX(int index, int total) {
  return (size.width / (total - 1)) * index;
}注意事项:
- Canvas的Y轴向下为正
- 数据的Y轴向上为正
- 需要进行翻转转换
4. 计算属性的高级用法
计算属性可以根据对象状态动态返回值,减少数据冗余。
示例:
dart
class TideData {
  String type;
  double height;
  String level;

  // 类型相关属性
  String get typeText => type == 'high' ? '高潮' : '低潮';
  Color get typeColor => type == 'high' ? Colors.blue : Colors.orange;
  IconData get typeIcon => type == 'high' ? Icons.arrow_upward : Icons.arrow_downward;

  // 等级相关属性
  String get levelText {
    switch (level) {
      case 'extreme_high': return '特大潮';
      case 'very_high': return '大潮';
      case 'high': return '中潮';
      case 'normal': return '平潮';
      case 'low': return '小潮';
      default: return '未知';
    }
  }

  Color get levelColor {
    switch (level) {
      case 'extreme_high': return Colors.red;
      case 'very_high': return Colors.deepOrange;
      case 'high': return Colors.orange;
      case 'normal': return Colors.blue;
      case 'low': return Colors.green;
      default: return Colors.grey;
    }
  }
}优势:
- 减少存储空间
- 保持数据一致性
- 简化代码逻辑
- 便于维护和扩展
5. DateTime时间处理
Flutter中的DateTime类提供了丰富的时间处理功能。
基本用法:
dart
// 获取当前时间
final now = DateTime.now();

// 创建指定时间
final date = DateTime(2024, 1, 22, 14, 30);

// 时间计算
final tomorrow = now.add(Duration(days: 1));
final yesterday = now.subtract(Duration(days: 1));

// 时间比较
if (date1.isAfter(date2)) { }
if (date1.isBefore(date2)) { }
if (date1.isAtSameMomentAs(date2)) { }

// 时间格式化
final hour = date.hour.toString().padLeft(2, '0');
final minute = date.minute.toString().padLeft(2, '0');
final timeString = '$hour:$minute';

// 星期几
final weekday = date.weekday; // 1-7 (周一到周日)常用属性:
year:年份month:月份(1-12)day:日期(1-31)hour:小时(0-23)minute:分钟(0-59)second:秒(0-59)weekday:星期(1-7)
使用场景:
- 潮汐时间计算
- 日期范围查询
- 时间格式化显示
6. List集合操作
Dart的List提供了丰富的集合操作方法。
常用方法:
dart
// 生成列表
final list = List.generate(10, (index) => index * 2);

// 映射转换
final heights = tides.map((t) => t.height).toList();

// 筛选
final highTides = tides.where((t) => t.type == 'high').toList();

// 排序
tides.sort((a, b) => a.time.compareTo(b.time));

// 查找最大值
final maxHeight = heights.reduce((a, b) => a > b ? a : b);

// 查找最小值
final minHeight = heights.reduce((a, b) => a < b ? a : b);

// 求和
final total = heights.reduce((a, b) => a + b);

// 平均值
final average = total / heights.length;链式操作:
dart
final result = tides
    .where((t) => t.type == 'high')
    .map((t) => t.height)
    .reduce((a, b) => a > b ? a : b);
7. 数据可视化技巧
在潮汐曲线绘制中使用的可视化技巧。
网格线绘制:
dart
// 绘制水平网格线
for (int i = 0; i <= 4; i++) {
  final y = (size.height / 4) * i;
  canvas.drawLine(
    Offset(0, y),
    Offset(size.width, y),
    gridPaint,
  );
}

// 绘制垂直网格线
for (int i = 0; i <= 4; i++) {
  final x = (size.width / 4) * i;
  canvas.drawLine(
    Offset(x, 0),
    Offset(x, size.height),
    gridPaint,
  );
}数据点标记:
dart
// 在曲线上标记数据点
for (int i = 0; i < tides.length; i++) {
  final x = calculateX(i);
  final y = calculateY(tides[i].height);

  // 绘制圆点
  canvas.drawCircle(
    Offset(x, y),
    6,
    Paint()..color = tides[i].typeColor,
  );

  // 绘制数值标签(可选)
  final textPainter = TextPainter(
    text: TextSpan(
      text: tides[i].height.toStringAsFixed(1),
      style: TextStyle(color: Colors.black, fontSize: 12),
    ),
    textDirection: TextDirection.ltr,
  );
  textPainter.layout();
  textPainter.paint(canvas, Offset(x - 10, y - 20));
}颜色渐变:
dart
final gradient = LinearGradient(
  colors: [Colors.blue, Colors.lightBlue],
  begin: Alignment.topCenter,
  end: Alignment.bottomCenter,
);

final paint = Paint()
  ..shader = gradient.createShader(
    Rect.fromLTWH(0, 0, size.width, size.height),
  );
8. 状态管理最佳实践
在潮汐查询应用中的状态管理。
状态变量:
dart
CoastalCity? _selectedCity;           // 选中城市
List<DailyTide> _dailyTides = [];     // 潮汐数据
DateTime _selectedDate = DateTime.now();  // 选中日期
int _selectedDays = 7; // 查询天数状态更新:
dart
void _updateCity(CoastalCity city) {
  setState(() {
    _selectedCity = city;
    _generateTideData();  // 重新生成数据
  });
}

void _updateDateRange(int days) {
  setState(() {
    _selectedDays = days;
    _generateTideData();  // 重新生成数据
  });
}最佳实践:
- 只在setState中修改状态
- 避免在build方法中修改状态
- 合理拆分Widget减少重建范围
- 使用const构造函数优化性能
9. 数据模型设计
良好的数据模型设计是应用的基础。
模型层次:
CoastalCity (城市)
    └── DailyTide (每日潮汐)
└── TideData (单次潮汐)关系设计:
- 一个城市有多天的潮汐数据
- 每天有多次潮汐(通常4次)
- 每次潮汐包含时间、类型、潮高、等级
数据验证:
dart
class TideData {
  final DateTime time;
  final String type;
  final double height;
  final String level;

  TideData({
    required this.time,
    required this.type,
    required this.height,
    required this.level,
  }) {
    // 验证类型
    assert(type == 'high' || type == 'low', 'Invalid tide type');

    // 验证潮高
    assert(height >= 0 && height <= 10, 'Invalid tide height');

    // 验证等级
    assert([
      'extreme_high',
      'very_high',
      'high',
      'normal',
      'low'
    ].contains(level), 'Invalid tide level');
  }
}
10. 性能优化技巧
提升应用性能的实用技巧。
ListView优化:
dart
// 使用ListView.builder实现懒加载
ListView.builder(
  itemCount: _dailyTides.length,
  itemBuilder: (context, index) {
    return _buildDailyTideCard(_dailyTides[index]);
  },
)const构造函数:
dart
// 使用const减少重建
const Text('潮汐查询')
const Icon(Icons.waves)
const SizedBox(height: 16)缓存计算结果:
dart
class DailyTide {
  List<TideData> tides;

  // 缓存最大值
  double? _cachedMaxHeight;
  double get maxHeight {
    _cachedMaxHeight ??= tides
        .where((t) => t.type == 'high')
        .map((t) => t.height)
        .reduce((a, b) => a > b ? a : b);
    return _cachedMaxHeight!;
  }
}避免不必要的重建:
dart
// 将不变的Widget提取为独立组件
class StaticHeader extends StatelessWidget {
  const StaticHeader({super.key});

  @override
  Widget build(BuildContext context) {
    return const Text('标题');
  }
}
功能扩展方向
1. 实时潮汐数据
接入真实的潮汐数据API,提供准确的预测。
实现思路:
- 接入国家海洋局潮汐数据API
- 使用第三方潮汐预测服务
- 实时更新潮汐数据
- 缓存历史数据
API示例:
dart
import 'package:http/http.dart' as http;

class TideApiService {
  static const String baseUrl = 'https://api.tide.example.com';

  Future<List<TideData>> fetchTideData(
    String cityCode,
    DateTime startDate,
    DateTime endDate,
  ) async {
    final response = await http.get(
      Uri.parse('$baseUrl/tide?city=$cityCode&start=$startDate&end=$endDate'),
    );

    if (response.statusCode == 200) {
      final data = jsonDecode(response.body);
      return (data['tides'] as List)
          .map((json) => TideData.fromJson(json))
          .toList();
    } else {
      throw Exception('Failed to load tide data');
    }
  }
}
2. 地图集成
在地图上显示沿海城市和潮汐站点。
实现思路:
- 集成高德地图或百度地图SDK
- 在地图上标注潮汐站点
- 点击站点显示潮汐信息
- 支持地图缩放和拖动
- 显示用户当前位置
代码示例:
dart
AMapWidget(
  markers: _cities.map((city) => Marker(
    position: LatLng(city.latitude, city.longitude),
    icon: BitmapDescriptor.fromAssetImage('assets/tide_marker.png'),
    infoWindow: InfoWindow(
      title: city.name,
      snippet: '点击查看潮汐信息',
    ),
    onTap: () => _showCityTide(city),
  )).toSet(),
)
3. 潮汐预警
根据潮汐高度发送预警通知。
实现思路:
- 设置潮汐高度阈值
- 监测潮汐数据变化
- 发送推送通知
- 显示预警信息
- 支持自定义预警规则
预警类型:
- 特大潮预警:潮高>4.5m
- 大潮预警:潮高>4.0m
- 低潮预警:潮高<1.0m
代码示例:
dart
import 'package:flutter_local_notifications/flutter_local_notifications.dart';

class TideAlertService {
  final FlutterLocalNotificationsPlugin _notifications =
      FlutterLocalNotificationsPlugin();

  Future<void> checkAndAlert(List<TideData> tides) async {
    for (var tide in tides) {
      if (tide.height > 4.5) {
        await _showNotification(
          '特大潮预警',
          '${tide.time.hour}:${tide.time.minute} 预计潮高${tide.height.toStringAsFixed(2)}m',
        );
      }
    }
  }

  Future<void> _showNotification(String title, String body) async {
    const androidDetails = AndroidNotificationDetails(
      'tide_alert',
      '潮汐预警',
      importance: Importance.high,
      priority: Priority.high,
    );
    const details = NotificationDetails(android: androidDetails);
    await _notifications.show(0, title, body, details);
  }
}
4. 钓鱼时机推荐
根据潮汐数据推荐最佳钓鱼时间。
实现思路:
- 分析潮汐变化规律
- 计算最佳钓鱼时段
- 考虑月相影响
- 提供钓鱼建议
- 显示鱼类活跃度
钓鱼规律:
- 涨潮前后1-2小时:鱼类活跃
- 落潮前后1-2小时:鱼类活跃
- 大潮期间:鱼类更活跃
- 新月和满月:最佳钓鱼时机
代码示例:
dart
class FishingRecommendation {
  static List<FishingTime> getBestTimes(DailyTide dailyTide) {
    final recommendations = <FishingTime>[];

    for (var tide in dailyTide.tides) {
      // 涨潮前1小时到涨潮后1小时
      if (tide.type == 'high') {
        recommendations.add(FishingTime(
          start: tide.time.subtract(Duration(hours: 1)),
          end: tide.time.add(Duration(hours: 1)),
          quality: 'excellent',
          reason: '涨潮期,鱼类活跃',
        ));
      }

      // 落潮前1小时到落潮后1小时
      if (tide.type == 'low') {
        recommendations.add(FishingTime(
          start: tide.time.subtract(Duration(hours: 1)),
          end: tide.time.add(Duration(hours: 1)),
          quality: 'good',
          reason: '落潮期,鱼类觅食',
        ));
      }
    }

    return recommendations;
  }
}
5. 历史数据对比
对比不同日期的潮汐数据,分析变化趋势。
实现思路:
- 保存历史潮汐数据
- 选择对比日期
- 绘制对比曲线
- 显示差异分析
- 导出对比报告
代码示例:
dart
class TideComparisonPage extends StatelessWidget {
  final DailyTide tide1;
  final DailyTide tide2;

  Widget build(BuildContext context) {
    return Column(
      children: [
        Text('${tide1.dateText} vs ${tide2.dateText}'),
        CustomPaint(
          painter: ComparisonChartPainter(tide1.tides, tide2.tides),
        ),
        _buildComparisonTable(),
      ],
    );
  }

  Widget _buildComparisonTable() {
    return Table(
      children: [
        TableRow(children: [
          Text('日期'),
          Text(tide1.dateText),
          Text(tide2.dateText),
        ]),
        TableRow(children: [
          Text('最高潮位'),
          Text('${tide1.maxHeight.toStringAsFixed(2)}m'),
          Text('${tide2.maxHeight.toStringAsFixed(2)}m'),
        ]),
        TableRow(children: [
          Text('最低潮位'),
          Text('${tide1.minHeight.toStringAsFixed(2)}m'),
          Text('${tide2.minHeight.toStringAsFixed(2)}m'),
        ]),
      ],
    );
  }
}
6. 潮汐日历
以日历形式展示整月的潮汐信息。
实现思路:
- 使用table_calendar插件
- 在日历上标注潮汐等级
- 点击日期查看详情
- 显示月相变化
- 标注大潮小潮日期
代码示例:
dart
import 'package:table_calendar/table_calendar.dart';

class TideCalendarPage extends StatefulWidget {
  @override
  State<TideCalendarPage> createState() => _TideCalendarPageState();
}

class _TideCalendarPageState extends State<TideCalendarPage> {
  DateTime _selectedDay = DateTime.now();
  Map<DateTime, DailyTide> _tideMap = {};

  @override
  Widget build(BuildContext context) {
    return TableCalendar(
      firstDay: DateTime.now(),
      lastDay: DateTime.now().add(Duration(days: 90)),
      focusedDay: _selectedDay,
      selectedDayPredicate: (day) => isSameDay(_selectedDay, day),
      onDaySelected: (selectedDay, focusedDay) {
        setState(() {
          _selectedDay = selectedDay;
        });
        _showTideDetail(_tideMap[selectedDay]);
      },
      calendarBuilders: CalendarBuilders(
        markerBuilder: (context, date, events) {
          final tide = _tideMap[date];
          if (tide != null) {
            return Container(
              width: 8,
              height: 8,
              decoration: BoxDecoration(
                color: _getTideColor(tide.maxHeight),
                shape: BoxShape.circle,
              ),
            );
          }
          return null;
        },
      ),
    );
  }

  Color _getTideColor(double height) {
    if (height > 4.5) return Colors.red;
    if (height > 4.0) return Colors.orange;
    if (height > 3.0) return Colors.blue;
    return Colors.green;
  }
}
7. 潮汐统计
统计分析潮汐数据,生成报表。
实现思路:
- 统计月度潮汐数据
- 计算平均潮高
- 分析潮汐规律
- 生成图表报告
- 导出PDF报告
统计指标:
- 月平均最高潮位
- 月平均最低潮位
- 大潮天数
- 小潮天数
- 潮差变化趋势
8. 离线功能
支持离线查看已缓存的潮汐数据。
实现思路:
- 缓存潮汐数据到本地
- 检测网络状态
- 离线模式提示
- 数据过期提醒
- 网络恢复后自动更新
代码示例:
dart
import 'package:connectivity_plus/connectivity_plus.dart';

class OfflineTideService {
  Future<bool> isOnline() async {
    final result = await Connectivity().checkConnectivity();
    return result != ConnectivityResult.none;
  }

  Future<void> cacheTideData(List<DailyTide> tides) async {
    final prefs = await SharedPreferences.getInstance();
    final jsonData = tides.map((t) => t.toJson()).toList();
    await prefs.setString('cached_tides', jsonEncode(jsonData));
  }

  Future<List<DailyTide>> loadCachedTides() async {
    final prefs = await SharedPreferences.getInstance();
    final jsonString = prefs.getString('cached_tides');
    if (jsonString == null) return [];

    final jsonData = jsonDecode(jsonString) as List;
    return jsonData.map((json) => DailyTide.fromJson(json)).toList();
  }
}
常见问题解答
1. 如何获取真实的潮汐数据?
问题:模拟数据不够准确,如何获取真实潮汐数据?
解答 :
可以接入专业的潮汐数据API:
dart
import 'package:http/http.dart' as http;
import 'dart:convert';

class TideApiService {
  // 使用国家海洋局API(示例)
  static const String apiUrl = 'https://api.ocean.gov.cn/tide';
  static const String apiKey = 'YOUR_API_KEY';

  Future<List<TideData>> fetchRealTideData({
    required String cityCode,
    required DateTime date,
  }) async {
    try {
      final response = await http.get(
        Uri.parse('$apiUrl/query')
            .replace(queryParameters: {
          'city': cityCode,
          'date': date.toIso8601String(),
          'key': apiKey,
        }),
      );

      if (response.statusCode == 200) {
        final data = jsonDecode(response.body);
        return _parseTideData(data);
      } else {
        throw Exception('API请求失败: ${response.statusCode}');
      }
    } catch (e) {
      print('获取潮汐数据失败: $e');
      return [];
    }
  }

  List<TideData> _parseTideData(Map<String, dynamic> data) {
    final tides = <TideData>[];
    for (var item in data['tides']) {
      tides.add(TideData(
        time: DateTime.parse(item['time']),
        type: item['type'],
        height: (item['height'] as num).toDouble(),
        level: item['level'],
      ));
    }
    return tides;
  }
}可用的潮汐数据源:
- 国家海洋局潮汐预报
- NOAA潮汐数据(美国)
- 各地海洋气象台
- 商业潮汐数据服务
2. 如何计算潮汐预测?
问题:如何自己计算潮汐预测而不依赖API?
解答 :
潮汐预测基于天文算法,主要考虑月球和太阳的引潮力:
dart
class TideCalculator {
  // 简化的潮汐计算(实际算法更复杂)
  static double calculateTideHeight({
    required DateTime time,
    required double latitude,
    required double longitude,
  }) {
    // 1. 计算月球位置
    final moonPhase = _calculateMoonPhase(time);

    // 2. 计算太阳位置
    final sunPosition = _calculateSunPosition(time);

    // 3. 计算引潮力
    final lunarForce = _calculateLunarForce(moonPhase, latitude);
    final solarForce = _calculateSolarForce(sunPosition, latitude);

    // 4. 合成潮汐高度
    final baseHeight = 2.5;  // 基准潮高
    final tideHeight = baseHeight + lunarForce + solarForce;

    return tideHeight;
  }

  static double _calculateMoonPhase(DateTime time) {
    // 月相周期约29.53天
    final daysSinceNewMoon = time.difference(DateTime(2000, 1, 6)).inDays % 29.53;
    return daysSinceNewMoon / 29.53 * 2 * pi;
  }

  static double _calculateLunarForce(double moonPhase, double latitude) {
    // 月球引潮力(简化)
    return 1.5 * cos(moonPhase) * cos(latitude * pi / 180);
  }

  static double _calculateSunPosition(DateTime time) {
    // 太阳位置(简化)
    final dayOfYear = time.difference(DateTime(time.year, 1, 1)).inDays;
    return dayOfYear / 365.25 * 2 * pi;
  }

  static double _calculateSolarForce(double sunPosition, double latitude) {
    // 太阳引潮力(简化)
    return 0.5 * cos(sunPosition) * cos(latitude * pi / 180);
  }
}注意:
- 实际潮汐计算非常复杂
- 需要考虑地形、海底地形等因素
- 建议使用专业的潮汐预测库
- 或接入专业的潮汐数据API
3. 如何优化潮汐曲线的绘制性能?
问题:当数据点很多时,曲线绘制卡顿怎么办?
解答 :
可以采用以下优化策略:
dart
class OptimizedTideChartPainter extends CustomPainter {
  final List<TideData> tides;
  Path? _cachedPath;  // 缓存路径

  OptimizedTideChartPainter(this.tides);

  @override
  void paint(Canvas canvas, Size size) {
    // 1. 使用缓存路径
    if (_cachedPath == null) {
      _cachedPath = _createPath(size);
    }

    // 2. 使用抗锯齿
    final paint = Paint()
      ..style = PaintingStyle.stroke
      ..strokeWidth = 2
      ..isAntiAlias = true
      ..color = Colors.blue;

    canvas.drawPath(_cachedPath!, paint);

    // 3. 只绘制可见区域的点
    _drawVisiblePoints(canvas, size);
  }

  Path _createPath(Size size) {
    final path = Path();

    // 数据点采样(如果点太多)
    final sampledTides = _sampleData(tides, 50);

    for (int i = 0; i < sampledTides.length; i++) {
      final x = _calculateX(i, sampledTides.length, size.width);
      final y = _calculateY(sampledTides[i].height, size.height);

      if (i == 0) {
        path.moveTo(x, y);
      } else {
        path.lineTo(x, y);
      }
    }

    return path;
  }

  List<TideData> _sampleData(List<TideData> data, int maxPoints) {
    if (data.length <= maxPoints) return data;

    final step = data.length / maxPoints;
    final sampled = <TideData>[];

    for (int i = 0; i < maxPoints; i++) {
      sampled.add(data[(i * step).floor()]);
    }

    return sampled;
  }

  void _drawVisiblePoints(Canvas canvas, Size size) {
    // 只绘制关键点(高潮和低潮)
    for (var tide in tides) {
      final x = _calculateX(tides.indexOf(tide), tides.length, size.width);
      final y = _calculateY(tide.height, size.height);

      canvas.drawCircle(
        Offset(x, y),
        4,
        Paint()..color = tide.typeColor,
      );
    }
  }

  @override
  bool shouldRepaint(OptimizedTideChartPainter oldDelegate) {
    return tides != oldDelegate.tides;
  }

  double _calculateX(int index, int total, double width) {
    return (width / (total - 1)) * index;
  }

  double _calculateY(double height, double canvasHeight) {
    final maxHeight = tides.map((t) => t.height).reduce((a, b) => a > b ? a : b);
    final minHeight = tides.map((t) => t.height).reduce((a, b) => a < b ? a : b);
    final range = maxHeight - minHeight;
    return canvasHeight - ((height - minHeight) / range) * canvasHeight;
  }
}优化技巧:
- 缓存绘制路径
- 数据点采样
- 只绘制可见区域
- 使用shouldRepaint优化重绘
- 启用抗锯齿
4. 如何实现潮汐动画效果?
问题:想让潮汐曲线有动画效果,如何实现?
解答 :
使用AnimationController实现动画:
dart
class AnimatedTideChart extends StatefulWidget {
  final List<TideData> tides;

  const AnimatedTideChart({super.key, required this.tides});

  @override
  State<AnimatedTideChart> createState() => _AnimatedTideChartState();
}

class _AnimatedTideChartState extends State<AnimatedTideChart>
    with SingleTickerProviderStateMixin {
  late AnimationController _controller;
  late Animation<double> _animation;

  @override
  void initState() {
    super.initState();
    _controller = AnimationController(
      duration: const Duration(seconds: 2),
      vsync: this,
    );
    _animation = Tween<double>(begin: 0, end: 1).animate(
      CurvedAnimation(parent: _controller, curve: Curves.easeInOut),
    );
    _controller.forward();
  }

  @override
  void dispose() {
    _controller.dispose();
    super.dispose();
  }

  @override
  Widget build(BuildContext context) {
    return AnimatedBuilder(
      animation: _animation,
      builder: (context, child) {
        return CustomPaint(
          painter: AnimatedTideChartPainter(
            widget.tides,
            _animation.value,
          ),
        );
      },
    );
  }
}

class AnimatedTideChartPainter extends CustomPainter {
  final List<TideData> tides;
  final double progress;

  AnimatedTideChartPainter(this.tides, this.progress);

  @override
  void paint(Canvas canvas, Size size) {
    final paint = Paint()
      ..style = PaintingStyle.stroke
      ..strokeWidth = 3
      ..color = Colors.blue;

    final path = Path();
    final visiblePoints = (tides.length * progress).floor();

    for (int i = 0; i < visiblePoints; i++) {
      final x = (size.width / (tides.length - 1)) * i;
      final y = _calculateY(tides[i].height, size.height);

      if (i == 0) {
        path.moveTo(x, y);
      } else {
        path.lineTo(x, y);
      }
    }

    canvas.drawPath(path, paint);
  }

  double _calculateY(double height, double canvasHeight) {
    final maxHeight = tides.map((t) => t.height).reduce((a, b) => a > b ? a : b);
    final minHeight = tides.map((t) => t.height).reduce((a, b) => a < b ? a : b);
    final range = maxHeight - minHeight;
    return canvasHeight - ((height - minHeight) / range) * canvasHeight;
  }

  @override
  bool shouldRepaint(AnimatedTideChartPainter oldDelegate) {
    return progress != oldDelegate.progress;
  }
}动画效果:
- 曲线逐渐绘制
- 数据点依次出现
- 平滑的过渡效果
5. 如何导出潮汐数据?
问题:如何将潮汐数据导出为PDF或Excel?
解答 :
使用pdf和excel插件导出数据:
dart
import 'package:pdf/pdf.dart';
import 'package:pdf/widgets.dart' as pw;
import 'package:excel/excel.dart';

class TideExportService {
  // 导出为PDF
  Future<void> exportToPdf(List<DailyTide> tides, String cityName) async {
    final pdf = pw.Document();

    pdf.addPage(
      pw.Page(
        build: (context) => pw.Column(
          crossAxisAlignment: pw.CrossAxisAlignment.start,
          children: [
            pw.Text(
              '$cityName 潮汐预报',
              style: pw.TextStyle(fontSize: 24, fontWeight: pw.FontWeight.bold),
            ),
            pw.SizedBox(height: 20),
            ...tides.map((dailyTide) => _buildPdfDaySection(dailyTide)),
          ],
        ),
      ),
    );

    final output = await getApplicationDocumentsDirectory();
    final file = File('${output.path}/tide_report.pdf');
    await file.writeAsBytes(await pdf.save());
  }

  pw.Widget _buildPdfDaySection(DailyTide dailyTide) {
    return pw.Column(
      crossAxisAlignment: pw.CrossAxisAlignment.start,
      children: [
        pw.Text(
          dailyTide.dateText,
          style: pw.TextStyle(fontSize: 18, fontWeight: pw.FontWeight.bold),
        ),
        pw.SizedBox(height: 10),
        pw.Table(
          border: pw.TableBorder.all(),
          children: [
            pw.TableRow(children: [
              pw.Text('时间'),
              pw.Text('类型'),
              pw.Text('潮高'),
              pw.Text('等级'),
            ]),
            ...dailyTide.tides.map((tide) => pw.TableRow(children: [
              pw.Text('${tide.time.hour}:${tide.time.minute}'),
              pw.Text(tide.typeText),
              pw.Text('${tide.height.toStringAsFixed(2)}m'),
              pw.Text(tide.levelText),
            ])),
          ],
        ),
        pw.SizedBox(height: 20),
      ],
    );
  }

  // 导出为Excel
  Future<void> exportToExcel(List<DailyTide> tides, String cityName) async {
    final excel = Excel.createExcel();
    final sheet = excel['潮汐数据'];

    // 表头
    sheet.appendRow([
      '日期',
      '时间',
      '类型',
      '潮高(m)',
      '等级',
      '月相',
    ]);

    // 数据行
    for (var dailyTide in tides) {
      for (var tide in dailyTide.tides) {
        sheet.appendRow([
          dailyTide.dateText,
          '${tide.time.hour}:${tide.time.minute}',
          tide.typeText,
          tide.height.toStringAsFixed(2),
          tide.levelText,
          dailyTide.moonPhaseText,
        ]);
      }
    }

    final output = await getApplicationDocumentsDirectory();
    final file = File('${output.path}/tide_data.xlsx');
    await file.writeAsBytes(excel.encode()!);
  }
}导出格式:
- PDF:适合打印和分享
- Excel:适合数据分析
- CSV:通用格式
- JSON:程序间交换
项目总结
核心功能流程
选择天数
刷新
查看详情
启动应用
选择城市
生成潮汐数据
显示潮汐列表
用户操作
更新查询范围
重新生成数据
显示详情页
显示潮汐曲线
显示月相信息
显示知识科普
数据流转
数据层 状态管理 界面 用户 数据层 状态管理 界面 用户 选择城市 更新选中城市 生成潮汐数据 返回潮汐列表 更新界面 显示潮汐 选择查询天数 更新天数参数 重新生成数据 返回新数据 更新列表 显示新数据 点击日期 获取详细信息 查询潮汐详情 返回详情数据 显示详情页 展示曲线和信息
技术架构
Flutter应用
UI层
业务逻辑层
数据层
主页面
详情页
城市选择
潮汐曲线
状态管理
数据生成
时间计算
月相计算
数据模型
数据缓存
API接口
项目特色
- 多城市支持:覆盖10个沿海城市,数据独立管理
- 精确预测:精确到分钟的潮汐时间预测
- 可视化展示:自定义Canvas绘制潮汐曲线
- 月相关联:显示月相对潮汐的影响
- 等级分类:5个等级清晰标识潮汐大小
- 知识科普:集成潮汐相关知识介绍
- 用户体验:Material Design 3设计,交互流畅
- 数据详实:提供潮高、潮差等详细数据
学习收获
通过本项目,你将掌握:
- Flutter基础:Widget组合、状态管理、导航路由
- 自定义绘制:CustomPainter、Canvas、Path使用
- 数据可视化:图表绘制、坐标转换、曲线平滑
- 时间处理:DateTime操作、时间计算、格式化
- 数学计算:三角函数、坐标映射、数据插值
- UI设计:卡片布局、颜色搭配、视觉层次
- 代码组织:模型设计、方法封装、代码复用
性能优化建议
- 列表优化:使用ListView.builder实现懒加载
- 绘制优化:缓存Path、数据采样、shouldRepaint
- 状态管理:合理使用setState,避免不必要的重建
- 数据缓存:缓存计算结果,避免重复计算
- 异步操作:使用Future和async/await处理耗时操作
- 内存管理:及时释放不用的资源和监听器
后续优化方向
- 真实数据:接入潮汐数据API,获取准确预测
- 地图显示:集成地图SDK,可视化潮汐站点
- 预警功能:根据潮汐高度发送预警通知
- 钓鱼推荐:根据潮汐推荐最佳钓鱼时间
- 历史对比:对比不同日期的潮汐数据
- 潮汐日历:以日历形式展示整月潮汐
- 数据统计:统计分析潮汐规律
- 离线功能:支持离线查看缓存数据
本项目提供了一个完整的潮汐查询应用框架,你可以在此基础上继续扩展功能,打造更加专业的海洋气象应用。
欢迎加入开源鸿蒙跨平台社区:https://openharmonycrossplatform.csdn.net