文章目录
- windows:ELK搭建(单机)
- 一、下载
- 二、安装
-
- 1.elasticsearch安装
-
- 1.改配置
- 2.生成证书
- 3.启动
- 4.重置elastic密码
- 5.验证是否成功运行
- 6.注册为系统服务,开机自启动
- [7.设置 kibana_system 用户密码](#7.设置 kibana_system 用户密码)
- 2.kibana安装
- 3.Logstash安装
- 4.filebeat安装(可选)
- 5.项目集成
windows:ELK搭建(单机)
一、下载
elasticsearch下载地址:https://www.elastic.co/cn/downloads/elasticsearch
kibana|logstash|filebeat下载地址:https://www.elastic.co/cn/downloads/past-releases#elasticsearch
elasticsearch-analysis-ik分词器插件下载地址:https://release.infinilabs.com/
需下载清单(注意版本号要统一)

二、安装
1.elasticsearch安装
1.改配置
配置环境变量:ES_JAVA_HOME 为 D:\ELK\elasticsearch-9.2.4\jdk
修改文件:config/elasticsearch.yml(可直接复制以下进行粘贴)
yaml
# ======================== Elasticsearch Configuration =========================
#
# NOTE: Elasticsearch comes with reasonable defaults for most settings.
#       Before you set out to tweak and tune the configuration, make sure you
#       understand what are you trying to accomplish and the consequences.
#
# The primary way of configuring a node is via this file. This template lists
# the most important settings you may want to configure for a production cluster.
#
# Please consult the documentation for further information on configuration options:
# https://www.elastic.co/guide/en/elasticsearch/reference/index.html
#
# ---------------------------------- Cluster -----------------------------------
#
# Use a descriptive name for your cluster:
#
cluster.name: my-elastic
#
# ------------------------------------ Node ------------------------------------
#
# Use a descriptive name for the node:
#
node.name: node-1
#
# Add custom attributes to the node:
#
#node.attr.rack: r1
#
# ----------------------------------- Paths ------------------------------------
#
# Path to directory where to store the data (separate multiple locations by comma):
#
path.data: D:\environment\ELK\elasticsearch-9.2.4\data
#
# Path to log files:
#
path.logs: D:\environment\ELK\elasticsearch-9.2.4\logs
#
# ----------------------------------- Memory -----------------------------------
#
# Lock the memory on startup:
#
#bootstrap.memory_lock: true
#
# Make sure that the heap size is set to about half the memory available
# on the system and that the owner of the process is allowed to use this
# limit.
#
# Elasticsearch performs poorly when the system is swapping the memory.
#
# ---------------------------------- Network -----------------------------------
#
# By default Elasticsearch is only accessible on localhost. Set a different
# address here to expose this node on the network:
#
network.host: 0.0.0.0
#
# By default Elasticsearch listens for HTTP traffic on the first free port it
# finds starting at 9200. Set a specific HTTP port here:
#
http.port: 9200
#
# For more information, consult the network module documentation.
#
# --------------------------------- Discovery ----------------------------------
#
# Pass an initial list of hosts to perform discovery when this node is started:
# The default list of hosts is ["127.0.0.1", "[::1]"]
#
# discovery.seed_hosts: ["127.0.0.1"]
# 单节点
discovery.type: single-node
#
# Bootstrap the cluster using an initial set of master-eligible nodes:
#
# cluster.initial_master_nodes: ["node-1"]
#
# For more information, consult the discovery and cluster formation module documentation.
#
# ---------------------------------- Various -----------------------------------
#
# Allow wildcard deletion of indices:
#
#action.destructive_requires_name: false

# Enable security features
# 启用传输层SSL
xpack.security.transport.ssl.enabled: true

# 生成证书(开发环境可以自签名)
xpack.security.transport.ssl.verification_mode: certificate
xpack.security.transport.ssl.keystore.path: certs/elastic-certificates.p12
xpack.security.transport.ssl.truststore.path: certs/elastic-certificates.p12
#----------------------- END SECURITY AUTO CONFIGURATION -------------------------
2.生成证书
bash
cd D:\ELK\elasticsearch-9.2.4
# 先创建CA证书
bin\elasticsearch-certutil ca
# 用CA证书生成节点证书
bin\elasticsearch-certutil cert --ca elastic-stack-ca.p12 -out config\certs\elastic-certificates.p12 -pass ""
3.启动
bash
# 在bin目录下打开cmd执行
elasticsearch.bat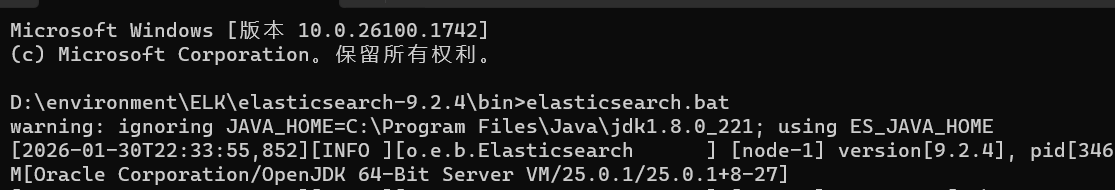
4.重置elastic密码
bash
bin\elasticsearch-reset-password -u elastic -i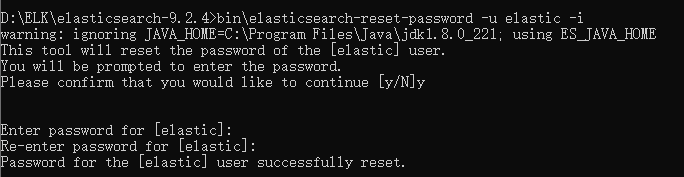
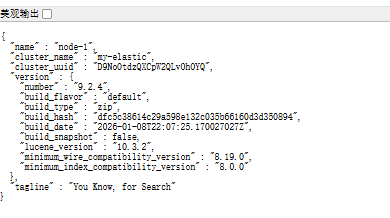
5.验证是否成功运行
1.访问http://localhost:9200
账户:elastic
密码:刚才重置输入的密码
2.检查健康状态
bash
# 只指定用户名,curl会提示你输入密码
curl -u elastic -X GET "http://localhost:9200/_cluster/health"
6.注册为系统服务,开机自启动
bash
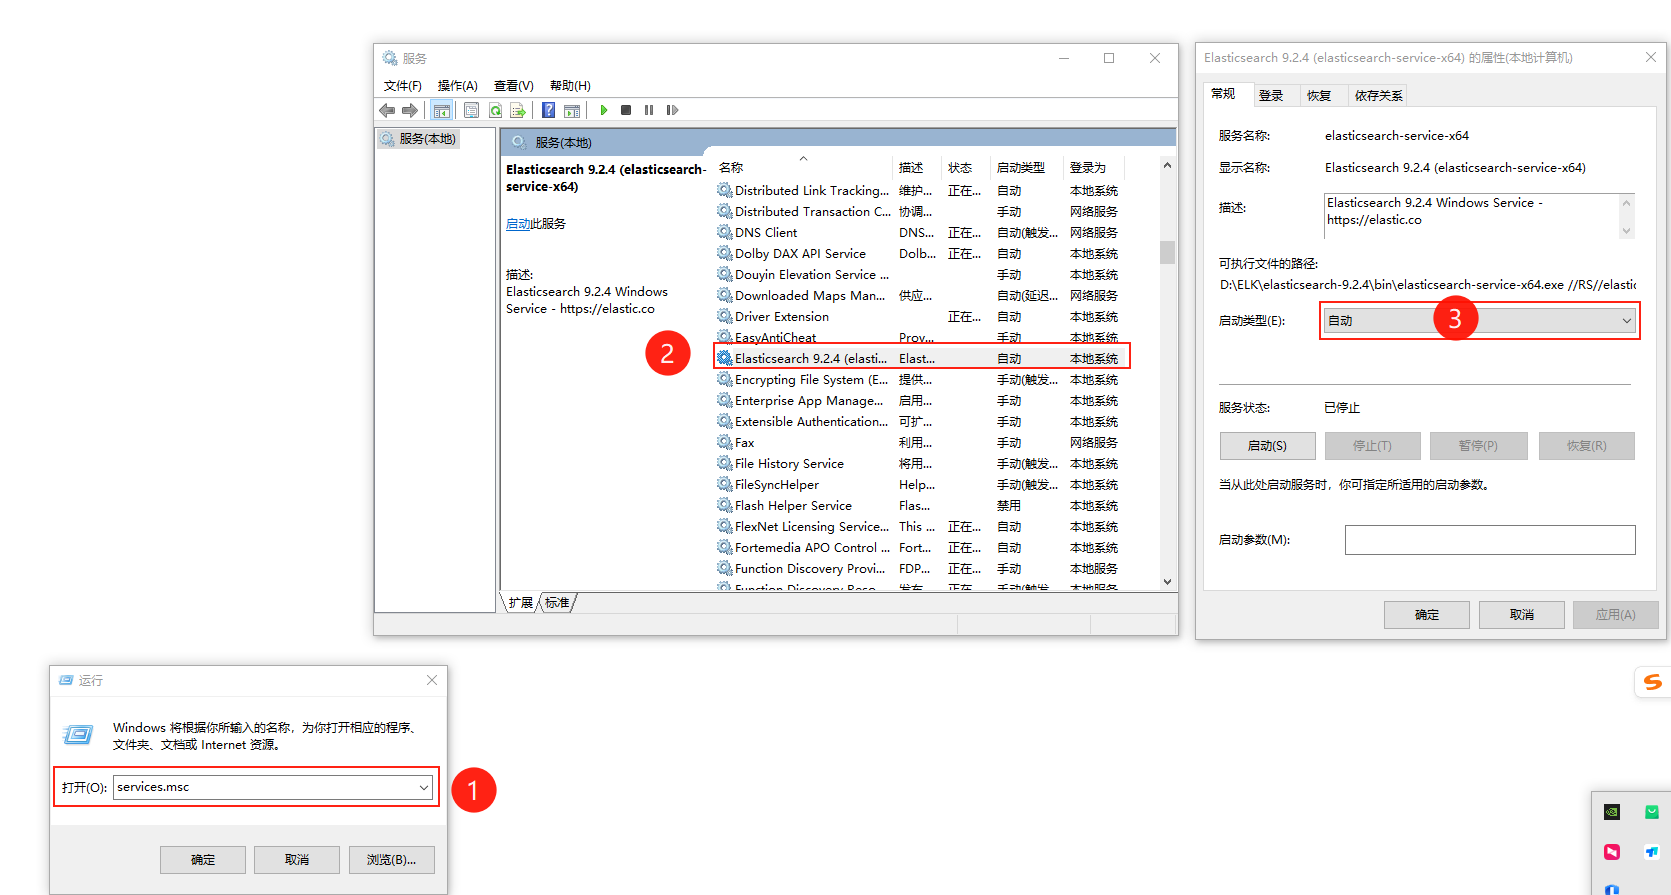
elasticsearch-service.bat install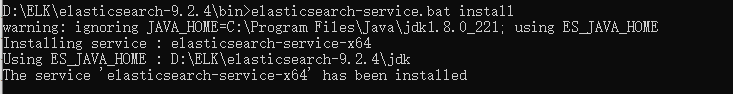
win+R,输入:services.msc,确定
7.设置 kibana_system 用户密码
bash
# 重置所有用户密码,记下密码
elasticsearch-reset-password -u kibana_system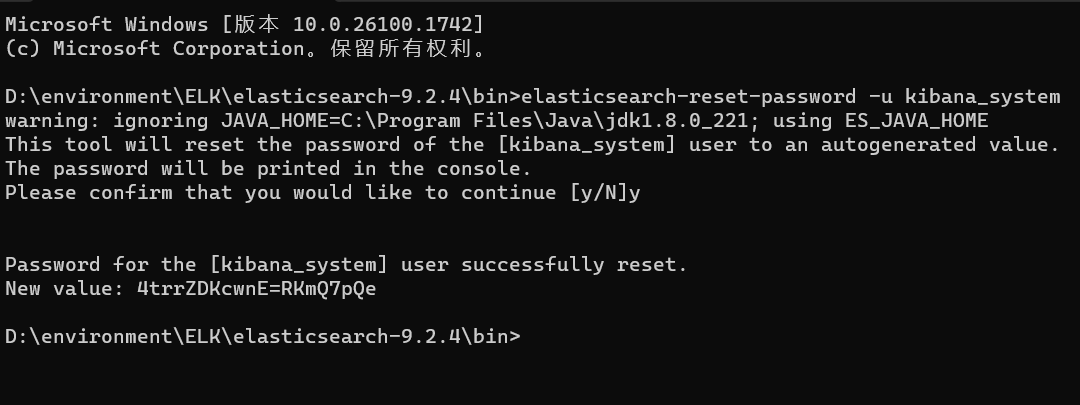
2.kibana安装
1.修改配置文件
修改config/kibana.yml
bash
# For more configuration options see the configuration guide for Kibana in
# https://www.elastic.co/guide/index.html

# =================== System: Kibana Server ===================
# Kibana is served by a back end server. This setting specifies the port to use.
server.port: 5601

# Specifies the address to which the Kibana server will bind. IP addresses and host names are both valid values.
# The default is 'localhost', which usually means remote machines will not be able to connect.
# To allow connections from remote users, set this parameter to a non-loopback address.
server.host: "localhost"

# Enables you to specify a path to mount Kibana at if you are running behind a proxy.
# Use the `server.rewriteBasePath` setting to tell Kibana if it should remove the basePath
# from requests it receives, and to prevent a deprecation warning at startup.
# This setting cannot end in a slash.
#server.basePath: ""

# Specifies whether Kibana should rewrite requests that are prefixed with
# `server.basePath` or require that they are rewritten by your reverse proxy.
# Defaults to `false`.
#server.rewriteBasePath: false

# Specifies the public URL at which Kibana is available for end users. If
# `server.basePath` is configured this URL should end with the same basePath.
#server.publicBaseUrl: ""

# The maximum payload size in bytes for incoming server requests.
#server.maxPayload: 1048576

# The Kibana server's name. This is used for display purposes.
#server.name: "your-hostname"

# =================== System: Kibana Server (Optional) ===================
# Enables SSL and paths to the PEM-format SSL certificate and SSL key files, respectively.
# These settings enable SSL for outgoing requests from the Kibana server to the browser.
#server.ssl.enabled: false
#server.ssl.certificate: /path/to/your/server.crt
#server.ssl.key: /path/to/your/server.key

# =================== System: Elasticsearch ===================
# The URLs of the Elasticsearch instances to use for all your queries.
elasticsearch.hosts: ["http://localhost:9200"]

# If your Elasticsearch is protected with basic authentication, these settings provide
# the username and password that the Kibana server uses to perform maintenance on the Kibana
# index at startup. Your Kibana users still need to authenticate with Elasticsearch, which
# is proxied through the Kibana server.
elasticsearch.username: "kibana_system"
elasticsearch.password: "4trrZDKcwnE=RKmQ7pQe"

# Kibana can also authenticate to Elasticsearch via "service account tokens".
# Service account tokens are Bearer style tokens that replace the traditional username/password based configuration.
# Use this token instead of a username/password.
# elasticsearch.serviceAccountToken: "my_token"

# Time in milliseconds to wait for Elasticsearch to respond to pings. Defaults to the value of
# the elasticsearch.requestTimeout setting.
#elasticsearch.pingTimeout: 1500

# Time in milliseconds to wait for responses from the back end or Elasticsearch. This value
# must be a positive integer.
#elasticsearch.requestTimeout: 30000

# The maximum number of sockets that can be used for communications with elasticsearch.
# Defaults to `800`.
#elasticsearch.maxSockets: 1024

# Specifies whether Kibana should use compression for communications with elasticsearch
# Defaults to `false`.
#elasticsearch.compression: false

# List of Kibana client-side headers to send to Elasticsearch. To send *no* client-side
# headers, set this value to [] (an empty list).
#elasticsearch.requestHeadersWhitelist: [ authorization ]

# Header names and values that are sent to Elasticsearch. Any custom headers cannot be overwritten
# by client-side headers, regardless of the elasticsearch.requestHeadersWhitelist configuration.
#elasticsearch.customHeaders: {}

# Time in milliseconds for Elasticsearch to wait for responses from shards. Set to 0 to disable.
#elasticsearch.shardTimeout: 30000

# =================== System: Elasticsearch (Optional) ===================
# These files are used to verify the identity of Kibana to Elasticsearch and are required when
# xpack.security.http.ssl.client_authentication in Elasticsearch is set to required.
#elasticsearch.ssl.certificate: /path/to/your/client.crt
#elasticsearch.ssl.key: /path/to/your/client.key

# Enables you to specify a path to the PEM file for the certificate
# authority for your Elasticsearch instance.
elasticsearch.ssl.certificateAuthorities: ["D:/environment/ELK/elasticsearch-9.2.4/config/certs/elastic-certificates.p12"]

# To disregard the validity of SSL certificates, change this setting's value to 'none'.
elasticsearch.ssl.verificationMode: certificate

# =================== System: Logging ===================
# Set the value of this setting to off to suppress all logging output, or to debug to log everything. Defaults to 'info'
logging.root.level: debug

# Enables you to specify a file where Kibana stores log output.
#logging.appenders.default:
#  type: file
#  fileName: /var/logs/kibana.log
#  layout:
#    type: json

# Example with size based log rotation
#logging.appenders.default:
#  type: rolling-file
#  fileName: /var/logs/kibana.log
#  policy:
#    type: size-limit
#    size: 256mb
#  strategy:
#    type: numeric
#    max: 10
#  layout:
#    type: json

# Logs queries sent to Elasticsearch.
#logging.loggers:
#  - name: elasticsearch.query
#    level: debug

# Logs http responses.
#logging.loggers:
#  - name: http.server.response
#    level: debug

# Logs system usage information.
#logging.loggers:
#  - name: metrics.ops
#    level: debug

# Enables debug logging on the browser (dev console)
#logging.browser.root:
#  level: debug

# =================== System: Other ===================
# The path where Kibana stores persistent data not saved in Elasticsearch. Defaults to data
#path.data: data

# Specifies the path where Kibana creates the process ID file.
#pid.file: /run/kibana/kibana.pid

# Set the interval in milliseconds to sample system and process performance
# metrics. Minimum is 100ms. Defaults to 5000ms.
#ops.interval: 5000

# Specifies locale to be used for all localizable strings, dates and number formats.
# Supported languages are the following: English (default) "en", Chinese "zh-CN", Japanese "ja-JP", French "fr-FR", German "de-DE".
#i18n.locale: "en"
i18n.locale: "zh-CN"

# =================== Frequently used (Optional)===================

# =================== Saved Objects: Migrations ===================
# Saved object migrations run at startup. If you run into migration-related issues, you might need to adjust these settings.

# The number of documents migrated at a time.
# If Kibana can't start up or upgrade due to an Elasticsearch `circuit_breaking_exception`,
# use a smaller batchSize value to reduce the memory pressure. Defaults to 1000 objects per batch.
#migrations.batchSize: 1000

# The maximum payload size for indexing batches of upgraded saved objects.
# To avoid migrations failing due to a 413 Request Entity Too Large response from Elasticsearch.
# This value should be lower than or equal to your Elasticsearch cluster's `http.max_content_length`
# configuration option. Default: 100mb
#migrations.maxBatchSizeBytes: 100mb

# The number of times to retry temporary migration failures. Increase the setting
# if migrations fail frequently with a message such as `Unable to complete the [...] step after
# 15 attempts, terminating`. Defaults to 15
#migrations.retryAttempts: 15

# =================== Search Autocomplete ===================
# Time in milliseconds to wait for autocomplete suggestions from Elasticsearch.
# This value must be a whole number greater than zero. Defaults to 1000ms
#unifiedSearch.autocomplete.valueSuggestions.timeout: 1000

# Maximum number of documents loaded by each shard to generate autocomplete suggestions.
# This value must be a whole number greater than zero. Defaults to 100_000
#unifiedSearch.autocomplete.valueSuggestions.terminateAfter: 100000
2.验证是否启动成功
账户/密码:elastic/123456
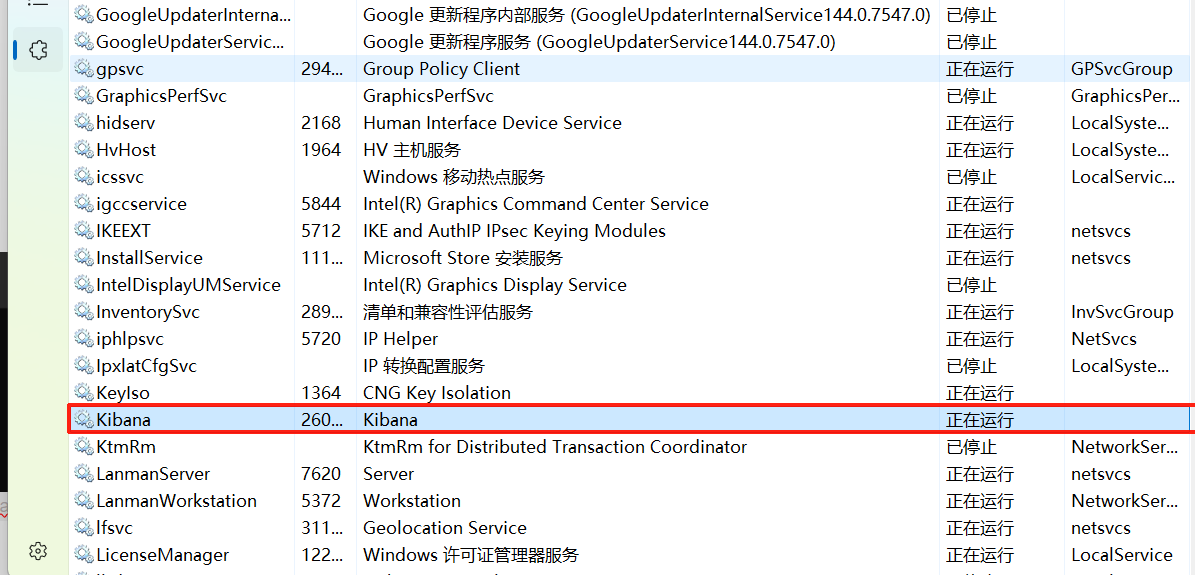
3.设置为开机自启动
1.下载NSSM
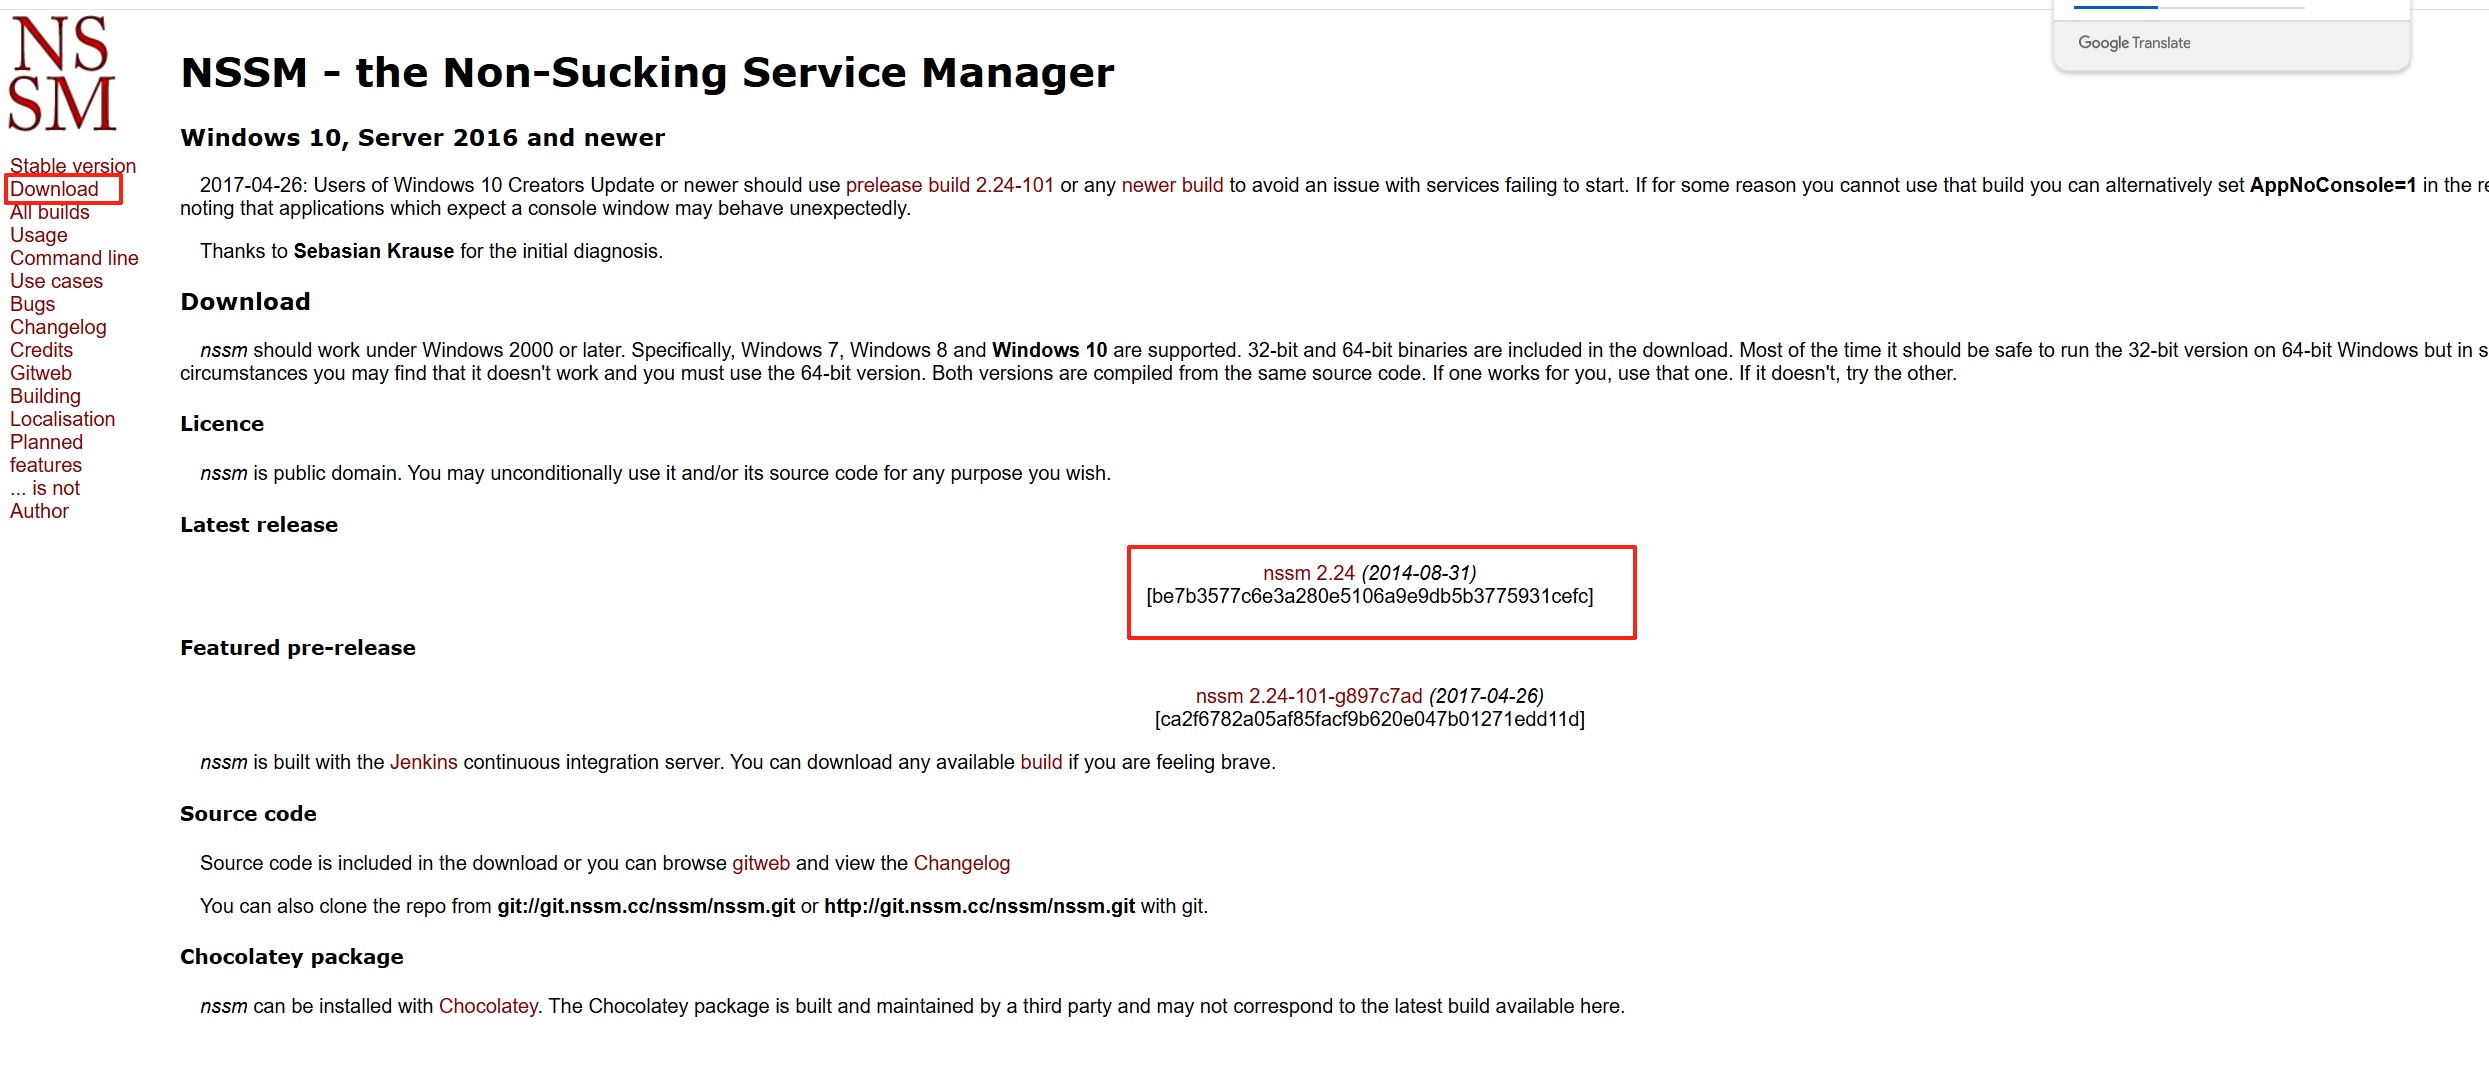
2.安装服务
解压,cmd进入:nssm-2.24\win64
bash
# 安装服务
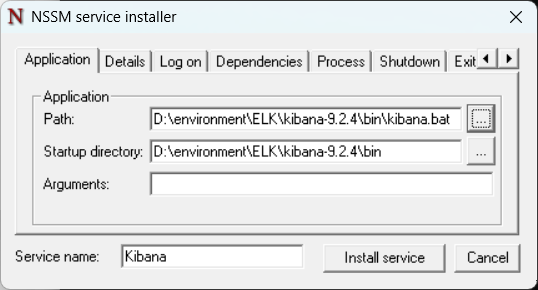
nssm install Kibana
# 在弹出的窗口中配置:
# Path: D:\environment\ELK\kibana-9.2.4\bin\kibana.bat
# Startup directory: D:\environment\ELK\kibana-9.2.4\bin
# Service name: Kibana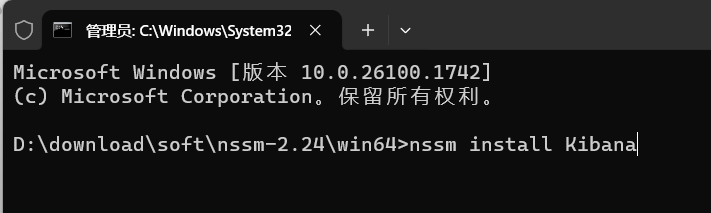
3.Logstash安装
1.修改配置
修改config/logstash-sample文件,也可复制一份修改
bash
input {
  tcp {
    port => 9250
    codec => json_lines
  }
}

output {
  elasticsearch {
    hosts => ["http://localhost:9200"]
    index => "java-app-%{+YYYY.MM.dd}"
    user => "elastic"
    password => "123456"
    # 完全不指定 SSL 相关参数,使用默认值
  }

  stdout {
    codec => rubydebug
  }
}
2.启动
bash
logstash.bat -f ./config/logstash.conf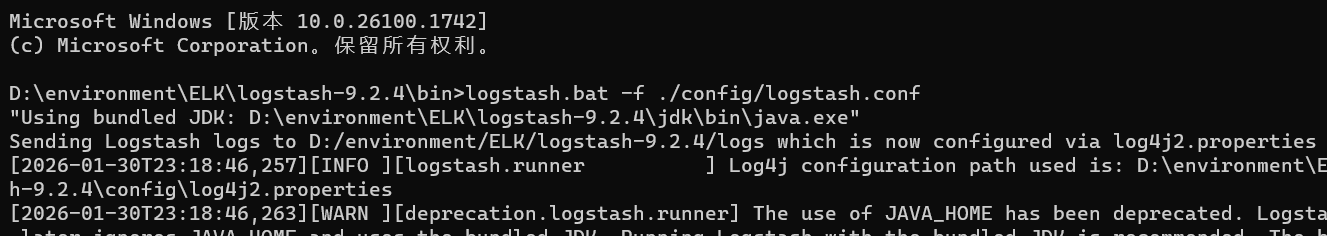
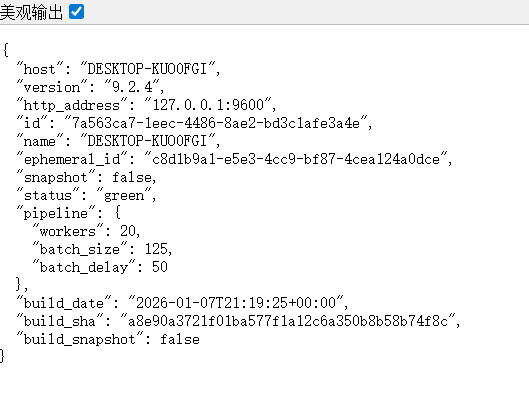
3.测试是否启动成功
4.注册服务,开机自启动
bash
nssm install Logstash

Path: D:\environment\ELK\logstash-9.2.4\bin\logstash.bat

Startup directory: D:\environment\ELK\logstash-9.2.4\bin

Arguments: -f D:\environment\ELK\logstash-9.2.4\config\logstash.conf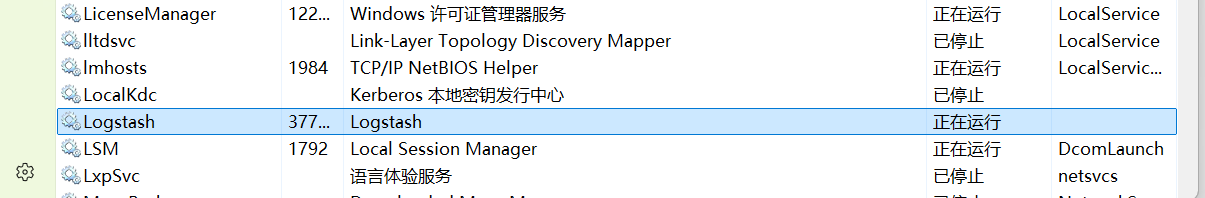
4.filebeat安装(可选)
1.修改filebeat.yml
bash
# Filebeat 配置文件 - Windows 版本
# 配置 Filebeat 收集 Windows 日志和应用程序日志

filebeat.inputs:
#- type: filestream
#  id: windows-system-logs
#  enabled: true
#  paths:
#    - C:/Windows/System32/winevt/Logs/Application.evtx  # Windows 应用程序事件日志
#    - C:/Windows/System32/winevt/Logs/System.evtx       # Windows 系统事件日志
#    - C:/Windows/System32/winevt/Logs/Security.evtx     # Windows 安全事件日志
#  fields:
#    os: windows
 #   log_type: windows_event

- type: filestream
  id: app-logs
  enabled: true
  paths:
    # 根据你的实际应用日志路径修改
    - D:\learn\wms_me\demo-server\build\testServer.log
  fields:
    app_name: "your-application"
    log_type: application

# 输出到 Logstash(推荐,因为你的 Logstash 已经配置了 TCP 输入)
output.logstash:
  hosts: ["localhost:5044"]  # 你的 Logstash TCP 端口

# 或者输出到 Elasticsearch(需要认证)
# output.elasticsearch:
#   hosts: ["localhost:9200"]
#   username: "elastic"
#   password: "123456"
#   ssl.enabled: false

# Kibana 仪表板配置
setup.kibana:
  host: "localhost:5601"

# 处理器配置
processors:
  - add_host_metadata:
      when.not.contains.tags: forwarded
  - add_fields:
      target: ''
      fields:
        environment: "development"
        collect_by: "filebeat"
2.启动
bash
filebeat.exe -e -c filebeat.yml3.注册为服务,开机自启
bash
Set-ExecutionPolicy -ExecutionPolicy Bypass -Scope Process

# 切换到你解压的 Filebeat 目录(请根据你的实际路径调整)
cd 'D:\environment\ELK\filebeat-9.2.4-windows-x86_64'

# 执行安装服务的命令
.\install-service-filebeat.ps1
4.修改logstash配置文件
bash
input {
  beats {
    port => 5044 # Beats 默认端口,可自定义
  }
}

output {
  elasticsearch {
    hosts => ["http://localhost:9200"]
    index => "java-app-%{+YYYY.MM.dd}"
    user => "elastic"
    password => "123456"
    # 完全不指定 SSL 相关参数,使用默认值
  }

  stdout {
    codec => rubydebug
  }
}
5.项目集成
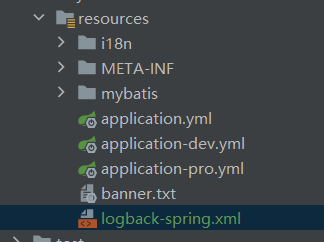
1.新建logback-spring.xml
在项目resources下新建logback-spring.xml,删除原理的logback.xml(如果有)
xml
<?xml version="1.0" encoding="UTF-8"?>
<!--该日志将日志级别不同的log信息保存到不同的文件中 -->
<configuration>
<property name="springAppName" value="testServer"/>
<property name="springAppId" value="127.0.0.1"/>
<include resource="org/springframework/boot/logging/logback/defaults.xml" />
<!-- 日志在工程中的输出位置 -->
<property name="LOG_FILE" value="${BUILD_FOLDER:-build}/${springAppName}" />
<!-- 控制台的日志输出样式 -->
<property name="CONSOLE_LOG_PATTERN"
value="%clr(%d{yyyy-MM-dd HH:mm:ss.SSS}){faint} %clr(${LOG_LEVEL_PATTERN:-%5p}) %clr(${PID:- }){magenta} %clr(---){faint} %clr([%15.15t]){faint} %m%n${LOG_EXCEPTION_CONVERSION_WORD:-%wEx}}" />
<!-- 为logstash输出的JSON格式的Appender -->
<appender name="logstash" class="net.logstash.logback.appender.LogstashTcpSocketAppender">
<destination>127.0.0.1:5044</destination>
<encoder charset="UTF-8" class="net.logstash.logback.encoder.LogstashEncoder" />
<encoder class="net.logstash.logback.encoder.LoggingEventCompositeJsonEncoder">
<providers>
<timestamp>
<timeZone>UTC</timeZone>
</timestamp>
<pattern>
<pattern>
{
"service": "${springAppName:-}",
"serviceId": "${springAppId:-}",
"thread": "%thread",
"level": "%level",
"createtime": "%date{\"yyyy-MM-dd HH:mm:ss.SSS\"}",
"message": "%message"
}
</pattern>
</pattern>
</providers>
</encoder>
</appender>
<appender name="consoleLog" class="ch.qos.logback.core.ConsoleAppender">
<encoder>
<pattern>%d{HH:mm:ss.SSS} %contextName [%thread] %-5level %logger{36} - %msg%n</pattern>
</encoder>
</appender>
<!-- 文件输出配置(修正版) -->
<appender name="FILE" class="ch.qos.logback.core.rolling.RollingFileAppender">
<!-- 日志文件路径和名称 -->
<file>${LOG_FILE}.log</file>
<!-- 修正:使用SizeAndTimeBasedRollingPolicy替代旧的配置 -->
<rollingPolicy class="ch.qos.logback.core.rolling.SizeAndTimeBasedRollingPolicy">
<!-- 注意:当按大小滚动时,必须包含%i作为索引 -->
<fileNamePattern>${LOG_FILE}.%d{yyyy-MM-dd}-%i.log</fileNamePattern>
<!-- 每个日志文件最大100MB -->
<maxFileSize>100MB</maxFileSize>
<!-- 保留30天的历史日志 -->
<maxHistory>30</maxHistory>
<!-- 总日志大小不超过3GB -->
<totalSizeCap>3GB</totalSizeCap>
<!-- 可选:清理时保留的最大文件数 -->
<cleanHistoryOnStart>false</cleanHistoryOnStart>
</rollingPolicy>
<!-- 日志格式 -->
<encoder>
<pattern>%d{yyyy-MM-dd HH:mm:ss.SSS} [%thread] %-5level %logger{36} - %msg%n</pattern>
</encoder>
</appender>
<!-- 日志输出级别 -->
<root level="info">
<!-- <appender-ref ref="logstash" />--><!--安装了filebeat需要注释掉logstash-->
<appender-ref ref="consoleLog" />
<appender-ref ref="FILE" />
</root>
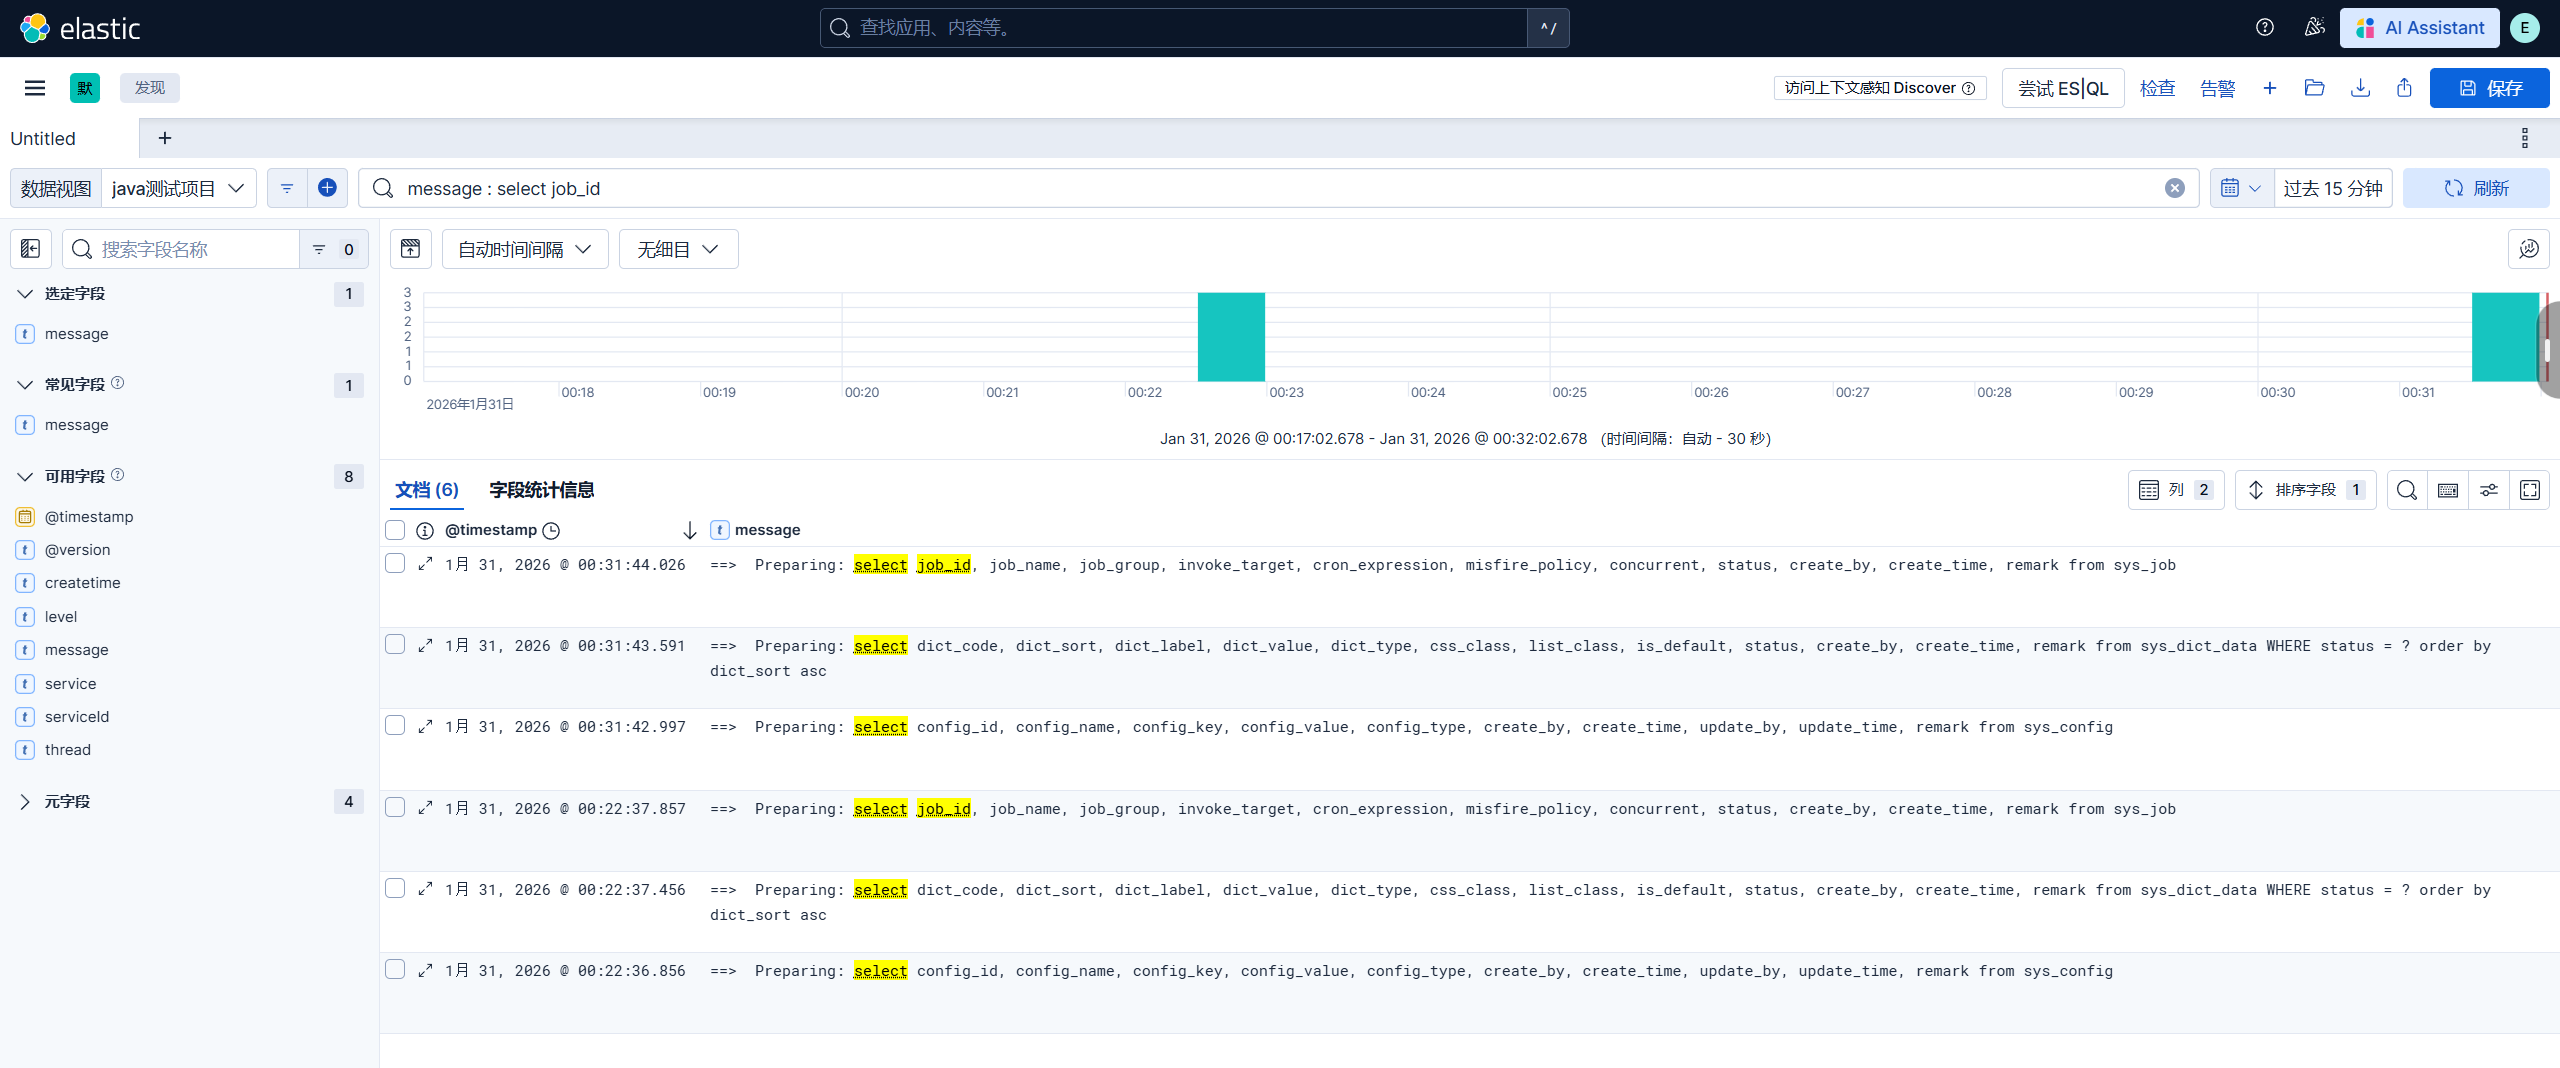
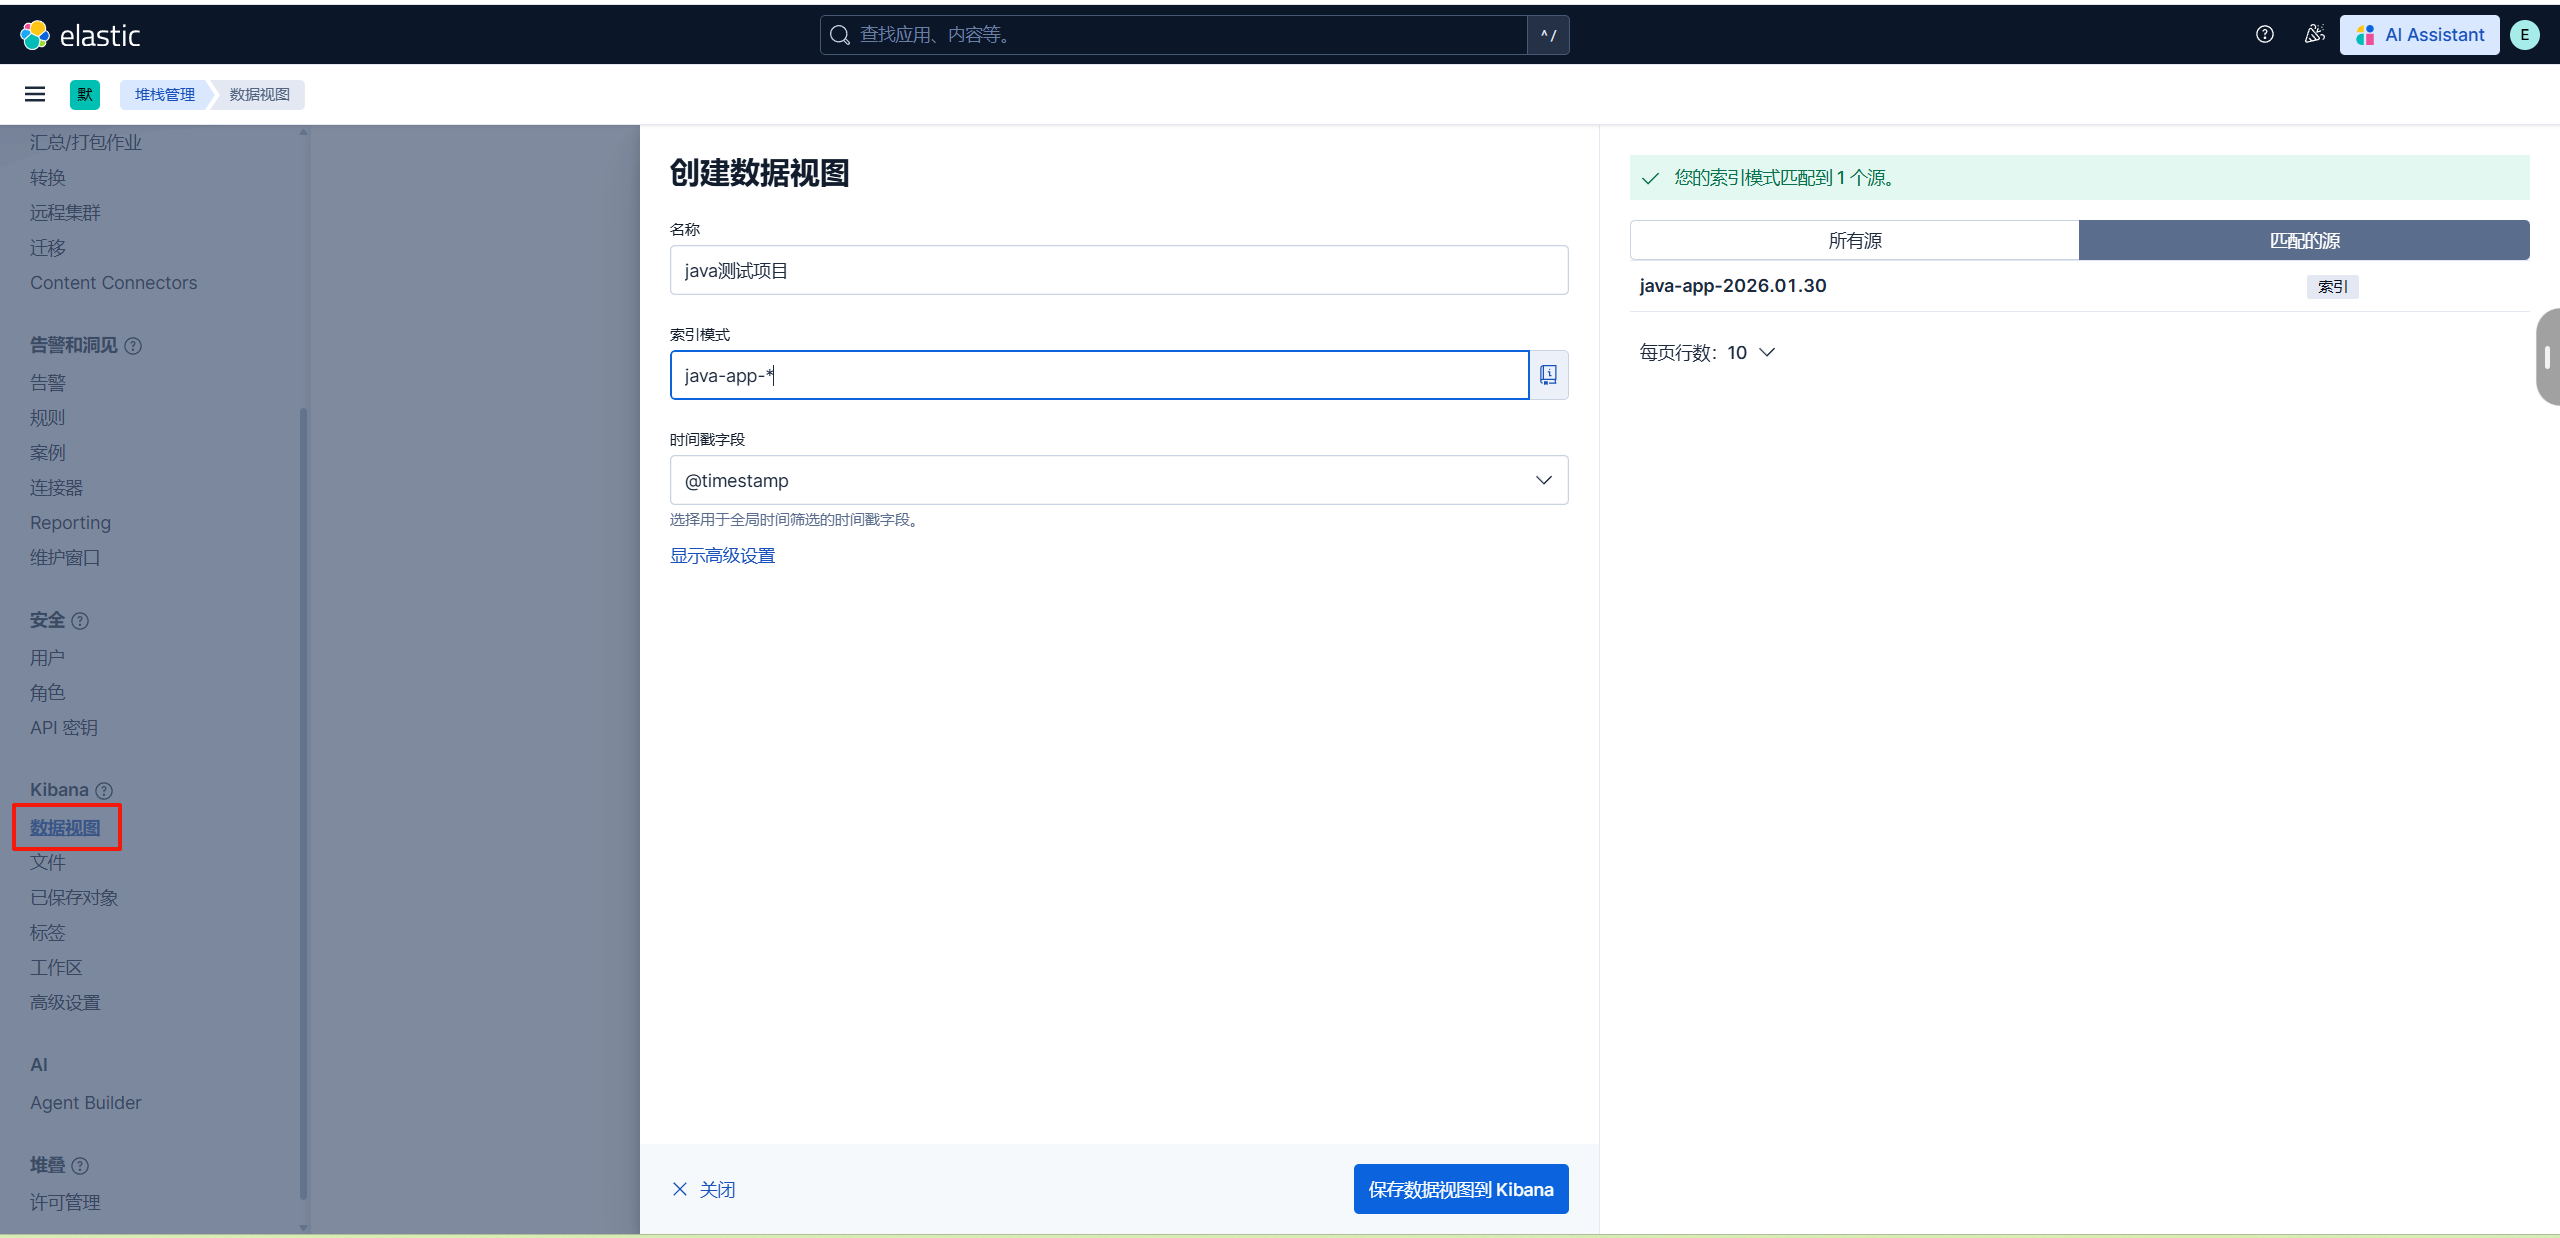
</configuration>2.创建数据视图
输出的索引名是logstash的配置文件的index => "java-app-%{+YYYY.MM.dd}"这句生成。
3.查看搜索日志