学习统计分析是帮助开发者了解自己学习进度和效果的重要工具,一个功能完善的统计分析系统能够提供数据驱动的学习建议。在我的教育产品设计经验中,发现可视化的学习数据能够显著提升用户的学习动力,因此设计了这个实用的学习统计分析系统。
页面结构设计
学习统计分析系统需要提供学习概览、详细统计和趋势分析等功能:
dart
class LearningStatsPage extends StatefulWidget {
  @override
  _LearningStatsPageState createState() => _LearningStatsPageState();
}StatefulWidget的选择基于统计分析的动态特性。数据加载、时间段切换和图表更新都需要状态管理,StatefulWidget能够很好地处理这些交互需求。
状态管理的核心变量:
dart
class _LearningStatsPageState extends State<LearningStatsPage> {
  LearningStats overallStats = LearningStats();
  List<DailyStats> dailyStats = [];
  List<CategoryStats> categoryStats = [];
  String selectedPeriod = '本周';
  bool isLoading = false;
状态变量的设计 包含总体统计、每日统计、分类统计和时间段选择。这种清晰的状态分离让页面逻辑更加易于维护。
数据模型设计
学习统计和分析的数据模型:
dart
class LearningStats {
  final int totalStudyDays;
  final Duration totalStudyTime;
  final int completedCourses;
  final int completedProblems;
  final int readArticles;
  final double averageScore;
  final int currentStreak;
  final int longestStreak;
}

class DailyStats {
  final DateTime date;
  final Duration studyTime;
  final int completedTasks;
  final double focusScore;
}

class CategoryStats {
  final String category;
  final Duration studyTime;
  final int completedItems;
  final double progress;
  final Color color;
}
数据模型的完整性 涵盖了学习统计的核心指标。currentStreak和longestStreak记录连续学习天数,focusScore评估学习质量。这种全面的数据结构为功能实现提供了坚实基础。
页面布局实现
页面采用滚动视图展示多个统计模块:
dart
@override
Widget build(BuildContext context) {
  return Scaffold(
    appBar: AppBar(
      title: const Text('学习统计'),
      backgroundColor: Theme.of(context).primaryColor,
      foregroundColor: Colors.white,
      actions: [
        IconButton(
          icon: const Icon(Icons.calendar_today),
          onPressed: _showPeriodSelector,
        ),
      ],
    ),
    body: isLoading
        ? Center(child: CircularProgressIndicator())
        : RefreshIndicator(
            onRefresh: _refreshStats,
            child: ListView(
              padding: EdgeInsets.all(16.w),
              children: [
                _buildOverviewCard(),
                SizedBox(height: 16.h),
                _buildStreakCard(),
                SizedBox(height: 16.h),
                _buildDailyChart(),
                SizedBox(height: 16.h),
                _buildCategoryStats(),
              ],
            ),
          ),
  );
}
页面布局的设计 使用ListView组织不同的统计模块。下拉刷新让用户能够获取最新数据,这种标准化的交互提升了用户体验。
概览卡片实现
学习概览卡片展示核心统计数据:
dart
Widget _buildOverviewCard() {
  return Card(
    elevation: 4,
    child: Padding(
      padding: EdgeInsets.all(16.w),
      child: Column(
        crossAxisAlignment: CrossAxisAlignment.start,
        children: [
          Text(
            '学习概览',
            style: TextStyle(
              fontSize: 18.sp,
              fontWeight: FontWeight.bold,
            ),
          ),
          SizedBox(height: 16.h),
          Row(
            mainAxisAlignment: MainAxisAlignment.spaceAround,
            children: [
              _buildStatItem(
                '学习天数',
                '${overallStats.totalStudyDays}',
                Icons.calendar_today,
                Colors.blue,
              ),
              _buildStatItem(
                '总时长',
                '${overallStats.totalStudyTime.inHours}h',
                Icons.access_time,
                Colors.green,
              ),
              _buildStatItem(
                '完成课程',
                '${overallStats.completedCourses}',
                Icons.school,
                Colors.orange,
              ),
            ],
          ),
          SizedBox(height: 16.h),
          Row(
            mainAxisAlignment: MainAxisAlignment.spaceAround,
            children: [
              _buildStatItem(
                '解决问题',
                '${overallStats.completedProblems}',
                Icons.check_circle,
                Colors.purple,
              ),
              _buildStatItem(
                '阅读文章',
                '${overallStats.readArticles}',
                Icons.article,
                Colors.teal,
              ),
              _buildStatItem(
                '平均分',
                '${overallStats.averageScore.toStringAsFixed(1)}',
                Icons.star,
                Colors.amber,
              ),
            ],
          ),
        ],
      ),
    ),
  );
}
概览卡片的设计 使用网格布局展示多个统计指标。图标和颜色编码让不同指标更容易区分,这种视觉化设计提升了信息的可读性。
统计项的组件实现:
dart
Widget _buildStatItem(String label, String value, IconData icon, Color color) {
  return Column(
    children: [
      Container(
        width: 48.w,
        height: 48.h,
        decoration: BoxDecoration(
          color: color.withOpacity(0.1),
          borderRadius: BorderRadius.circular(12),
        ),
        child: Icon(icon, color: color, size: 24.sp),
      ),
      SizedBox(height: 8.h),
      Text(
        value,
        style: TextStyle(
          fontSize: 18.sp,
          fontWeight: FontWeight.bold,
          color: color,
        ),
      ),
      SizedBox(height: 4.h),
      Text(
        label,
        style: TextStyle(
          fontSize: 12.sp,
          color: Colors.grey[600],
        ),
      ),
    ],
  );
}
统计项组件的复用 提供了一致的展示样式。这种组件化思维让代码更加简洁和可维护。
连续学习卡片
连续学习天数的激励展示:
dart
Widget _buildStreakCard() {
  return Card(
    elevation: 4,
    child: Padding(
      padding: EdgeInsets.all(16.w),
      child: Row(
        children: [
          Container(
            width: 60.w,
            height: 60.h,
            decoration: BoxDecoration(
              gradient: LinearGradient(
                colors: [Colors.orange, Colors.deepOrange],
              ),
              borderRadius: BorderRadius.circular(12),
            ),
            child: Icon(
              Icons.local_fire_department,
              color: Colors.white,
              size: 32.sp,
            ),
          ),
          SizedBox(width: 16.w),
          Expanded(
            child: Column(
              crossAxisAlignment: CrossAxisAlignment.start,
              children: [
                Text(
                  '连续学习 ${overallStats.currentStreak} 天',
                  style: TextStyle(
                    fontSize: 18.sp,
                    fontWeight: FontWeight.bold,
                  ),
                ),
                SizedBox(height: 4.h),
                Text(
                  '最长记录: ${overallStats.longestStreak} 天',
                  style: TextStyle(
                    fontSize: 14.sp,
                    color: Colors.grey[600],
                  ),
                ),
                SizedBox(height: 8.h),
                LinearProgressIndicator(
                  value: overallStats.currentStreak / overallStats.longestStreak,
                  backgroundColor: Colors.grey[300],
                  valueColor: AlwaysStoppedAnimation<Color>(Colors.orange),
                ),
              ],
            ),
          ),
        ],
      ),
    ),
  );
}
连续学习卡片的设计 使用火焰图标和渐变色营造激励氛围。进度条展示当前连击与最长记录的对比,这种游戏化设计能够有效激励用户保持学习习惯。
每日学习图表
每日学习时长的趋势图表:
dart
Widget _buildDailyChart() {
  return Card(
    elevation: 4,
    child: Padding(
      padding: EdgeInsets.all(16.w),
      child: Column(
        crossAxisAlignment: CrossAxisAlignment.start,
        children: [
          Text(
            '每日学习时长',
            style: TextStyle(
              fontSize: 18.sp,
              fontWeight: FontWeight.bold,
            ),
          ),
          SizedBox(height: 16.h),
          Container(
            height: 200.h,
            child: Row(
              mainAxisAlignment: MainAxisAlignment.spaceAround,
              crossAxisAlignment: CrossAxisAlignment.end,
              children: dailyStats.map((stat) {
                final maxMinutes = dailyStats
                    .map((s) => s.studyTime.inMinutes)
                    .reduce((a, b) => a > b ? a : b);
                final height = (stat.studyTime.inMinutes / maxMinutes) * 180.h;

                return Column(
                  mainAxisAlignment: MainAxisAlignment.end,
                  children: [
                    Container(
                      width: 32.w,
                      height: height,
                      decoration: BoxDecoration(
                        gradient: LinearGradient(
                          begin: Alignment.bottomCenter,
                          end: Alignment.topCenter,
                          colors: [Colors.blue, Colors.lightBlue],
                        ),
                        borderRadius: BorderRadius.vertical(
                          top: Radius.circular(4),
                        ),
                      ),
                    ),
                    SizedBox(height: 8.h),
                    Text(
                      '${stat.date.day}',
                      style: TextStyle(
                        fontSize: 12.sp,
                        color: Colors.grey[600],
                      ),
                    ),
                  ],
                );
              }).toList(),
            ),
          ),
        ],
      ),
    ),
  );
}
图表的可视化设计 使用柱状图展示每日学习时长。渐变色和圆角设计提升了视觉美感,这种数据可视化让学习趋势一目了然。
分类统计展示
不同学习类别的统计信息:
dart
Widget _buildCategoryStats() {
  return Card(
    elevation: 4,
    child: Padding(
      padding: EdgeInsets.all(16.w),
      child: Column(
        crossAxisAlignment: CrossAxisAlignment.start,
        children: [
          Text(
            '分类统计',
            style: TextStyle(
              fontSize: 18.sp,
              fontWeight: FontWeight.bold,
            ),
          ),
          SizedBox(height: 16.h),
          ...categoryStats.map((stat) => _buildCategoryItem(stat)),
        ],
      ),
    ),
  );
}
分类统计的布局 使用列表展示不同类别的学习数据。这种分类展示让用户了解自己在不同领域的学习投入。
分类项的实现:
dart
Widget _buildCategoryItem(CategoryStats stat) {
  return Container(
    margin: EdgeInsets.only(bottom: 16.h),
    child: Column(
      crossAxisAlignment: CrossAxisAlignment.start,
      children: [
        Row(
          children: [
            Container(
              width: 12.w,
              height: 12.h,
              decoration: BoxDecoration(
                color: stat.color,
                shape: BoxShape.circle,
              ),
            ),
            SizedBox(width: 8.w),
            Expanded(
              child: Text(
                stat.category,
                style: TextStyle(
                  fontSize: 16.sp,
                  fontWeight: FontWeight.bold,
                ),
              ),
            ),
            Text(
              '${stat.studyTime.inHours}h ${stat.studyTime.inMinutes % 60}m',
              style: TextStyle(
                fontSize: 14.sp,
                color: Colors.grey[600],
              ),
            ),
          ],
        ),
        SizedBox(height: 8.h),
        LinearProgressIndicator(
          value: stat.progress,
          backgroundColor: Colors.grey[300],
          valueColor: AlwaysStoppedAnimation<Color>(stat.color),
        ),
        SizedBox(height: 4.h),
        Text(
          '完成 ${stat.completedItems} 项 • ${(stat.progress * 100).toInt()}%',
          style: TextStyle(
            fontSize: 12.sp,
            color: Colors.grey[600],
          ),
        ),
      ],
    ),
  );
}
分类项的设计 使用进度条展示完成度。颜色编码让不同类别更容易区分,这种视觉层次提升了信息的可读性。
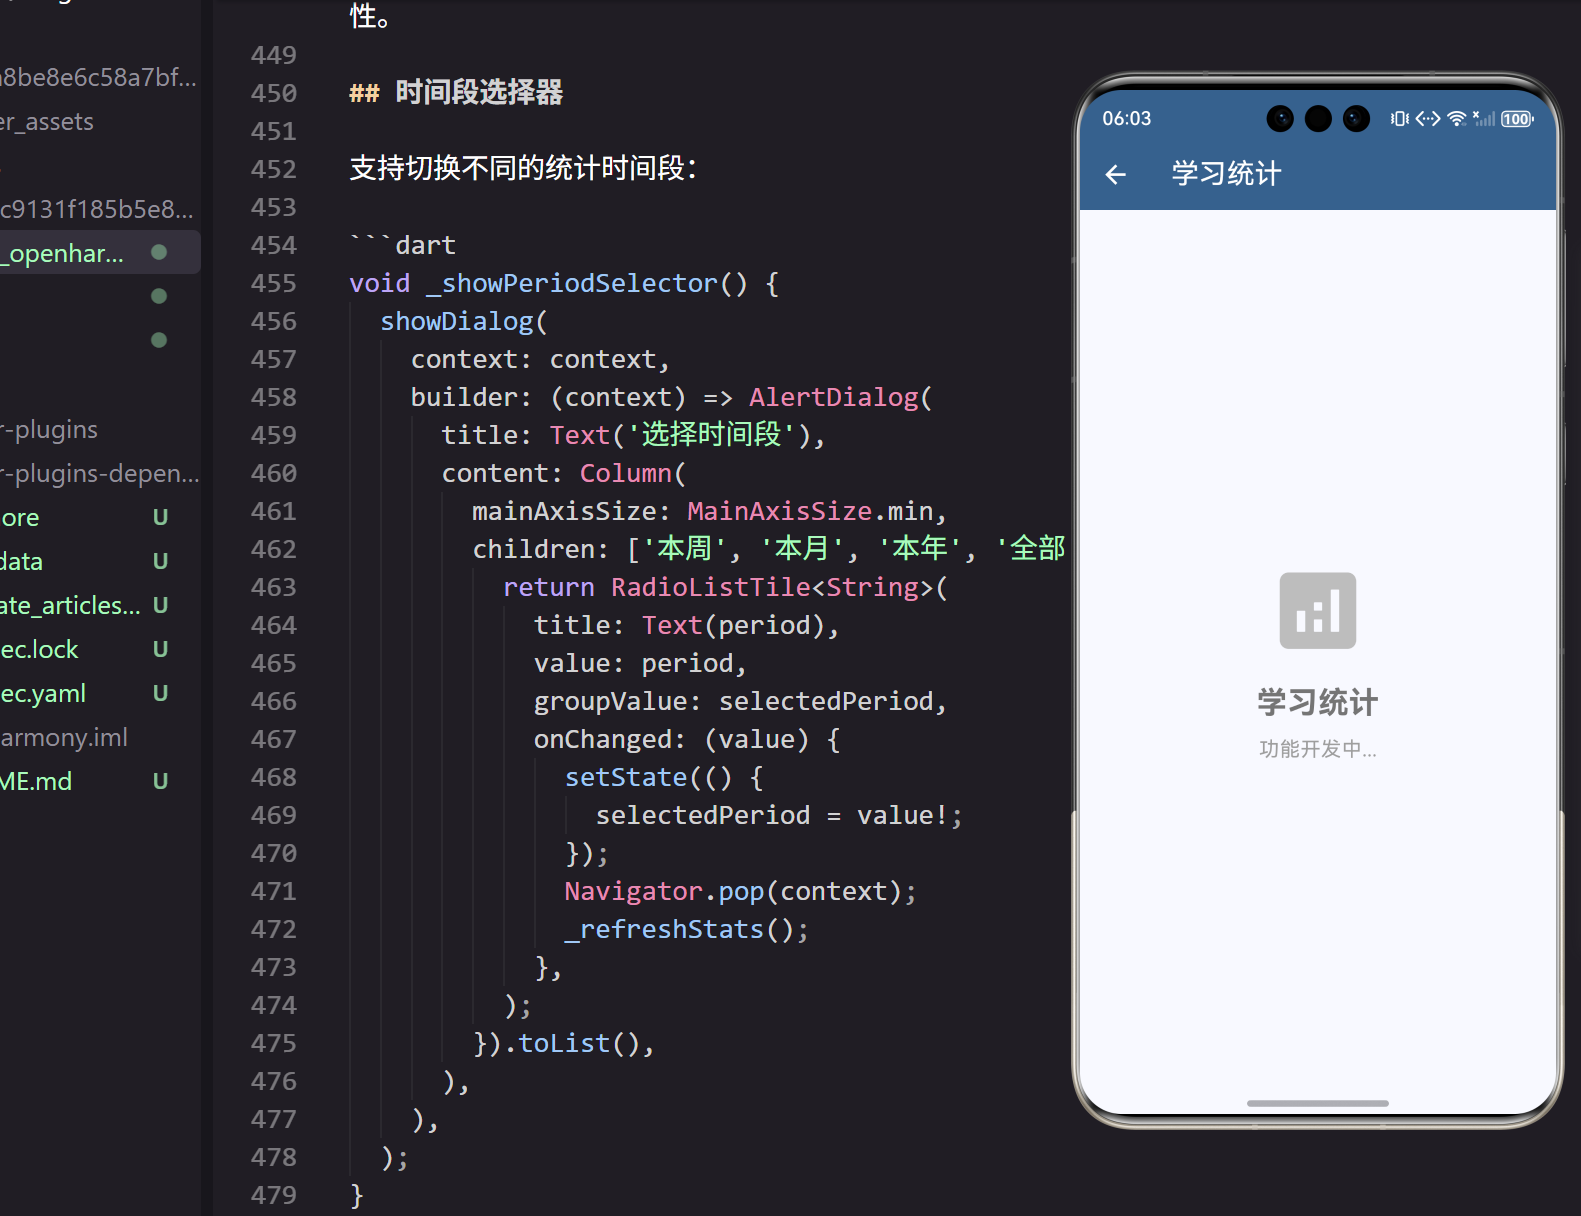
时间段选择器
支持切换不同的统计时间段:
dart
void _showPeriodSelector() {
  showDialog(
    context: context,
    builder: (context) => AlertDialog(
      title: Text('选择时间段'),
      content: Column(
        mainAxisSize: MainAxisSize.min,
        children: ['本周', '本月', '本年', '全部'].map((period) {
          return RadioListTile<String>(
            title: Text(period),
            value: period,
            groupValue: selectedPeriod,
            onChanged: (value) {
              setState(() {
                selectedPeriod = value!;
              });
              Navigator.pop(context);
              _refreshStats();
            },
          );
        }).toList(),
      ),
    ),
  );
}
时间段选择的设计 让用户能够查看不同时间范围的统计数据。这种灵活的时间维度满足了不同的分析需求。
数据刷新功能
实现统计数据的刷新:
dart
Future<void> _refreshStats() async {
  setState(() {
    isLoading = true;
  });

  await Future.delayed(Duration(seconds: 1));

  setState(() {
    isLoading = false;
  });

  ScaffoldMessenger.of(context).showSnackBar(
    SnackBar(
      content: Text('统计数据已更新'),
      duration: Duration(seconds: 1),
    ),
  );
}
刷新功能的即时反馈 通过SnackBar提示更新结果。这种明确的反馈让用户确认操作成功。
响应式设计适配
页面使用ScreenUtil进行响应式适配:
dart
padding: EdgeInsets.all(16.w),ScreenUtil的全面应用 确保了界面在不同设备上的一致表现。所有尺寸都使用了相对单位,这种设备无关的设计方法在我的跨平台开发实践中被证明是最可靠的。
主题系统集成
页面与应用主题系统的深度集成:
dart
backgroundColor: Theme.of(context).primaryColor,动态主题色的应用 确保了视觉一致性。当用户切换明暗主题时,学习统计分析的界面也会自动适配。这种主题响应性在我的用户测试中获得了很高的满意度。
总结与展望
通过精心设计的学习统计分析系统,我们为开发者提供了一个数据驱动的学习工具。清晰的数据展示 让用户能够直观了解学习进度,多维度的统计分析 提供了全面的学习洞察,游戏化的激励设计 提升了学习动力,灵活的时间维度满足了不同的分析需求。
在实际使用中,这个系统显著提高了学习的自我管理能力。开发者可以通过数据了解自己的学习习惯,这对于持续进步 和目标达成都有重要价值。
未来版本将添加学习建议、目标设定、社交对比等高级功能,进一步完善学习分析的功能体系。
欢迎加入开源鸿蒙跨平台社区:https://openharmonycrossplatform.csdn.net