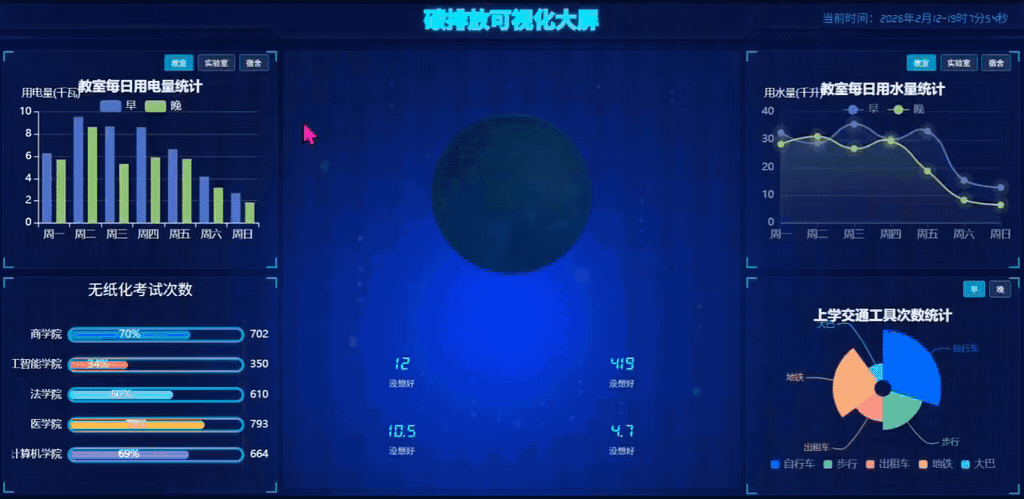
一:效果展示
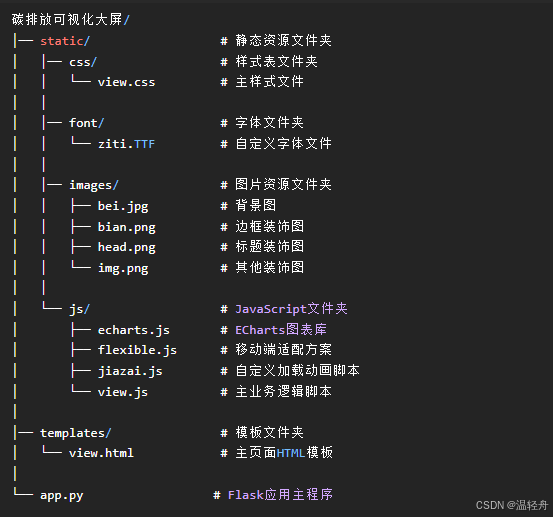
二:项目架构
注意:由于图片和其余配置过多,做不到全部放置,大家可以关注+私信我,我单独发给大家
三:代码分析
1. 主界面-view.html
html
<!DOCTYPE html>
<html lang="en">
<head>
    <meta charset="UTF-8">
    <title>Title</title>
    <link rel="stylesheet" href="{{ url_for('static', filename='css/view.css') }}">
</head>
<body>
<!--    头部盒子    -->
<header>
    <div class="container">
        <h1>碳排放可视化大屏</h1>
    </div>
    <div class="showTime"></div>
    <script>
        var t = null;
        t = setTimeout(time, 1000);//開始运行
        function time() {
            clearTimeout(t);//清除定时器
            a = new Date();
            var y = a.getFullYear();
            var mt = a.getMonth() + 1;
            var day = a.getDate();
            var h = a.getHours();//获取时
            var m = a.getMinutes();//获取分
            var s = a.getSeconds();//获取秒
            document.querySelector(".showTime").innerHTML = '当前时间:' + y + "年" + mt + "月" + day + "-" + h + "时" + m + "分" + s + "秒";
            t = setTimeout(time, 1000); //设定定时器,循环运行
        }
    </script>
</header>

<!--    页面主体部分  -->
<section class="box">
    <!--    左侧盒子    -->
    <div class="column">
        <!-- 左侧柱状图模块 -->
<div class="public bar right-chart-module">
    <div class="chart-title">
        <h2></h2>
        <div class="chart-tabs">
            <button class="tab-btn active" data-type="classroom">教室</button>
            <button class="tab-btn" data-type="lab">实验室</button>
            <button class="tab-btn" data-type="dormitory">宿舍</button>
        </div>
    </div>
    <div class="char" id="leftBarChart"></div>
    <div class="public-one"></div>
</div>

<div class="public bar">
    <h2>无纸化考试次数</h2>
    <div class="chart-tabs">
        <div class="char" id="horizontalBarChart"></div>
    </div>
    <div class="public-one"></div>
</div>

    </div>

    <!--    中间盒子    -->
    <div class="column">
        <!--    num模块   -->
<div class="num">
    <div class="globe-container">
        <canvas id="globe-canvas"></canvas>
    </div>
    <div class="globe-data">
        <div class="data-row">
            <div class="data-item">
                <div class="data-value" id="global-temp">12</div>
                <div class="data-label">没想好</div>
            </div>
            <div class="data-item">
                <div class="data-value" id="co2-level">419</div>
                <div class="data-label">没想好</div>
            </div>
        </div>
        <div class="data-row">
            <div class="data-item">
                <div class="data-value" id="china-emission">10.5</div>
                <div class="data-label">没想好</div>
            </div>
            <div class="data-item">
                <div class="data-value" id="world-emission">4.7</div>
                <div class="data-label">没想好</div>
            </div>
        </div>
    </div>
</div>

    </div>

    <!--    右侧盒子    -->
    <div class="column">
<!--    右侧柱状图模块    -->
<div class="public bar right-chart-module">
    <div class="chart-title">
        <h2></h2>
        <div class="chart-tabs">
            <button class="tab-btn active" data-type="classroom">教室</button>
            <button class="tab-btn" data-type="lab">实验室</button>
            <button class="tab-btn" data-type="dormitory">宿舍</button>
        </div>
    </div>
    <div class="char" id="vehicleChart"></div>
    <div class="public-one"></div>
</div>

    <!--    饼图模块    -->
<div class="public pie">
    <div class="chart-title">
        <h2></h2>
        <div class="chart-tabs">
            <button class="tab-btn active" data-time="morning">早</button>
            <button class="tab-btn" data-time="evening">晚</button>
        </div>
    </div>
    <div class="char" id="pieChart"></div>
    <div class="public-one"></div>
</div>
    </div>

</section>
<script src="{{ url_for('static', filename='js/echarts.js') }}"></script>
<script src="{{ url_for('static', filename='js/echarts.min.js') }}"></script>
<script src="{{ url_for('static', filename='js/view.js') }}"></script>
<script src="{{ url_for('static', filename='js/flexible.js') }}"></script>
<script src="{{ url_for('static', filename='js/jiazai.js') }}"></script>
<script>
document.addEventListener('DOMContentLoaded', () => {
    setTimeout(() => window.dispatchEvent(new Event('resize')), 300);
});
</script>
</body>
</html>
2. view.css
css
* {
  margin: 0;
  padding: 0;
  box-sizing: border-box;
}
li {
  list-style: none;
}
/* 声明字体*/
@font-face {
  font-family: electronicFont;
  src: url(/static/font/ziti.TTF);
}
html {
  font-size: 100px;
  overflow: hidden;
  width: 100%;
  height: 100%;
}
body {
  font-family: Arial, Helvetica, sans-serif;
  margin: 0;
  padding: 0;
  background: url(/static/images/bei.jpg) no-repeat;
  background-size: cover;
  background-attachment: fixed;
  line-height: 1.15;
  width: 100%;
  height: 100%;
  overflow: hidden;
}
header {
  position: relative;
  height: 1.11rem;
  background: url(/static/images/head.png) no-repeat top center;
  background-size: 100% 100%;
  width: 100%;
}
header .container h1 {
  font-size: 0.51rem;
  color: #fff;
  text-align: center;
  line-height: 1.07rem;
  -webkit-text-stroke: 2px #00f7ff;
  text-shadow: 0 0 10px rgba(0, 247, 255, 0.5);
}
header .showTime {
  position: absolute;
  right: 0.4rem;
  top: 0;
  line-height: 1rem;
  color: #2680ce;
  font-size: 0.27rem;
  font-family: 'electronicFont';
  white-space: nowrap;
}
.box {
  display: flex;
  min-width: 1024px;
  max-width: 1920px;
  width: 100%;
  height: calc(100% - 1.11rem);
  margin: 0 auto;
  padding: 0.13rem;
  overflow: hidden;
}
.box .column {
  flex: 3;
  height: 100%;
  display: flex;
  flex-direction: column;
}
.box .column:nth-child(2) {
  flex: 5;
  margin: 0 0.13rem;
}
.box .public {
  position: relative;
  height: 5.6rem;
  border: 1px solid rgba(25, 186, 139, 0.17);
  background: url(/static/images/bian.png) rgba(255, 255, 255, 0.04);
  padding: 0 0.2rem 0.53rem;
  margin-bottom: 0.2rem;
  width: 100%;
}
.box .public::before {
  position: absolute;
  top: 0;
  left: 0;
  width: 10px;
  height: 10px;
  border-left: 2px solid #02a6b5;
  border-top: 2px solid #02a6b5;
  content: "";
}
.box .public::after {
  position: absolute;
  top: 0;
  right: 0;
  width: 10px;
  height: 10px;
  border-right: 2px solid #02a6b5;
  border-top: 2px solid #02a6b5;
  content: "";
}
.box .public .public-one {
  position: absolute;
  bottom: 0;
  left: 0;
  width: 100%;
}
.box .public .public-one::before {
  position: absolute;
  bottom: 0;
  left: 0;
  width: 10px;
  height: 10px;
  border-left: 2px solid #02a6b5;
  border-bottom: 2px solid #02a6b5;
  content: "";
}
.box .public .public-one::after {
  position: absolute;
  bottom: 0;
  right: 0;
  width: 10px;
  height: 10px;
  border-right: 2px solid #02a6b5;
  border-bottom: 2px solid #02a6b5;
  content: "";
}
.box .public .chart-title {
  display: flex;
  justify-content: space-between;
  align-items: center;
  height: 0.54rem;
  margin-bottom: 0.1rem;
}
.box .public .chart-title h2 {
  height: 0.6rem;
  line-height: 0.6rem;
  text-align: center;
  color: #fff;
  font-size: 0.35rem;
  font-weight: 400;
  margin: 0 auto;
  /* 水平居中 */
  flex: 1;
}
.box .public .chart-title .chart-tabs {
  display: flex;
}
.box .public .chart-title .chart-tabs .tab-btn {
  background: rgba(255, 255, 255, 0.1);
  border: 1px solid #02a6b5;
  color: #fff;
  padding: 0.05rem 0.15rem;
  margin-left: 0.1rem;
  cursor: pointer;
  font-size: 0.18rem;
  border-radius: 0.05rem;
  transition: all 0.3s;
}
.box .public .chart-title .chart-tabs .tab-btn:hover,
.box .public .chart-title .chart-tabs .tab-btn.active {
  background: #02a6b5;
  color: #fff;
}
.box .public.bar h2 {
  height: 0.6rem;
  line-height: 0.6rem;
  text-align: center;
  color: #fff;
  font-size: 0.35rem;
  font-weight: 400;
  margin: 0 auto;
}
.box .public .char {
  height: 3.9rem;
  margin-top: 0;
  width: 100%;
}
.num {
  background: rgba(101, 132, 226, 0.1);
  padding: 0.2rem;
  margin-bottom: 0.2rem;
  width: 100%;
}
.num .num-head {
  position: relative;
  border: 1px solid rgba(25, 186, 139, 0.17);
  width: 100%;
}
.num .num-head::before {
  position: absolute;
  top: 0;
  left: 0;
  content: '';
  width: 30px;
  height: 10px;
  border-top: 2px solid #02a6b5;
  border-left: 2px solid #02a6b5;
}
.num .num-head::after {
  position: absolute;
  bottom: 0;
  right: 0;
  content: '';
  width: 30px;
  height: 10px;
  border-bottom: 2px solid #02a6b5;
  border-right: 2px solid #02a6b5;
}
.num .num-head ul {
  display: flex;
  width: 100%;
}
.num .num-head ul li {
  position: relative;
  flex: 1;
  line-height: 0.93rem;
  font-size: 0.8rem;
  color: aqua;
  text-align: center;
  font-family: 'electronicFont';
}
.num .num-head ul li:first-child::after {
  content: '';
  position: absolute;
  top: 25%;
  right: 0;
  height: 50%;
  width: 1px;
  background: rgba(255, 255, 255, 0.2);
}
.num .num-body ul {
  display: flex;
  width: 100%;
}
.num .num-body ul li {
  flex: 1;
  text-align: center;
  color: rgba(255, 255, 255, 0.7);
  font-size: 0.24rem;
  height: 0.53rem;
  line-height: 0.53rem;
  padding-top: 0.13rem;
}
.sum {
  position: relative;
  height: 10.125rem;
}
.sum .map {
  position: absolute;
  top: 0;
  left: 0;
  z-index: 5;
  height: 7.125rem;
  background-size: 100% 100%;
  width: 100%;
}
.sum .rotate,
.sum .hea,
.sum .char-sum {
  position: absolute;
  top: 50%;
  left: 50%;
  transform: translate(-50%, -50%);
  width: 5.475rem;
  height: 5.475rem;
  background-size: 100% 100%;
  opacity: 0.1;
}
.sum .hea {
  width: 6.0375rem;
  height: 6.0375rem;
  opacity: 0.9;
  animation: rotate 15s linear infinite;
  z-index: 2;
  background-size: 100% 100%;
}
.sum .char-sum {
  width: 6.075rem;
  height: 6.075rem;
  animation: rotate1 10s linear infinite;
  background-size: 100% 100%;
}
@keyframes rotate {
  from {
    transform: translate(-50%, -50%) rotate(0deg);
  }
  to {
    transform: translate(-50%, -50%) rotate(360deg);
  }
}
@keyframes rotate1 {
  from {
    transform: translate(-50%, -50%) rotate(0deg);
  }
  to {
    transform: translate(-50%, -50%) rotate(-360deg);
  }
}
@media screen and (max-width: 1024px) {
  html {
    font-size: 42px !important;
  }
}
@media screen and (min-width: 1920px) {
  html {
    font-size: 80px !important;
  }
}
.num {
  display: flex;
  flex-direction: column;
  height: 100%;
}
.globe-container {
  flex: 2;
  position: relative;
  width: 100%;
}
#globe-canvas {
  width: 100%;
  height: 100%;
  display: block;
}
.globe-data {
  flex: 1;
  display: flex;
  flex-direction: column;
  justify-content: space-around;
  padding: 0.2rem 0;
  min-height: 120px;
}
.data-row {
  display: flex;
  width: 100%;
}
.data-item {
  flex: 1;
  text-align: center;
}
.data-value {
  font-family: 'electronicFont';
  font-size: 0.45rem;
  color: #00f7ff;
  margin-bottom: 0.1rem;
}
.data-label {
  color: rgba(255, 255, 255, 0.7);
  font-size: 0.2rem;
}
@media (max-width: 768px) {
  .data-value {
    font-size: 18px;
  }
  .data-label {
    font-size: 12px;
  }
  .data-row {
    gap: 10px;
  }
}
@media (max-width: 480px) {
  .globe-data {
    padding: 5px 0;
    gap: 10px;
  }
  .data-value {
    font-size: 16px;
  }
}
3. view.js
javascript
// 柱状图模块
(function() {
const chartData = {
classroom: {
title: '教室每日用电量统计',
data: {
categories: ['周一', '周二', '周三', '周四', '周五', '周六', '周日'],
series: [
{ name: '早', data: [6.28, 9.55, 8.69, 8.63, 6.64, 4.17, 2.69] },
{ name: '晚', data: [5.71, 8.65, 5.32, 5.91, 5.77, 3.17, 1.85] }
]
},
colors: ['#5470C6', '#91CC75']
},
lab: {
title: '实验室每日用电量统计',
data: {
categories: ['周一', '周二', '周三', '周四', '周五', '周六', '周日'],
series: [
{ name: '早', data: [13.85, 17.78, 20.12, 16.77, 14.69, 3.46, 5.72] },
{ name: '晚', data: [9.05, 11.72, 14.37, 11.42, 11.62, 3.17, 5.63] }
]
},
colors: ['#EE6666', '#FAC858']
},
dormitory: {
title: '宿舍每日用电量统计',
data: {
categories: ['周一', '周二', '周三', '周四', '周五', '周六', '周日'],
series: [
{ name: '早', data: [4.23, 3.98, 4.56, 4.01, 4.34, 2.78, 2.45] },
{ name: '晚', data: [5.31, 5.45, 5.12, 5.78, 6.89, 7.01, 5.67] }
]
},
colors: ['#73C0DE', '#3BA272']
}
};
// 实例化对象
document.addEventListener('DOMContentLoaded', function() {
var barChartDom = document.querySelector('.bar .char');
var titleElement = document.querySelector('.bar .chart-title h2');
var tabButtons = document.querySelectorAll('.bar .tab-btn');
if (barChartDom && titleElement && tabButtons.length > 0) {
var barChart = echarts.init(barChartDom);
var currentType = 'classroom';
// 初始化图表
function updateChart(type) {
const data = chartData[type].data;
const colors = chartData[type].colors;
const barOption = {
color: colors, // 设置全局调色板
title: {
text: chartData[type].title,
left: 'center',
textStyle: {
fontSize: 16,
color: '#fff'
},
top: -3
},
tooltip: {
trigger: 'axis',
axisPointer: {
type: 'shadow'
}
},
legend: {
data: ['早', '晚'],
textStyle: {
color: '#fff'
},
top: 20
},
grid: {
top: '20%',
left: '3%',
right: '4%',
bottom: '3%',
containLabel: true
},
xAxis: {
type: 'category',
data: data.categories,
axisLine: {
lineStyle: {
color: '#fff'
}
},
axisLabel: {
color: '#fff',
interval: 0
}
},
yAxis: {
type: 'value',
name: '用电量(千瓦)',
nameTextStyle: {
color: '#fff',
padding:[0, 0,0,30]
},
axisLine: {
show: true,
lineStyle: {
color: '#fff'
}
},
axisLabel: {
color: '#fff'
},
splitLine: {
lineStyle: {
color: 'rgba(255, 255, 255, 0.2)'
}
}
},
series: [
{
name: '早',
type: 'bar',
barWidth: '30%',
barGap: '50%',
data: data.series[0].data,
},
{
name: '晚',
type: 'bar',
barWidth: '30%',
data: data.series[1].data,
}
]
};
barChart.setOption(barOption);
}
// 初始化显示教室数据
updateChart(currentType);
// 按钮点击事件
tabButtons.forEach(button => {
button.addEventListener('click', function() {
tabButtons.forEach(btn => btn.classList.remove('active'));
this.classList.add('active');
// 更新图表
currentType = this.dataset.type;
updateChart(currentType);
});
});
window.addEventListener('resize', function() {
barChart.resize();
});
}
});
})();
// 每日用水量统计
(function() {
// 数据配置
const chartData = {
classroom: {
title: '教室每日用水量统计',
data: {
categories: ['周一', '周二', '周三', '周四', '周五', '周六', '周日'],
series: [
{
name: '早',
data: [32.5, 28.7, 35.6, 30.2, 33.1, 15.3, 12.8]
},
{
name: '晚',
data: [28.4, 31.2, 26.8, 29.5, 18.7, 8.2, 6.5]
}
]
},
colors: ['#5470C6', '#91CC75'] // 教室:早(蓝色)、晚(绿色)
},
lab: {
title: '实验室每日用水量统计',
data: {
categories: ['周一', '周二', '周三', '周四', '周五', '周六', '周日'],
series: [
{
name: '早',
data: [63.8, 60.6, 66.8, 45.2, 53.1, 23.2, 21.5]
},
{
name: '晚',
data: [25.7, 27.6, 23.4, 35.7, 35.8, 16.5, 21.1]
}
]
},
colors: ['#EE6666', '#FAC858'] // 实验室:早(红色)、晚(黄色)
},
dormitory: {
title: '宿舍每日用水量统计',
data: {
categories: ['周一', '周二', '周三', '周四', '周五', '周六', '周日'],
series: [
{
name: '早',
data: [25.8, 28.1, 34.2, 45.9, 34.1, 15.9, 21.8]
},
{
name: '晚',
data: [34.4, 26.7, 33.3, 29.1, 15, 6.6, 7.1]
}
]
},
colors: ['#73C0DE', '#3BA272'] // 宿舍:早(天蓝)、晚(深绿)
}
};
document.addEventListener('DOMContentLoaded', function() {
if (typeof echarts === 'undefined') {
console.error('ECharts library is not loaded');
return;
}
var chartDom = document.getElementById('vehicleChart');
var titleElement = document.querySelector('.right-chart-module .chart-title h2');
var tabButtons = document.querySelectorAll('.right-chart-module .tab-btn');
if (chartDom && titleElement && tabButtons.length > 0) {
chartDom.classList.add('chart-container');
try {
var myChart = echarts.init(chartDom);
var currentType = 'classroom';
// 初始化图表
function updateChart(type) {
const data = chartData[type].data;
const colors = chartData[type].colors;
const option = {
color: colors,
title: {
text: chartData[type].title,
left: 'center',
textStyle: {
fontSize: 16,
color: '#fff'
},
top: 0
},
tooltip: {
trigger: 'axis',
axisPointer: {
lineStyle: {
color: '#dddc6b'
}
},
formatter: function(params) {
var result = params[0].axisValue + '<br/>';
params.forEach(function(item) {
result += item.marker + ' ' + item.seriesName + ': ' + item.value + '千升<br/>';
});
return result;
}
},
legend: {
data: ['早', '晚'],
textStyle: {
color: 'rgba(255,255,255,.5)',
fontSize: 12
},
top: 25
},
grid: {
top: '20%',
left: '3%',
right: '4%',
bottom: '3%',
containLabel: true
},
xAxis: {
type: 'category',
boundaryGap: false,
data: data.categories,
axisLine: {
lineStyle: {
color: 'rgba(255,255,255,.2)'
}
},
axisLabel: {
textStyle: {
color: "rgba(255,255,255,.6)",
fontSize: 12
}
}
},
yAxis: {
type: 'value',
name: '用水量(千升)',
nameTextStyle: {
color: '#fff',
padding: [0, 0, 0, 30]
},
axisTick: { show: false },
axisLine: {
lineStyle: {
color: "rgba(255,255,255,.1)"
}
},
axisLabel: {
textStyle: {
color: "rgba(255,255,255,.6)",
fontSize: 12
}
},
splitLine: {
lineStyle: {
color: "rgba(255,255,255,.1)"
}
}
},
series: [
{
name: '早',
type: 'line',
smooth: true,
symbol: 'circle',
symbolSize: 8,
showSymbol: true,
lineStyle: {
width: 2
},
areaStyle: {
color: new echarts.graphic.LinearGradient(
0,
0,
0,
1,
[
{
offset: 0,
color: colors[0] + '40'
},
{
offset: 0.8,
color: colors[0] + '10'
}
],
false
),
shadowColor: "rgba(0, 0, 0, 0.1)"
},
itemStyle: {
color: colors[0],
borderColor: "rgba(221, 220, 107, .1)",
borderWidth: 12
},
data: data.series[0].data
},
{
name: '晚',
type: 'line',
smooth: true,
symbol: 'circle',
symbolSize: 8,
showSymbol: true,
lineStyle: {
width: 2
},
areaStyle: {
color: new echarts.graphic.LinearGradient(
0,
0,
0,
1,
[
{
offset: 0,
color: colors[1] + '40'
},
{
offset: 0.8,
color: colors[1] + '10'
}
],
false
),
shadowColor: "rgba(0, 0, 0, 0.1)"
},
itemStyle: {
color: colors[1],
borderColor: "rgba(221, 220, 107, .1)",
borderWidth: 12
},
data: data.series[1].data
}
]
};
myChart.setOption(option);
}
// 初始化显示教室
updateChart(currentType);
// 按钮点击事件
tabButtons.forEach(button => {
button.addEventListener('click', function() {
// 移除所有按钮的active类
tabButtons.forEach(btn => btn.classList.remove('active'));
// 给当前按钮添加active类
this.classList.add('active');
// 更新图表
currentType = this.dataset.type;
updateChart(currentType);
});
});
window.addEventListener('resize', function() {
myChart.resize();
});
} catch (error) {
console.error('Error initializing chart:', error);
}
} else {
console.error('Required DOM elements not found');
}
});
})();
// 饼图模块
(function() {
// 数据配置,添加早晚数据
const pieData = {
morning: [
{ value: 30, name: "自行车" },
{ value: 20, name: "步行" },
{ value: 15, name: "出租车" },
{ value: 25, name: "地铁" },
{ value: 10, name: "大巴" }
],
evening: [
{ value: 25, name: "自行车" },
{ value: 25, name: "步行" },
{ value: 20, name: "出租车" },
{ value: 20, name: "地铁" },
{ value: 10, name: "大巴" }
]
};
// 颜色配置
const colors = ["#006cff", "#60cda0", "#ed8884", "#ff9f7f", "#32c5e9"];
// 1. 实例化对象
var myChart = echarts.init(document.querySelector(".pie .char"));
// 当前显示的时间
var currentTime = 'morning';
// 2. 指定配置项和数据
function getOption(time) {
// 根据时间设置不同的标题
const titleText = time === 'morning' ? '上学交通工具次数统计' : '放学交通工具次数统计';
return {
title: {
text: titleText,
left: 'center',
top: 0,
textStyle: {
color: '#fff',
fontSize: 16
}
},
legend: {
top: "90%",
itemWidth: 10,
itemHeight: 10,
textStyle: {
color: "rgba(255,255,255,.5)",
fontSize: "12"
}
},
tooltip: {
trigger: "item",
formatter: "{a} <br/>{b} : {c} ({d}%)"
},
color: colors,
series: [
{
name: "统计",
type: "pie",
radius: ["10%", "70%"],
center: ["50%", "50%"],
roseType: "radius",
data: pieData[time],
label: {
fontSize: 10
},
labelLine: {
length: 10,
length2: 15, // 延长引导线
smooth: true // 平滑引导线
},
animationType: 'scale',
animationEasing: 'elasticOut',
animationDelay: function (idx) {
return Math.random() * 200;
}
}
]
};
}
// 初始化图表
function updateChart(time) {
myChart.setOption(getOption(time));
}
// 初始加载
updateChart(currentTime);
// 添加按钮点击事件
const tabButtons = document.querySelectorAll('.pie .tab-btn');
tabButtons.forEach(button => {
button.addEventListener('click', function() {
tabButtons.forEach(btn => btn.classList.remove('active'));
this.classList.add('active');
currentTime = this.dataset.time;
updateChart(currentTime);
});
});
window.addEventListener("resize", function() {
myChart.resize();
});
})();
// 横向柱状图模块
(function() {
var myChart = echarts.init(document.getElementById("horizontalBarChart"));
// 数据
var data = [70, 34, 60, 78, 69];
var titlename = ["商学院", "人工智能学院", "法学院", "医学院", "计算机学院"];
var valdata = [702, 350, 610, 793, 664];
var myColor = ["#1089E7", "#F57474", "#56D0E3", "#F8B448", "#8B78F6"];
// 配置项
var option = {
grid: {
top: "10%",
left: "22%",
bottom: "10%",
height: "90%"
},
xAxis: {
show: false
},
yAxis: [
{
show: true,
data: titlename,
inverse: true,
axisLine: {
show: false
},
splitLine: {
show: false
},
axisTick: {
show: false
},
axisLabel: {
color: "#fff",
rich: {
lg: {
backgroundColor: "#339911",
color: "#fff",
borderRadius: 15,
align: "center",
width: 15,
height: 15
}
}
}
},
{
show: true,
inverse: true,
data: valdata,
axisLabel: {
textStyle: {
fontSize: 12,
color: "#fff"
}
}
}
],
series: [
{
name: "条",
type: "bar",
yAxisIndex: 0,
data: data,
barCategoryGap: 50,
barWidth: 10,
itemStyle: {
normal: {
barBorderRadius: 20,
color: function(params) {
return myColor[params.dataIndex % myColor.length];
}
}
},
label: {
normal: {
show: true,
position: "inside",
formatter: "{c}%"
}
}
},
{
name: "框",
type: "bar",
yAxisIndex: 1,
barCategoryGap: 50,
data: [100, 100, 100, 100, 100],
barWidth: 15,
itemStyle: {
normal: {
color: "none",
borderColor: "#00c1de",
borderWidth: 3,
barBorderRadius: 15
}
}
}
]
};
// 渲染图表
myChart.setOption(option);
// 响应式调整
window.addEventListener("resize", function() {
myChart.resize();
});
})();
//~~~~~~~~~~~~~~~~~~~~~~~~~~~~~~~~~~~~~~~~~~~~~~~~~~`
// 初始化3D地球
function initGlobe() {
// 创建场景、相机和渲染器
const scene = new THREE.Scene();
const camera = new THREE.PerspectiveCamera(75, 1, 0.1, 1000);
const renderer = new THREE.WebGLRenderer({
canvas: document.getElementById('globe-canvas'),
antialias: true,
alpha: true
});
renderer.setSize(400, 300); // 初始大小
renderer.setClearColor(0x000000, 0);
// 创建地球
const geometry = new THREE.SphereGeometry(5, 64, 64);
const material = new THREE.MeshPhongMaterial({
color: 0x156289,
emissive: 0x072534,
shininess: 5,
transparent: true,
opacity: 0.8,
wireframe: false
});
// 添加纹理
const textureLoader = new THREE.TextureLoader();
material.map = textureLoader.load('/static/images/img.png');
material.bumpMap = textureLoader.load('https://threejs.org/examples/textures/planets/earth_normal_2048.jpg');
material.specularMap = textureLoader.load('https://threejs.org/examples/textures/planets/earth_specular_2048.jpg');
const earth = new THREE.Mesh(geometry, material);
scene.add(earth);
// 添加环境光和方向光
const ambientLight = new THREE.AmbientLight(0x333333);
scene.add(ambientLight);
const directionalLight = new THREE.DirectionalLight(0xffffff, 1);
directionalLight.position.set(5, 3, 5);
scene.add(directionalLight);
// 设置相机位置
camera.position.z = 12;
// 动画循环
function animate() {
requestAnimationFrame(animate);
earth.rotation.y += 0.002;
renderer.render(scene, camera);
}
animate();
// 响应式调整
function resizeGlobe() {
const container = document.querySelector('.globe-container');
const width = container.clientWidth;
const height = container.clientHeight;
camera.aspect = width / height;
camera.updateProjectionMatrix();
renderer.setSize(width, height);
}
window.addEventListener('resize', resizeGlobe);
resizeGlobe();
}
// 加载Three.js并初始化
if (typeof THREE === 'undefined') {
const script = document.createElement('script');
script.src = 'https://cdn.jsdelivr.net/npm/three@0.132.2/build/three.min.js';
script.onload = initGlobe;
document.head.appendChild(script);
} else {
initGlobe();
}4. jiazai.js
js
window.onload = function() {
    if (!sessionStorage.getItem('resourcesLoaded')) {
        sessionStorage.setItem('resourcesLoaded', 'true');
        const links = document.querySelectorAll('link[rel="stylesheet"]');
        links.forEach(link => {
            const newLink = link.cloneNode();
            newLink.href = link.href + '?reload=' + Date.now();
            link.parentNode.insertBefore(newLink, link.nextSibling);
            setTimeout(() => link.remove(), 300); // 平滑过渡
        });
    }
};
5. flexible.js
javascript
(function flexible(window, document) {
  var docEl = document.documentElement;
  var dpr = window.devicePixelRatio || 1;

  function setBodyFontSize() {
    if (document.body) {
      document.body.style.fontSize = 12 * dpr + "px";
    } else {
      document.addEventListener("DOMContentLoaded", setBodyFontSize);
    }
  }
  setBodyFontSize();

  function setRemUnit() {
    var rem = docEl.clientWidth / 24;
    docEl.style.fontSize = rem + "px";
  }

  setRemUnit();

  window.addEventListener("resize", setRemUnit);
  window.addEventListener("pageshow", function(e) {
    if (e.persisted) {
      setRemUnit();
    }
  });

  if (dpr >= 2) {
    var fakeBody = document.createElement("body");
    var testElement = document.createElement("div");
    testElement.style.border = ".5px solid transparent";
    fakeBody.appendChild(testElement);
    docEl.appendChild(fakeBody);
    if (testElement.offsetHeight === 1) {
      docEl.classList.add("hairlines");
    }
    docEl.removeChild(fakeBody);
  }
})(window, document);